Save 23% ($351) & Get a Free 1-1 Call with our Team ⏰ : 0d 2h 59m 44s

Disclaimer: This is not financial or investment advice. You are responsible for any capital-related decisions you make, and only you are accountable for the results.
Quick bridge from last week…
Last week, we maintained a largely neutral stance across majors, while outlining a bearish scenario as a conditional outcome. That bearish scenario, which although was not our base case, played out once Bitcoin lost the $80,500 region, leading to a sharp continuation toward the $74,000 liquidity zone, a level highlighted in the MD earlier. From there, price bounced a bit, and we are now seeing Bitcoin, Ethereum, and Solana all trading around major 2025 swing lows, levels that previously triggered strong upside reactions last year.Among the majors, Hyperliquid continues to stand out, defending the $28.39 support and reclaiming the daily 200 EMA. However, a confirmed base above the 200 EMA, especially on higher timeframes is still pending, so the neutral-bullish bias on HYPE remains intact.
In today’s analysis, we’ve added stablecoin dominance (USDT.D + USDC.D), which is now sitting at a high timeframe monthly supply zone. While no confirmation has appeared yet, this is an area where a reaction is statistically expected. We’ll be tracking this closely, as a rollover here could become an important tailwind for risk assets going forward.
TLDR
- Bitcoin: Broke below $80,500 and flushed into downside liquidity near $73,800. Bounce is coming from oversold conditions, but rallies are still relief bounces unless structure changed.
- Ethereum: Lost key supports and is now hovering near the June base ($2,100). This level is critical to hold. Due to oversold conditions bounce is possible, but structure remains weak unless strength is confirmed.
- Solana: Broke major supports and is trading near the April swing low ($95). This is a decisive HTF zone. Hold = rebound potential, lose = $80.2 opens.
- Hyperliquid: Strong relative performer and has reclaimed the daily 200 EMA, but needs to base above it to continue higher. Failure to hold the 200 EMA risks a pullback toward sub $25. Watch $33 closely.
- Aura: Bullish divergence remains intact, needs broader market and Solana strength for confirmation. Setup is forming.
- Stablecoin Dominance: Sitting at HTF supply, monthly supply zone. Downside continuation would support risk on conditions, but confirmation is still pending.
Bitcoin
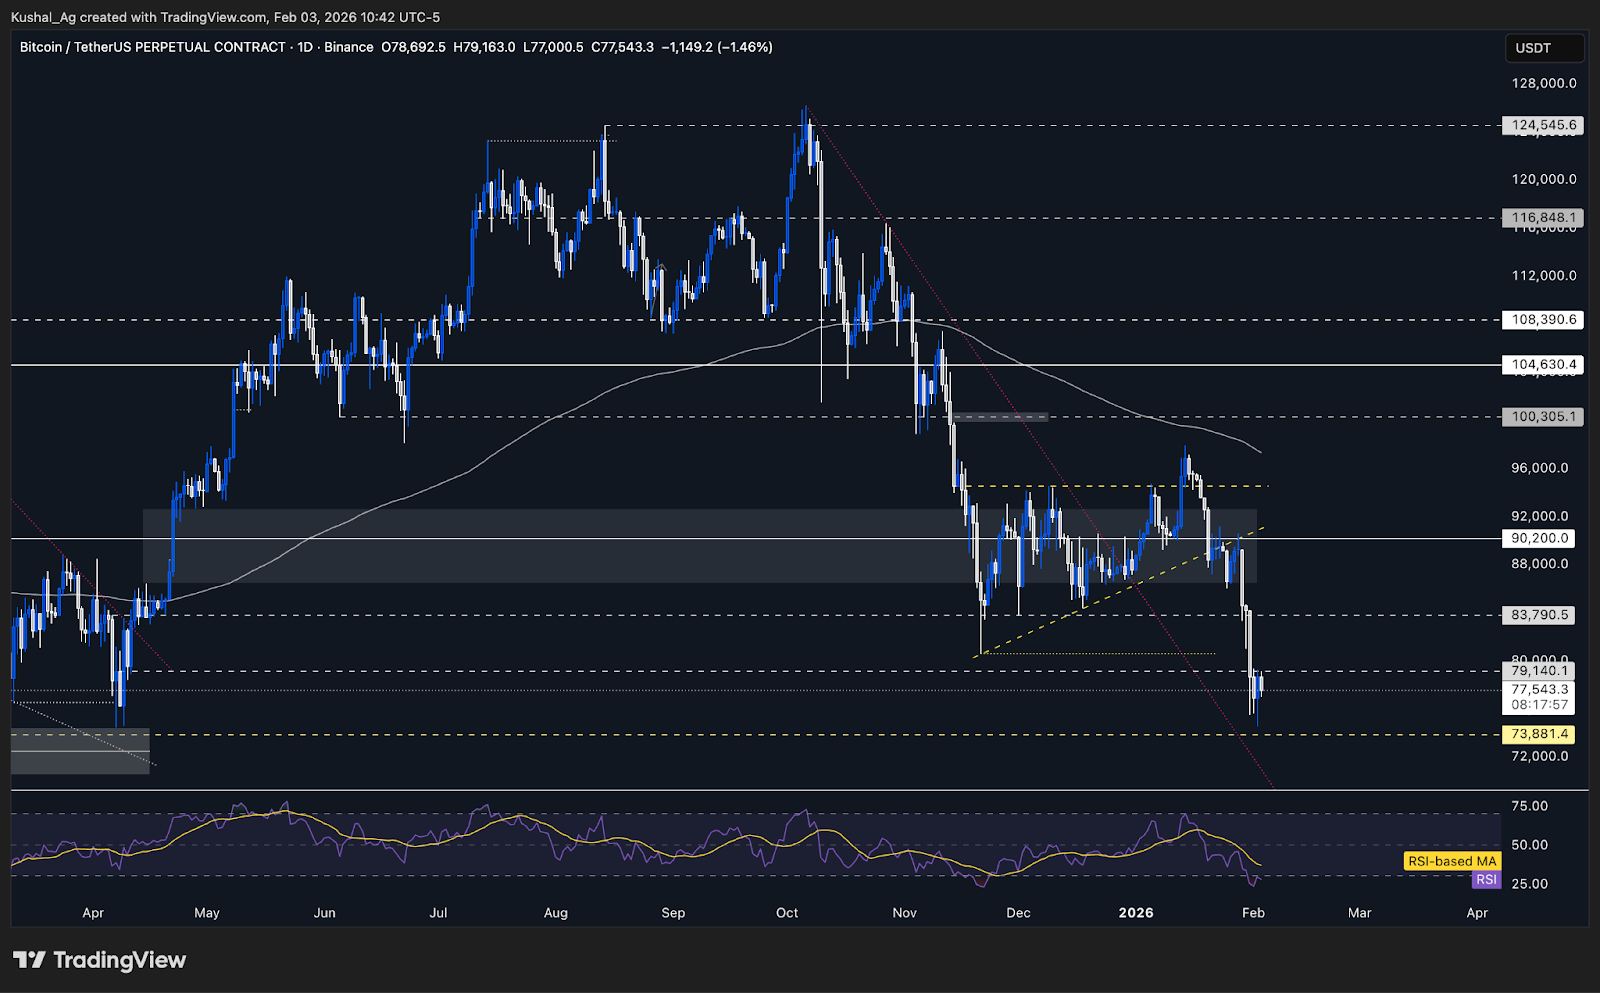
TABitcoin is currently trading in a new, lower range after decisively breaking below the $80,500 weekly liquidity level, which we had highlighted as the key invalidation point last week. Once that level failed, with follow through, price moved as outlined toward the $74K liquidity zone, bouncing just shy of the April 2024 swing low near $74,400. That low remains technically untaken, which keeps downside risk structurally open.
Since printing the recent low near $74,500, Bitcoin has shifted into a short term range between $73,800 and $79,140. Price has repeatedly pressed against the $79,140 resistance, suggesting a relief bounce may be developing. However, this move should be treated as counter-trend, not a structural reversal, given the broader breakdown from higher levels.
From a tactical perspective, a break above $79,140 opens room for a short-term push toward $81,000, followed by $83,790, both areas being logical relief targets after the recent sell-off. That said, unless Bitcoin can reclaim $90,200, any upside move remains a pullback.
On the downside, the market still has unfinished business below. If price fails to sustain above $73,800, there is a clear air-pocket toward the $70K-$70.5K region. This keeps downside liquidity firmly on the table even if we see a near term bounce.
RSI dipped deep into oversold territory 23 and is now stabilizing near 27, signalling potential relief in price. The 200 EMA continues to slope lower near $97,200, reinforcing that higher timeframe pressure remains intact.
Key Levels
- Next Support: 73,800
- Next Resistance: 79,140
- Direction: Neutral-bullish (short-term relief only)
- Upside Target: 81,000 and 83,790
- Downside Target: 70,500
Cryptonary’s Take
Bitcoin is likely entering a relief bounce phase, driven by deeply oversold conditions and no structural strength yet. A move toward $81K-$83.8K would be technically healthy but should be viewed as a pullback, not confirmation of a trend reversal.Unless Bitcoin reclaims $90,200, downside liquidity below $73.8K, and potentially $70K, remains active, and if prices do go lower, it might put in a potential bullish divergence in deep oversold levels, this would make a good setup for longs. We respect the bounce while remaining cautious about treating it as anything more than short-term relief.
Ethereum
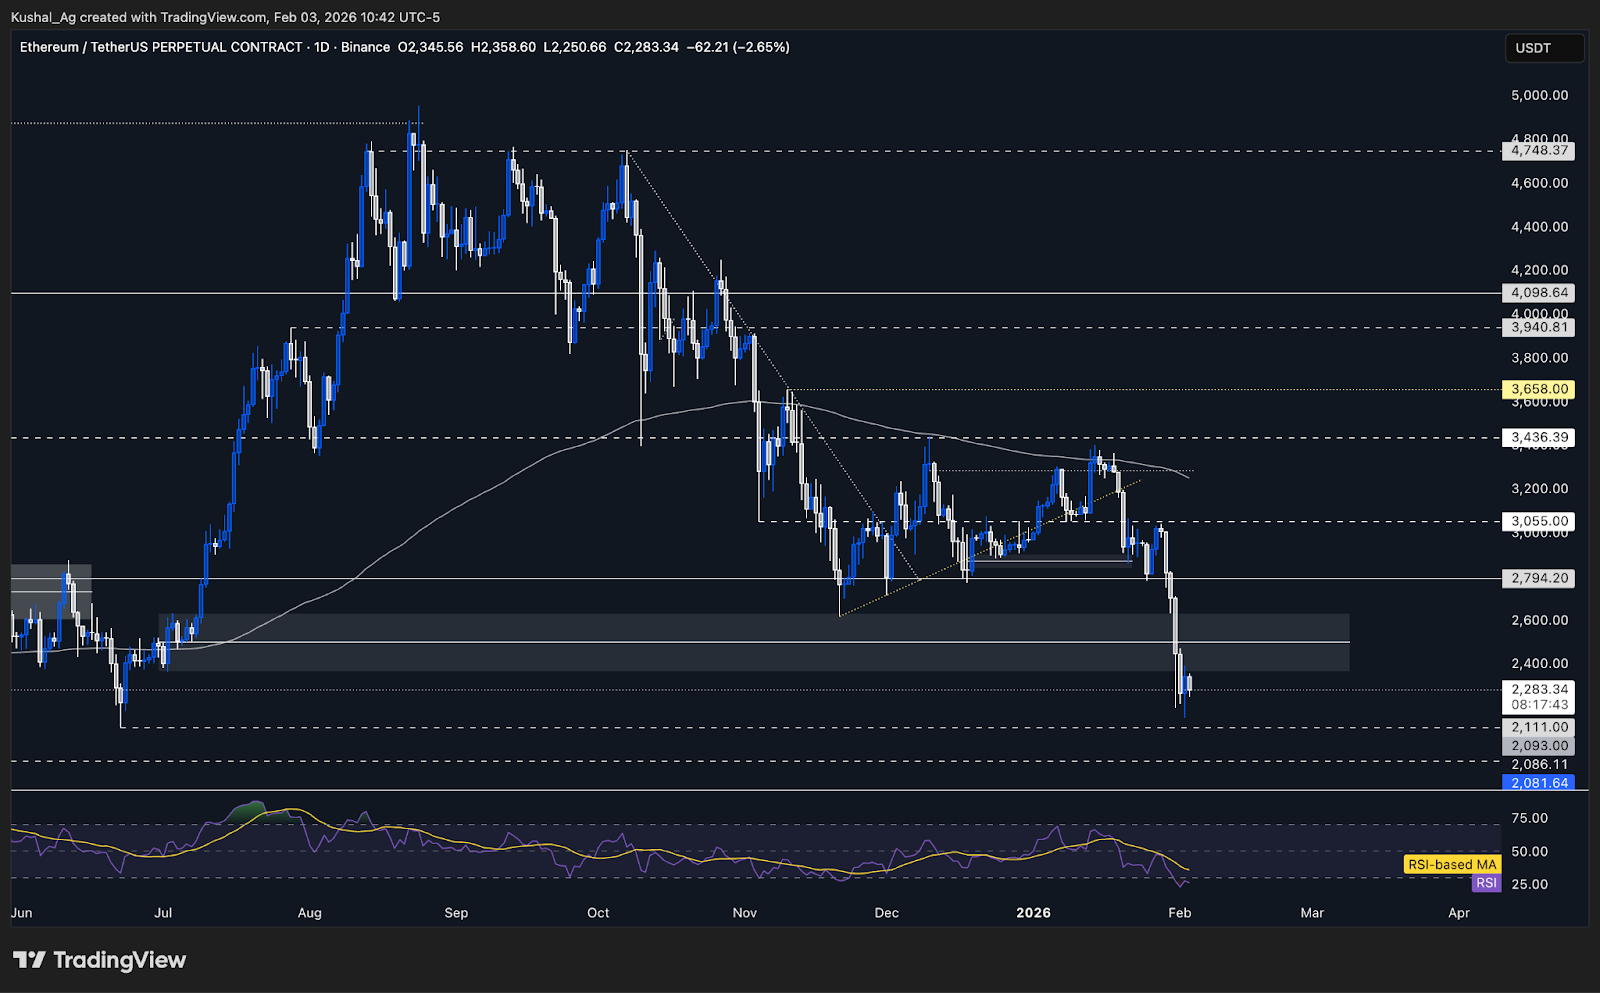
TAEthereum has seen a sharp downside expansion since the last analysis. After holding briefly around the $2,700 region, price broke down in sequence through $2,600 and $2,500, followed by a decisive loss of the weekly demand zone near $2,370. From there, Ethereum extended aggressively toward the $2,110-$2,150 region, reacting just above the June 2025 low, the same area from which the previous major expansion leg began.
This zone around $2,110 is structurally important on the weekly timeframe and has not yet been cleanly taken out. That keeps the possibility of short-term stabilization or a relief bounce alive. However, similar to Bitcoin, this does not constitute a confirmed bottom, it simply marks a key reaction zone where downside momentum may pause.
In the short term, Ethereum is now trading inside a new compressed range between $2,110 support and $2,370 resistance. A push back toward $2,370 and potentially $2,500 would be consistent with a relief move following such a sharp sell-off. That said, unless price reclaims higher structural levels, these moves should still be treated as pullbacks, not trend reversals.
If $2,110 fails with acceptance below it, the next major downside liquidity sits near $1,958. This is not the base case, but it remains firmly on the table if broader market pressure persists. On the upside, a true daily structural shift only comes into play above $3,043, which remains far overhead and acts as the equivalent of Bitcoin’s $90,200 level.
RSI is deeply oversold near 25,with average near 36 indicating, while the 200 EMA continues to slope lower around $3,250, confirming that higher timeframe pressure is still intact.
Key Levels
- Next Support: 2,110
- Next Resistance: 2,370
- Direction: Neutral-bullish (short-term relief)
- Upside Target: 2,500
- Downside Target: 1,958
Cryptonary’s Take
Ethereum is reacting from a major weekly support zone, and deeply oversold conditions make a short-term bounce likely. However, until price reclaims $2,370-$2,500, and eventually $3,043, all upside moves remain corrective in nature.We respect the bounce potential from $2,110, but structurally Ethereum still needs time. Any failure to hold this level reopens downside liquidity toward $1,958, and if this does happen, this might end up putting in a bullish divergence for ETH, while strength above higher levels would be required to shift the broader bias.
Solana
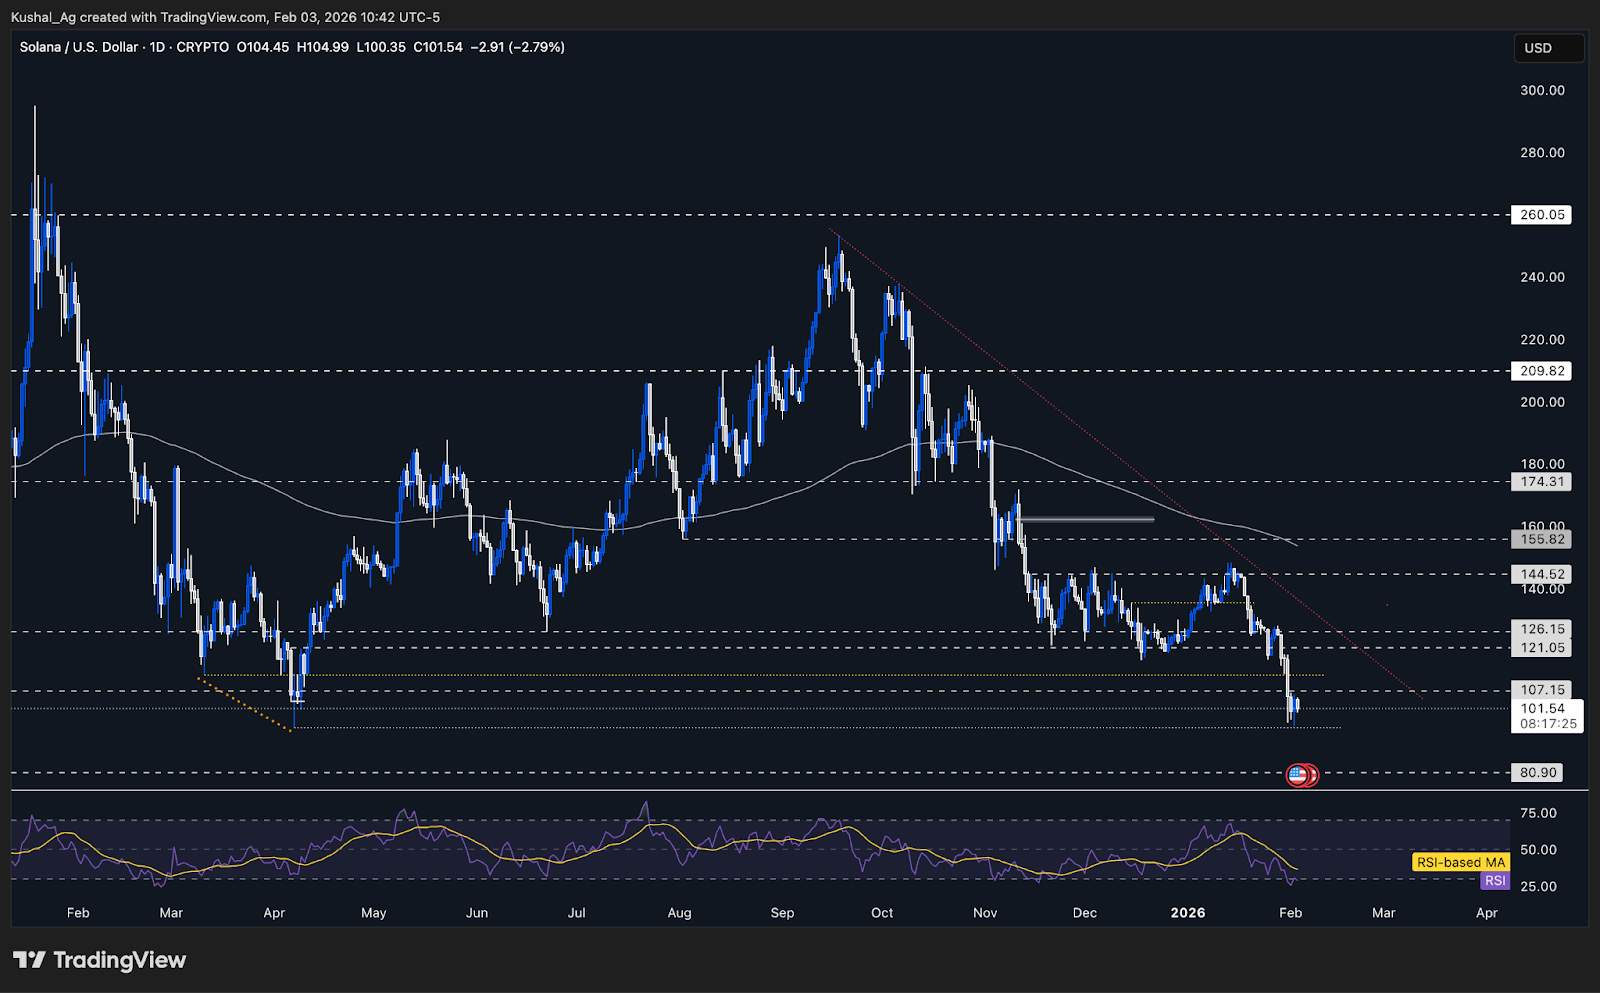
TASolana saw a sharp downside expansion following broader market weakness, breaking below multiple short-term support levels. After losing $112, price failed to hold $107 and extended lower toward the April 2025 low near $95.3, where it found a reaction. This is the same region from which Solana previously launched its strong rally earlier in the year, making it a high importance higher-timeframe support zone.
The entire $95-$110 region represents a long-term demand block that Solana has repeatedly respected over the past few years since early 2024. Price is now trading back inside this zone, at the bottom currently, which naturally shifts the focus to stabilisation and reaction. While structure has weakened on the way down, Solana is now operating in an area where downside momentum typically slows.
At this stage, Solana is best viewed as neutral. Being bearish into a multi-year support zone is not optimal, but there is also no confirmation of a reversal yet. For Solana to show constructive strength, either a reclaim and acceptance above $107-$112 is needed, or a final deviation below $95.3 followed by a strong reclaim. Until one of these scenarios plays out, price is likely to remain volatile inside this support band.
If support fails decisively, the next meaningful downside liquidity sits near $80.9. This is not the base case, but it remains a valid downside level if broader market pressure resumes. On the upside, only a reclaim of $128 would signal a proper structural shift and move Solana out of this corrective phase.
Momentum supports the idea of short-term relief as RSI is hovering near 30, while the 200 EMA continues to slope lower around $154, confirming that higher timeframe pressure has not yet reversed.
Key Levels
- Next Support: 95.3
- Next Resistance: 107
- Direction: Neutral
- Upside Target: 112
- Downside Target: 80.9
Cryptonary’s Take
Solana is trading inside a major higher-timeframe support zone, where reactions are expected but not guaranteed to evolve into trends. For now, this is a waiting phase.Strength above $107-$112 would improve structure, while a loss of $95.3 could either put in a bullish divergence if prices don't slip a lot below $95.3 and holds it, just retreats the lows, if not and prices continue to go down, it opens the door toward $80.9. Until either side resolves, Solana remains neutral, with any upside moves treated as relief bounces, not trend reversals.
Hyperliquid
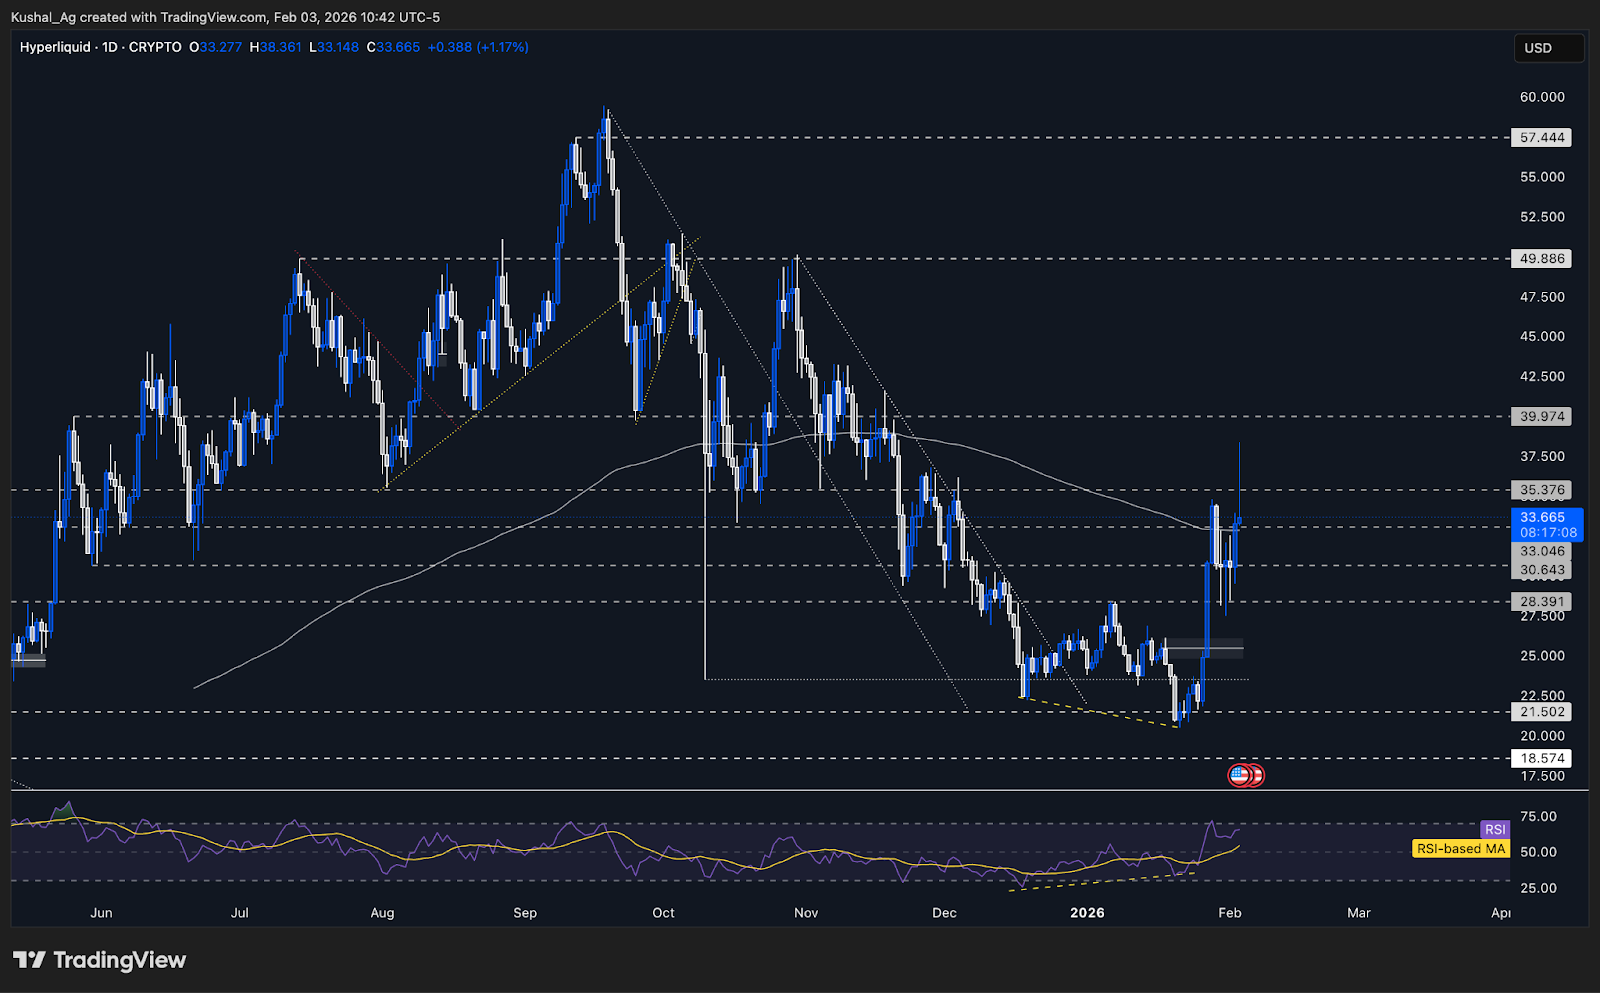
TAHYPE continues to display clear relative strength versus the broader market, a setup we’ve been tracking consistently since the confirmation above $23.5. While most majors have been working through downside liquidity, HYPE has remained structurally firm, with pullbacks being shallow and well defended.
After the recent rally, HYPE saw increased volatility but held the $28.39 support cleanly, which remains a key structural level. Price wicked below $30.64, but there was no daily acceptance below it, and the move quickly rotated back higher. This reinforces the idea that downside moves in HYPE are being absorbed quickly.
Price is now attempting to reclaim the 200 EMA on the daily timeframe. While this reclaim is still early and not yet confirmed by base-building, it is an important development. A sustained hold above the 200 EMA, followed by consolidation, would be the condition required to pivot from a neutral-bullish stance to a more decisive bullish bias.
Structurally, HYPE has only seen one clear upside shift so far, with $28.39 acting as the key higher low. A second structural shift, through sustained acceptance above recent highs, is still pending. Until that occurs, upside continuation is possible, but the stance remains measured.
RSI has pushed toward the upper range around 70, suggesting that sideways consolidation or shallow pullbacks would be the healthiest outcome before the next expansion.
Key Levels
- Next Support: 35.37
- Next Resistance: 39.97
- Direction: Neutral-Bullish
- Upside Target: 43.2
- Downside Target: 33
Cryptonary’s Take
HYPE remains one of the strongest charts in the market right now. Pullbacks are being treated as retracements, and structure remains intact above $28.39.However, without a confirmed base above the 200 EMA and a second structural shift, the bias stays neutral-bullish rather than fully bullish. Consolidation above $33-$35 would be the ideal setup for sustained continuation, while acceptance above $40 would likely open the next leg higher.
Aura
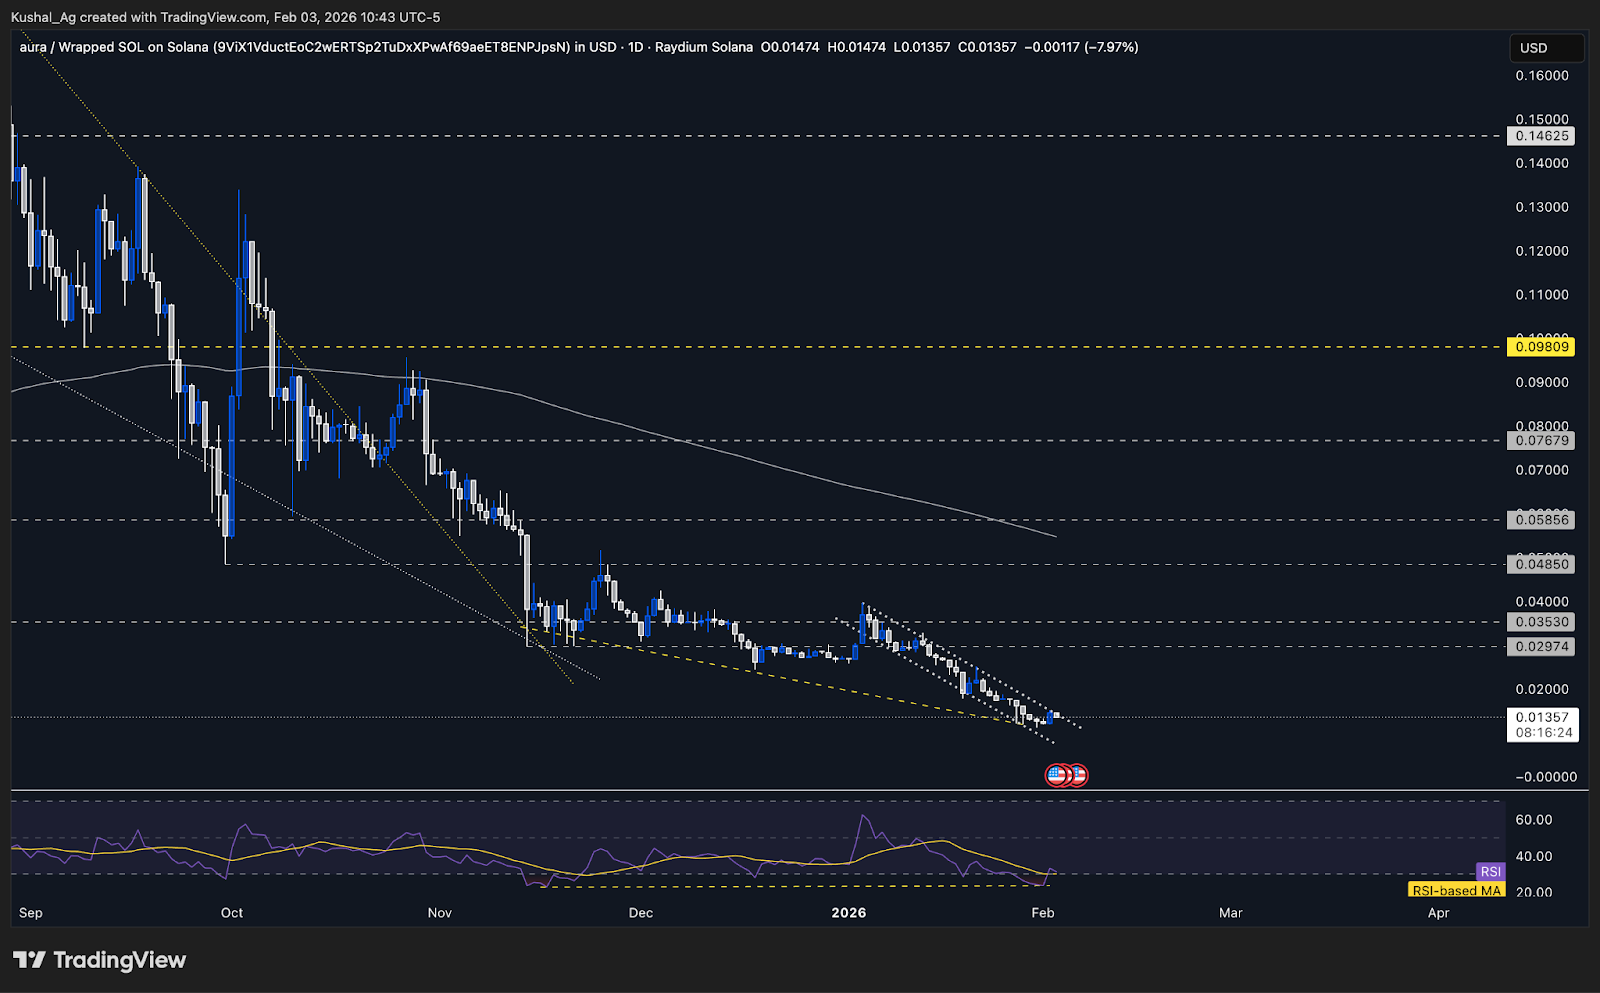
TAAura continues to trade under sustained selling pressure, with price compressing tightly after nearly a month of consistent downside since early January.
The potential bullish divergence setup remains in play. Price has printed a lower low compared to the November 2025 swing, but RSI has not confirmed this with a new lower low. This mismatch keeps the divergence thesis intact, even though confirmation is still pending. Importantly, price action is compressing within a narrow range, which often precedes a mean-reversion move once pressure eases.
Broader weakness across meme assets is largely a spillover effect from Solana breaking below key support levels. However, Aura has held up relatively better than many other memes, despite this pressure. Even during Solana’s breakdown, Aura avoided aggressive structural damage, which is something to keep on the radar.
For this compression to resolve to the upside, strength from Solana and the wider market is required. A relief move could quickly push Aura back toward the 0.03 region, but until market conditions improve, price is likely to remain range bound.
- Direction: Bullish
- Action Plan: DCA and Raid
Cryptonary’s Take
Auras' setup is constructive. The bullish divergence remains valid as long as RSI continues to hold higher lows, even if price briefly probes lower levels. Until Solana and the broader market show strength, patience is important. If momentum returns, Aura’s tight compression and unresolved divergence could fuel a sharp mean reversion move..USDT + USDC Dominance
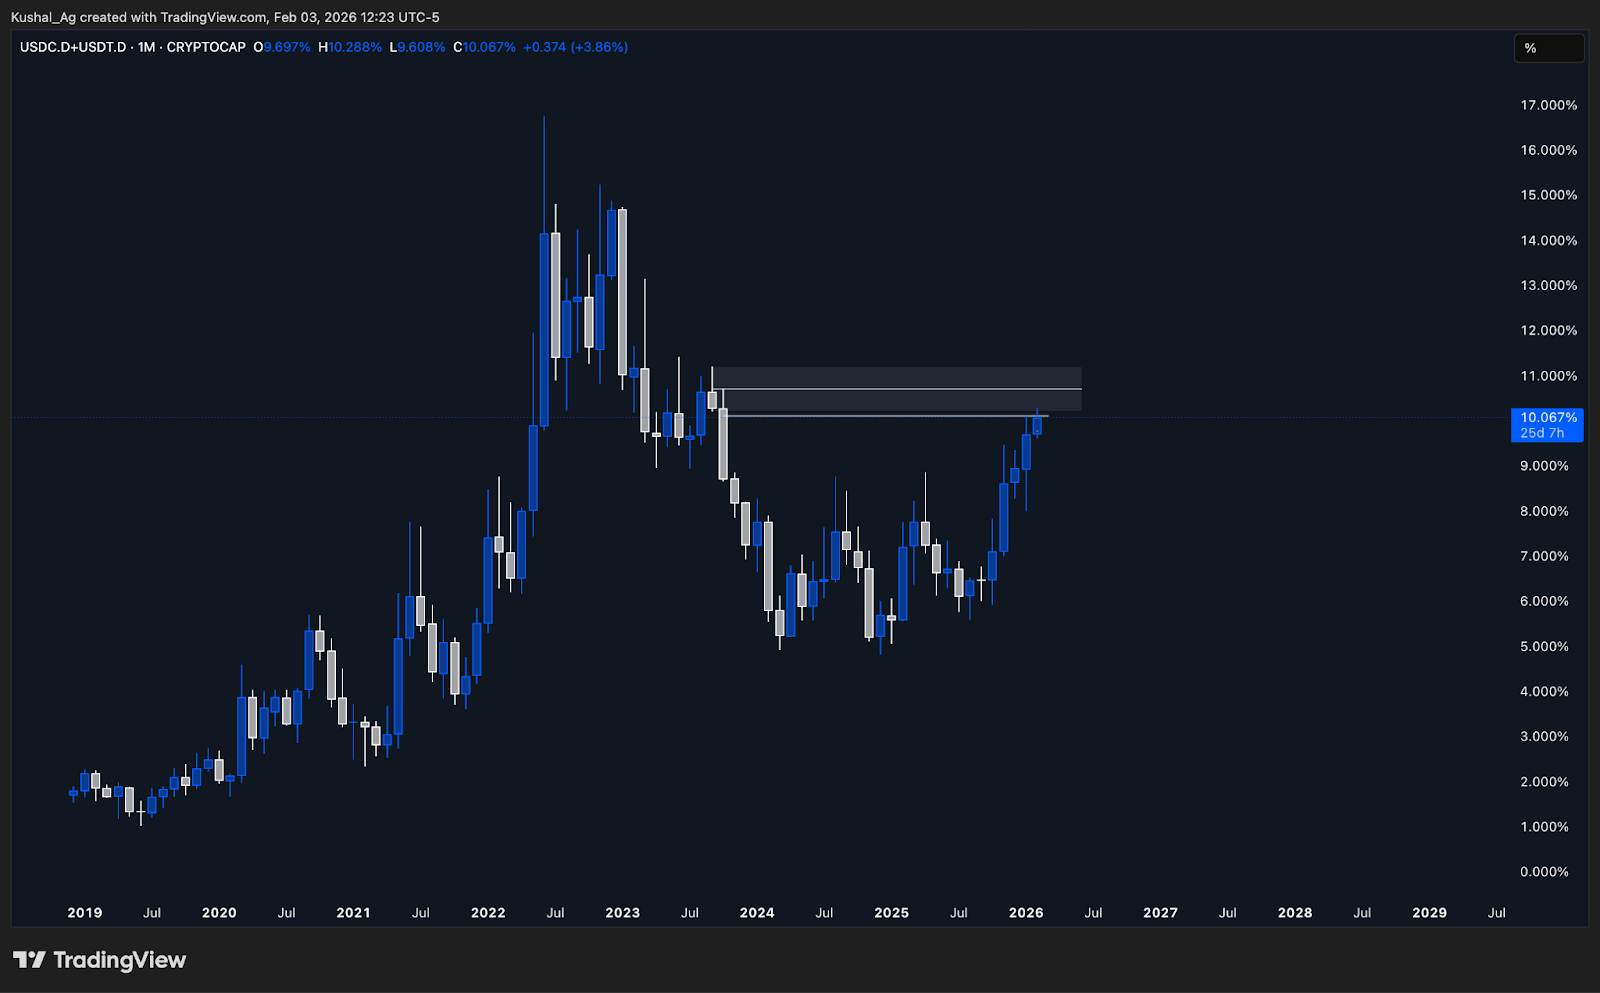
TAStablecoin dominance continues to sit at a very interesting inflection zone on the higher timeframes, particularly on the monthly chart. While there is no confirmed reversal yet, price is trading inside a clear supply area.
From a structure perspective, dominance has already spent significant time elevated, and momentum on the higher timeframe is no longer expanding aggressively. This suggests that upside continuation is becoming increasingly inefficient unless fresh demand enters, something we are not clearly seeing yet.
As long as this supply zone caps price, the path of least resistance remains lower, even if the move unfolds slowly. Any sustained weakness or rollover from this area would signal capital gradually rotating out of stablecoins and back into risk assets.
The first meaningful downside objective on the monthly timeframe sits at 79.8%, which is the initial level to watch for acceptance. A move toward this zone would align with improving conditions for majors and selective alt strength.
A deeper continuation toward the 75.9% region is possible over a multi month horizon, but that scenario requires clear follow through and confirmation. For now, this remains a secondary objective not a base case.
Stablecoin Dominance:
Cryptonary’s Take
USDT + USDC dominance being capped near a higher timeframe supply zone is constructive for risk assets, even without immediate confirmation. This is the kind of area where dominance often stalls before rolling over, and not accelerating higher.Closing Thoughts
Most majors are now trading in oversold territory, while Hyperliquid stands in sharp contrast, approaching overbought conditions. This divergence is important to note. Our prior neutral stance didn’t play out as the base case, but the bearish contingency we outlined did, with Bitcoin breaking below key levels and moving straight toward the $74K liquidity zone after a brief bounce.Given the oversold conditions across Bitcoin, Ethereum, and Solana, short-term relief bounces are likely, but for now these should still be treated as relief moves and not trend reversals, with the risk of lows being revisited remaining on the table. All majors are currently trading around critical 2025 swing lows, making this a key phase for the broader market.
Hyperliquid continues to show relative strength, and as long as it holds above reclaimed levels, pullbacks should be viewed as retracements, not breakdowns. We also added stablecoin dominance today, which is sitting at a monthly supply zone. Any confirmed rollover there would be a meaningful signal for risk assets, and we’ll be tracking that closely in upcoming market directions.
Cryptonary Out!
Continue reading by joining Cryptonary Pro
$1,548 $1,197/year
Get everything you need to actively manage your portfolio and stay ahead. Ideal for investors seeking regular guidance and access to tools that help make informed decisions.
For your security, all orders are processed on a secured server.
As a Cryptonary Pro subscriber, you also get:
3X Value Guarantee - If cumulative documented upside does not reach 300% during your 12-month membership, you can request a full refund. Terms
24/7 access to experts with 50+ years’ experience
All of our top token picks for 2025
On hand technical analysis on any token of your choice
Weekly livestreams & ask us anything with the team
Daily insights on Macro, Mechanics, and On-chain
Curated list of top upcoming airdrops (free money)
3X Value Guarantee
If cumulative documented upside does not reach 300% during your 12-month membership, you can request a full refund.
Our track record speaks for itself
With over 2.4M tokens and widespread misinformation in crypto, we cut through the noise and consistently find winning assets.
Our track record speaks for itself
With over 2.4M tokens and widespread misinformation in crypto, we cut
through the noise and consistently find winning assets.


Frequently Asked Questions
Can I trust Cryptonary's calls?
Yes. We've consistently identified winners across multiple cycles. Bitcoin under $1,000, Ethereum under $70, Solana under $10, WIF from $0.003 to $5, PopCat from $0.004 to $2, SPX blasting past $1.70, and our latest pick has already 200X'd since June 2025. Everything is timestamped and public record.
Do I need to be an experienced trader or investor to benefit?
No. When we founded Cryptonary in 2017 the market was new to everyone. We intentionally created content that was easy to understand and actionable. That foundational principle is the crux of Cryptonary. Taking complex ideas and opportunities and presenting them in a way a 10 year old could understand.
What makes Cryptonary different from free crypto content on YouTube or Twitter?
Signal vs noise. We filter out 99.9% of garbage projects, provide data backed analysis, and have a proven track record of finding winners. Not to mention since Cryptonary's inception in 2017 we have never taken investment, sponsorship or partnership. Compare this to pretty much everyone else, no track record, and a long list of partnerships that cloud judgements.
Why is there no trial or refund policy?
We share highly sensitive, time-critical research. Once it's out, it can't be "returned." That's why membership is annual only. Crypto success takes time and commitment. If someone is not willing to invest 12 months into their future, there is no place for them at Cryptonary.
Do I get direct access to the Cryptonary team?
Yes. You will have 24/7 to the team that bought you BTC at $1,000, ETH at $70, and SOL at $10. Through our community chats, live Q&As, and member only channels, you can ask questions and interact directly with the team. Our team has over 50 years of combined experience which you can tap into every single day.
How often is content updated?
Daily. We provide real-time updates, weekly reports, emergency alerts, and live Q&As when the markets move fast. In crypto, the market moves fast, in Cryptonary, we move faster.
How does the 3X Value Guarantee work?
We stand behind the value of our research. If the documented upside from our published research during your 12-month membership does not exceed three times (3X) the annual subscription cost, you can request a full refund. Historical context: In every completed market cycle since 2017, cumulative documented upside has exceeded 10X this threshold.
TermsRecommended from Cryptonary


