Save 23% ($351) & Get a Free 1-1 Call with our Team ⏰ : 0d 2h 59m 44s
BTC, ETH and More: Neutral Stance as Upside Liquidity in Play
Price action last week challenged our downside thesis in an important way. While supports were briefly lost, they were quickly reclaimed, and markets have stabilised since. Bitcoin holding above $65K amid geopolitical escalation reflects underlying demand rather than weakness. That shift does not signal a trend reversal, but it does warrant a more balanced posture going forward...

Disclaimer: This is not financial or investment advice. You are responsible for any capital-related decisions you make, and only you are accountable for the results.
Quick bridge from last week…
Last week, we were positioned for continued downside. Bitcoin and Ethereum both moved into their respective support levels initially as expected, and we did see breaks below those zones. However, instead of follow-through continuation, the move turned into a deviation. Price reclaimed those support levels and has continued to hold them since. That was not the base case, the base case was acceleration lower for BTC and ETH. Solana continued to respect the $78-$89 range without structural expansion, while Hyperliquid invalidated our previous bearish continuation thesis with a stronger than anticipated bounce from the outlined breaker block discussed in prior reports.Bitcoin holding $65,650 despite escalating geopolitical tensions was a surprise. That strength, combined with improving Bitcoin ETF flows, adds context to the current stabilization. We discussed these dynamics, including Middle East developments, oil reactions, ETF flows, and a few key TradeFi scripts, in detail in Monday’s Market Update. For the full macro overlay behind the technical setup, refer to that report here.
Disclaimer: This content is for informational and educational purposes only. It does not constitute financial advice, and should not be relied upon as a basis for making investment decisions. Virtual assets are volatile and may lose their value in full. Past performance does not indicate future results. Always do your own research.
TLDR
- Risk Posture: Neutral-Defensive - Markets are stabilising in the short-term, but no Higher timeframe trend reversal yet.
- BTC: $65,650 holding shifts bias to neutral. Above it, move towards $70.5K-$73.8K is possible. Below it, $62.8K becomes the key pivot for either a bullish divergence setup or continuation towards $59.8K-$57.3K.
- ETH: Pivot at $1,900. Holding keeps the range intact toward $2,116. Break below exposes $1,757-$1,615. Relative strength vs BTC remains soft.
- SOL: Clean range between $78-$89 continues. No breakout yet. Neutral until either side closes decisively.BTC
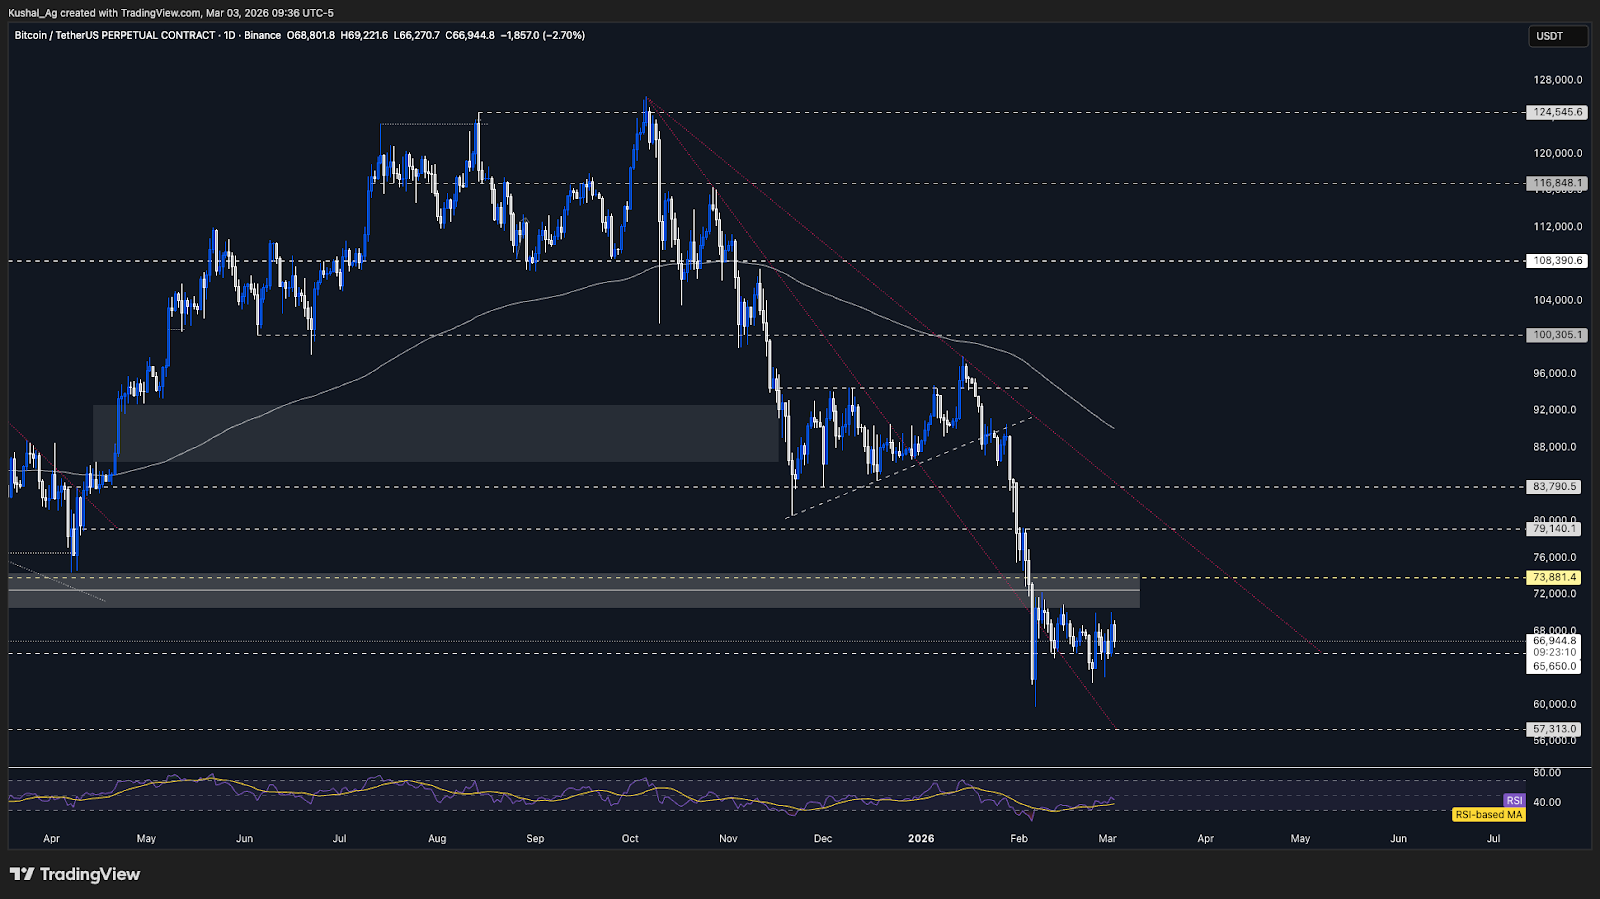
In the previous analysis, we expected Bitcoin to test $65,650 and break lower, and that breakdown did occur, however, the breakdown lacked follow-through. Bitcoin found strong demand at $62,800, wicked the entire move, and closed back above $65,650. That reclaim is important.
The $65,650 level now becomes the primary pivot. The fact that price broke below it and immediately reclaimed it shows that supply below that region was absorbed. Despite escalating geopolitical tensions, the level has continued to hold on daily closes. This is why we are shifting from a neutral-bearish stance to a more neutral bias for now.
$62,800 remains the structural daily swing low closing from early February. If price revisits that zone, it becomes the decisive point: either continuation toward $59,800-$57,300, or a potential bullish RSI divergence if momentum holds while price prints a marginal lower low.
On the upside, resistance remains at $70,500, followed by $73,800. If $65,650 continues to hold and we see another failed breakdown attempt followed by reclaim, liquidity above $70.5K becomes the next objective before any broader structural decision.
The 200 EMA continues to slope lower near $90,000, keeping higher-timeframe pressure intact. RSI has recovered to 42 with average around 38, showing stabilisation but not strength. Structure is balanced, neutral bias with clearly defined triggers.
Key Levels:
- Support: $65,650
- Resistance: $70,500
- Direction: Neutral (pivot at $65,650)
- Upside Target: $73,800
- Downside Target: $59,800 & $57,300
Cryptonary’s Take:
The reclaim of $65,650 changes short-term tone. We are no longer leaning actively bearish unless that level fails again on a daily close. However, higher-timeframe structure has not flipped bullish either.$62,800 is the real inflection. A break and deviation below that puts in a potential bullish divergence on BTC whereas a clean break below that opens acceleration toward the mid-high $50Ks.
Conversely, continued defence above $65,650 increases probability of liquidity sweeps toward $70.5-$73.8K before any deeper structural decision. For now, neutrality with clear triggers remains the stance.
ETH
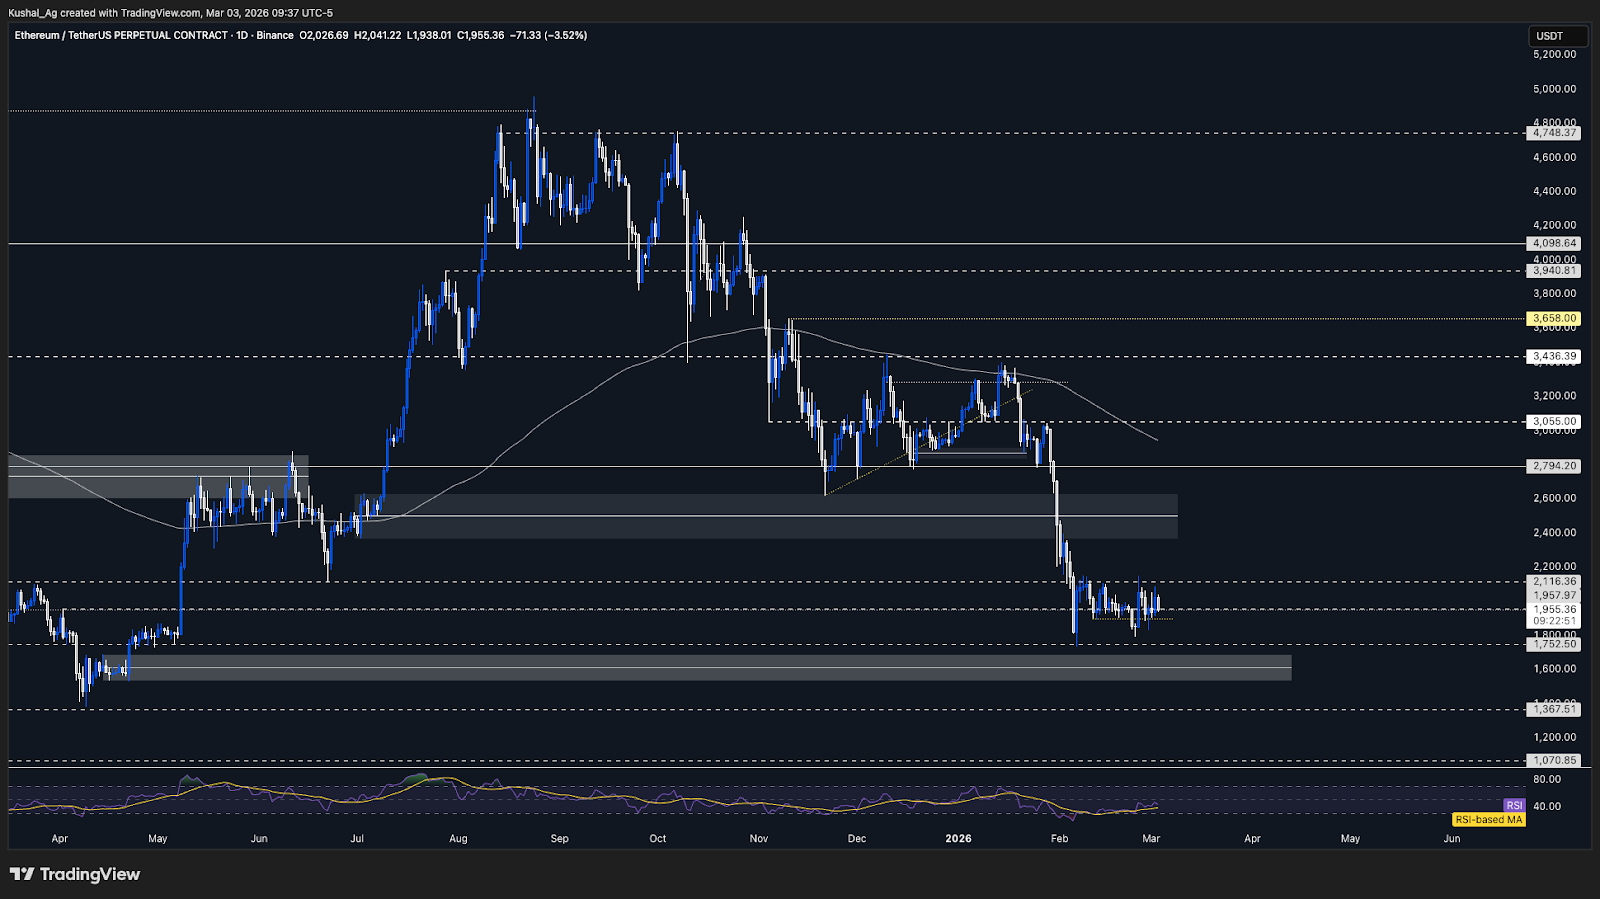
TA:Ethereum continues to trade around the $1,957 support zone, very similar to where it was trading when we previously analysed it. We saw a brief deviation below that level, but like Bitcoin, price quickly reclaimed it. That reclaim shifts the tone. Instead of treating $1,957 as firm support, we are now tightening the pivot slightly lower to the $1,900 region, which becomes the key level to monitor going forward.
$1,900 is now the structural support. As long as Ethereum holds above it on daily closes, we maintain a neutral stance and treat the recent downside as a small deviation. A daily close below $1,900 would expose $1,757 first, followed by $1,615 as the deeper downside objective.
On the upside, resistance remains at $2,116. If $1,900 continues to hold, Ethereum can continue ranging between $1,900 and $2,116, with $2,368 as the broader upside liquidity target if range expansion develops.
Relative strength, however, is softer than Bitcoin. The ETH/BTC pair has returned toward the 0.029 region after previously bouncing from it. The inability to build follow-through on that bounce suggests Ethereum is underperforming on a relative basis, which reinforces the need for caution.
Ethereum is also printing back to back potential bearish divergences on the daily timeframe. Price continues to print lower highs while RSI is higher highs. There is no confirmation yet, but a daily close below $1,900, and especially $1,800 would activate downside risk.
The 200 EMA continues to slope downward near $2,943, keeping higher-timeframe pressure intact. RSI has recovered to 44 with average at 37, showing stabilisation but not strong momentum. Structure remains neutral, but comparatively a bit weaker versus BTC.
Key Levels:
- Support: $1,900
- Resistance: $2,116
- Direction: Neutral
- Upside Target: $2,368
- Downside Target: $1,757-$1,615
Cryptonary’s Take:
Ethereum mirrors Bitcoin structurally but with slightly weaker relative strength. The reclaim of prior support shifts us from neutral-bearish to neutral, but sustained strength is still absent.$1,900 is the decisive level. Hold above it, and Ethereum continues to range. Lose it, and downside acceleration toward $1,757 becomes the base case.
SOL
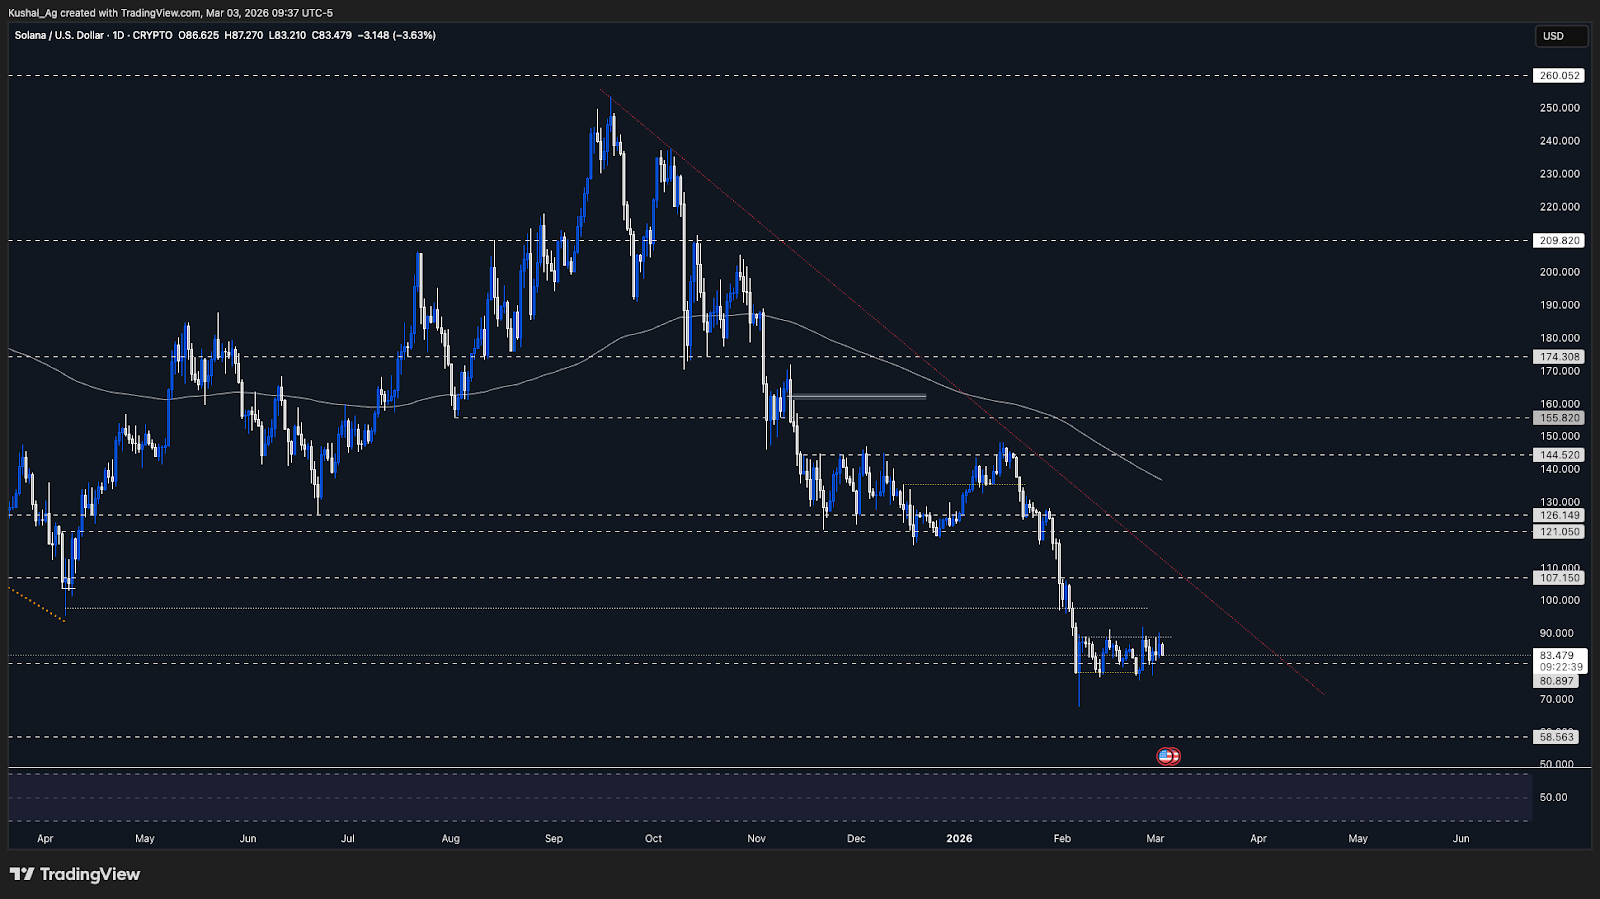
TA:We have maintained a neutral stance on Solana for the past few weeks, and price continues to respect the defined range between $78 support and $89 resistance. Neither side has been decisively broken, and the range-bound thesis remains intact.
Structurally, there have been no meaningful developments. Each move toward $89 has been capped, while dips toward $78 have been absorbed. Until we see a daily close or deviation outside this band, the market remains range bound.
A daily close below $78 would shift focus toward $67.7 first, while a clean close above $89 would open $97.7 on the upside. Those are the two triggers that would force a reassessment.
Solana is also forming potential bearish divergence conditions. Price remains capped with lower highs inside the $78-$89 range, while RSI is printing relatively higher highs. A confirmed daily close below $78 would validate the setup and expose $67.7 on the downside.
The 200 EMA continues to slope downward near $136.7, reflecting higher-timeframe pressure. RSI sits around 43 with average at 39, showing mild recovery but no expansion in momentum. Price remains compressed within range structure.
Key Levels:
- Support: $78
- Resistance: $89
- Direction: Neutral
- Upside Target: $97.7
- Downside Target: $67.7
Cryptonary’s Take:
Solana is the cleanest range structure among the majors. There is no reason to front-run direction here. The market has respected both extremes consistently.Until $78 or $89 breaks on a daily closing basis, our stance continues to remain neutral here. Range continuation is the base case.
Closing Thoughts
We have pivoted from a neutral-bearish stance to a neutral stance on Bitcoin and Ethereum. The anticipated continuation lower did not materialise, instead, both assets reclaimed and are holding key supports. For Bitcoin, $65,650 remains the decisive pivot. As long as that level holds on daily closes, short-term upside liquidity toward $70.5K-$73.8K remains viable before any broader downside attempt resumes. A sustained break below that level would shift structure back toward continuation risk.Solana remains range-bound between $78 and $89, and that neutrality continues to play out cleanly. Until we see a confirmed break on either side, there is no reason to front-run direction.
Overall, the majors are holding up relatively well despite geopolitical tensions and broader uncertainty. That strength suggests upside liquidity could be taken in the coming sessions before any deeper structural move develops.
For now, we remain reactive here, closely watching how Bitcoin behaves around the $65K-$62.8K region before committing to a stronger directional bias. If these pivots continue to hold, upside targets remain in play, if they fail, downside continuation quickly comes back into focus.
Recommended from Cryptonary