Save 23% ($351) & Get a Free 1-1 Call with our Team ⏰ : 0d 2h 59m 43s
BTC, ETH and More: Range-Bound Action Ahead
This week has been all about sharp reactions and fast pivots. Last week’s downside liquidity targets across BTC and ETH have now been tapped, and the market is back in range. In this update, we’ll map the key levels that matter next and what would actually shift bias.

Disclaimer: This is not financial or investment advice. You are responsible for any capital-related decisions you make, and only you are accountable for the results.
Quick bridge from last week…
Last Friday’s Market Direction had a neutral-bearish bias on Bitcoin and Ethereum, with a neutral stance on Solana and Hyperliquid. Since then, price action played out largely as expected. Bitcoin and Ethereum both moved into their downside liquidity zones, with BTC tagging $86,400 and ETH tapping $2,794, followed by clean bounces from those levels. Both assets are now back to ranging within the same broader zones discussed in the prior analysis.On Solana, we saw a break below $126 with a brief deviation under $121, but price reclaimed $121 quickly and is now ranging between $121 support and $126 resistance. There’s no confirmed structural breakdown yet, though Solana is a bit weaker than before and still sitting at a higher timeframe decision area.
Overall, the prior biases held up well, initial downside liquidity was respected across majors, and now the focus shifts to how price behaves within these ranges going forward.
TLDR
- Bitcoin: First downside liquidity at 86,400 is tapped. As long as price stays below 90,200, risk remains for a move toward 83,790. Bias stays neutral-bearish until reclaim.
- Ethereum: Initial downside targets (2,872 and 2,794) are done. Price is ranging below 3,055. Bias remains neutral-bearish unless structure is reclaimed, 2717 downside liquidity open.
- Solana: Holding and ranging around a major higher timeframe support zone (121-126). No breakdown yet. Bias remains neutral, waiting for direction.
Bitcoin
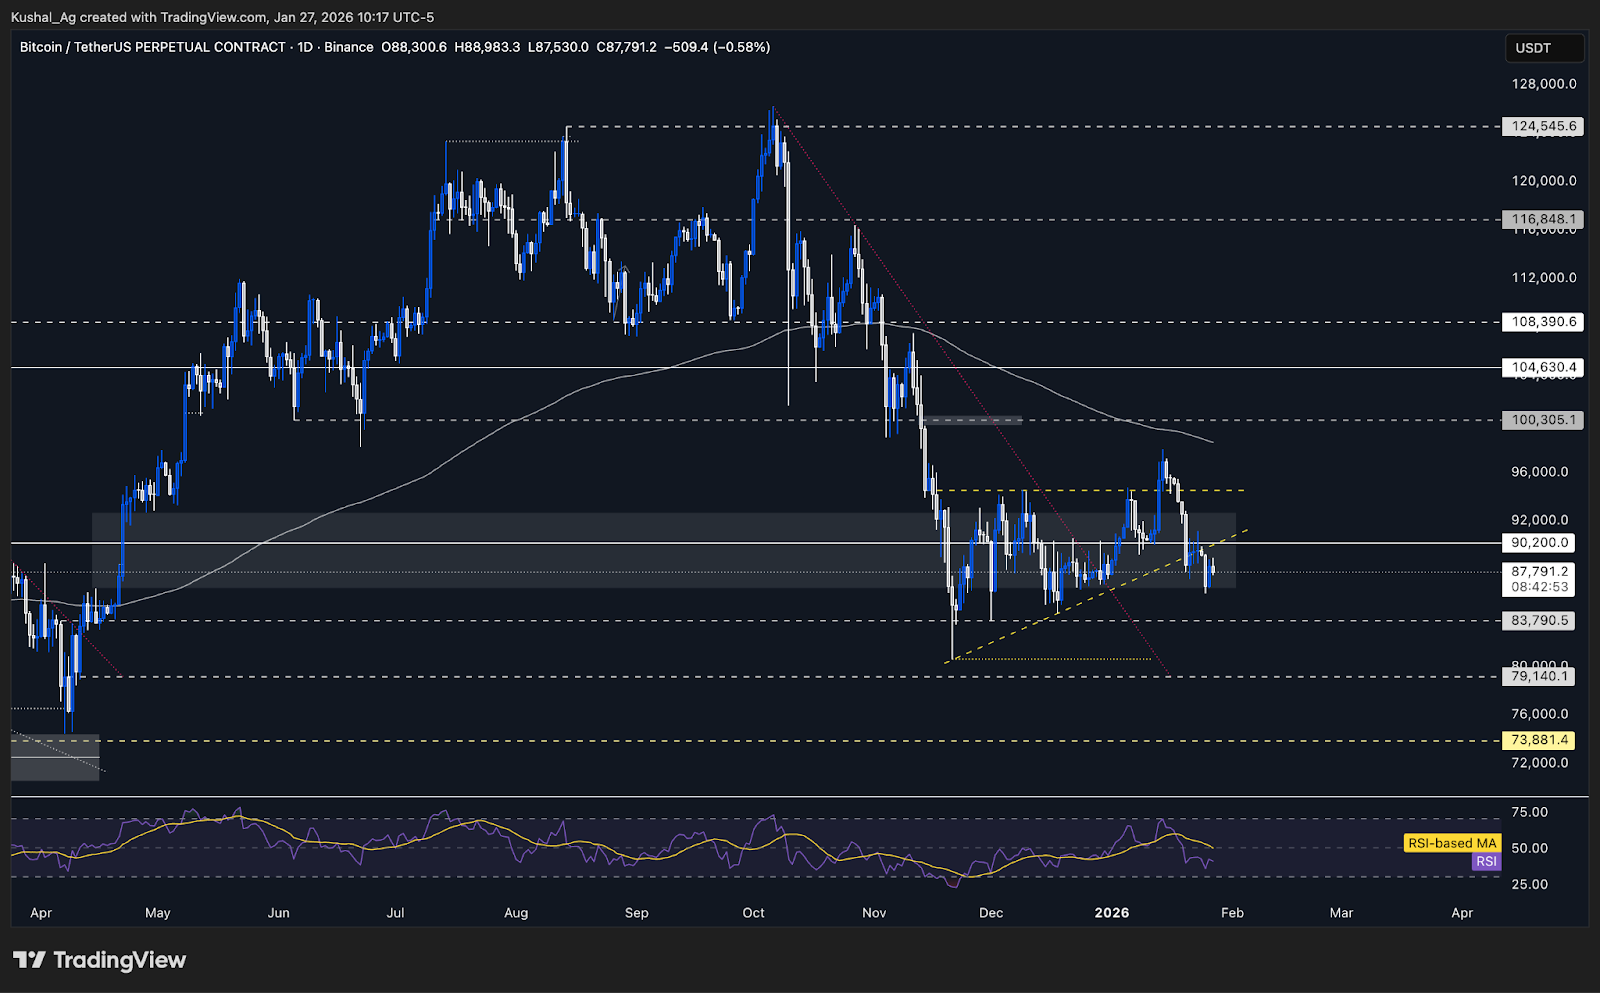
TAIn the last Market Direction, we saw Bitcoins price had deviated below the lower boundary of the ascendinging triangular structure and failed to reclaim it, confirming continued weakness below the trendline.
After that deviation, Bitcoin printed a small wick above $90,200, but selling pressure emerged immediately, and price was once again rejected from the former support zone. This rejection reinforced $90,200 as a firm overhead resistance and kept price capped beneath the broken structure.
Following that rejection, Bitcoin moved directly into the first downside liquidity pocket at $86,400, which was a level we had highlighted earlier. Price tagged this area cleanly, printed a local swing low near $86,000, and bounced a bit, confirming $86,400 as a short-term support level as well.
At present, Bitcoin is ranging between $86,400 and $90,200, consolidating after the first liquidity sweep. With structure still broken and price unable to reclaim $90,200, the next downside liquidity level at $83,790 remains open and active. As long as Bitcoin trades below $90,200, the probability favors another attempt toward that lower pocket.
The 200 EMA on the daily timeframe is sloping downside slightly near $98,500, acting as an important resistance area. RSI is hovering around 40, below its average near 49, showing that momentum has not yet reset into a neutral range. A shift in bias would require a daily reclaim of $90,200 followed by strength toward $94,500, which would invalidate the current downside liquidity thesis.
Key Levels
- Next Support: $86,400
- Next Resistance: $90,200
- Direction: Neutral-Bearish
- Upside Target: $94,500
- Downside Target: $83,790
Cryptonary’s Take
Bitcoin has now completed the first leg of downside liquidity cleanup with the $86,400 tag, but structure remains broken below $90,200. As long as price fails to reclaim that level decisively, the market should be treated as corrective.The key focus remains reaction quality near $83,790 if price moves lower. That zone is where we would expect stronger responses and potential base-building behavior. Until Bitcoin can reclaim $90,200 and eventually accept above $94,500, rallies should be viewed as internal bounces within a broader consolidation unless we see clear bottoming out signs in the market.
Ethereum
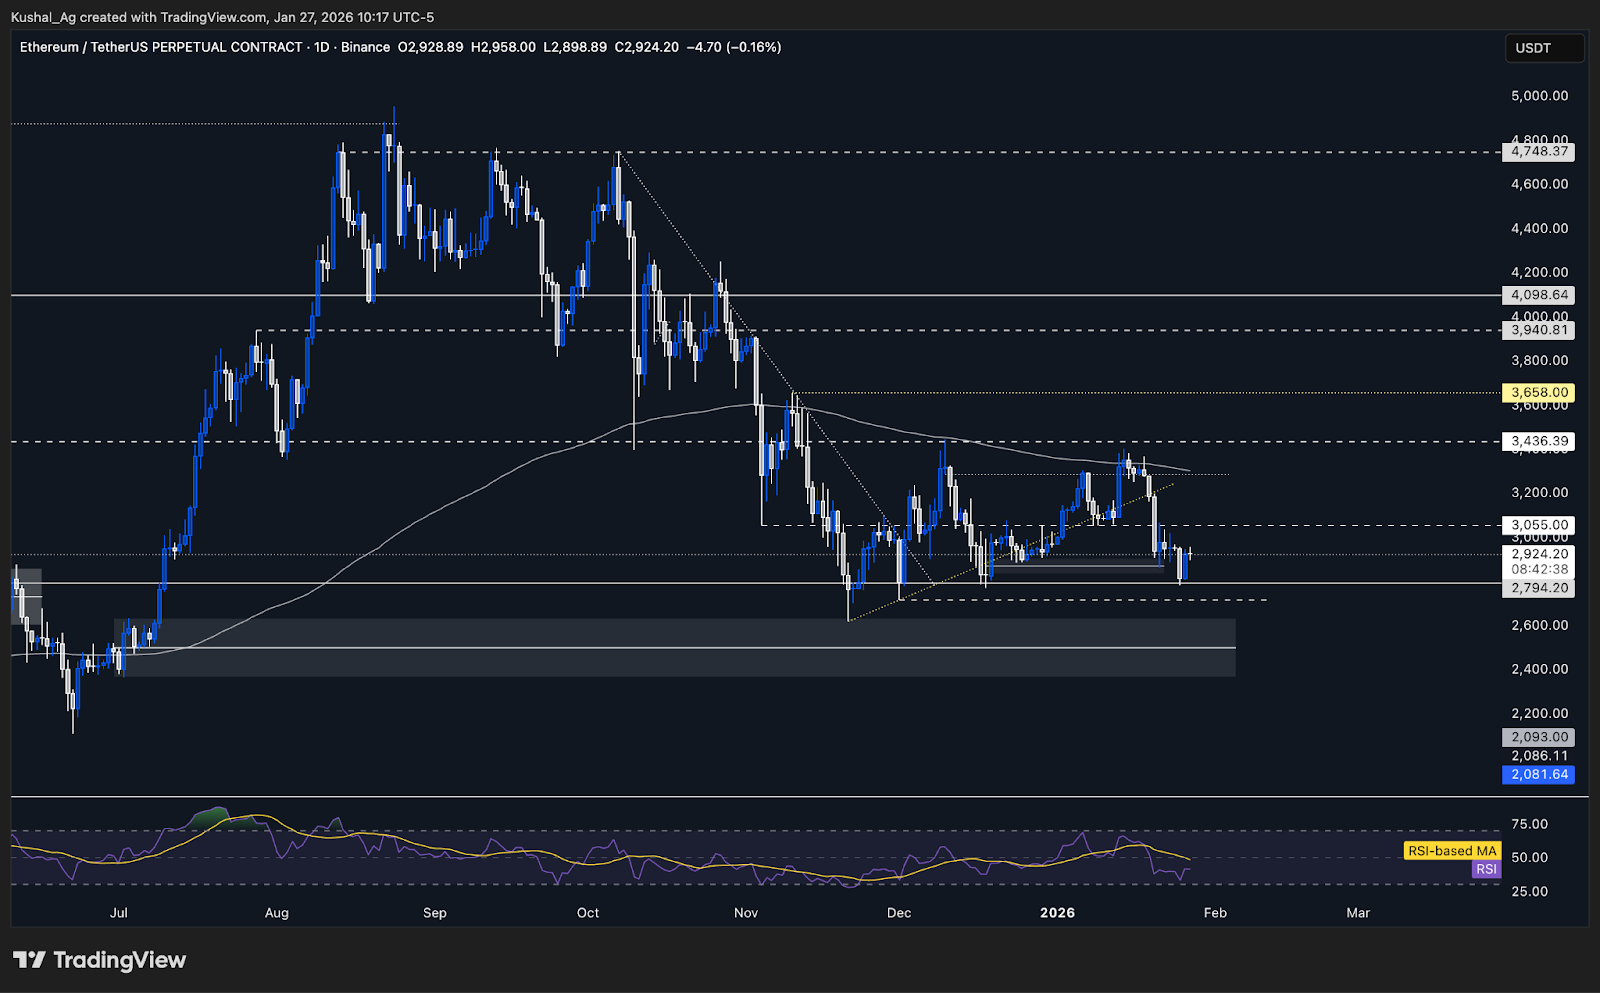
TAEthereum has remained highly volatile since the last update, ranging between $2,794 and $3,055, and price action has largely respected the roadmap laid out in the previous MDs. After losing the $3,055 structure, Ethereum continued lower and tapped both the initial downside liquidity levels we had highlighted, first $2,872, followed by $2,794, almost to the exact level.
Following the $2,794 tag, Ethereum managed a short term bounce and reclaimed $2,872, pushing price back into the prior range. However, this reclaim has not yet translated into structural strength, price continues to stall beneath $3,055, which remains the key overhead resistance and former breakdown level.
With both initial downside targets now cleared, the market has shifted into a range-bound corrective phase. Ethereum is currently compressing between $2,794 as support and $3,055 as resistance, and until one of these levels decisively breaks, price is likely to remain choppy and reactive.
Also, as long as Ethereum holds below $3,055, the broader structure remains weak, and the next downside liquidity pocket at $2,717 stays open. A clean break below $2,794 would expose that level relatively quickly.
The 200 EMA on the daily timeframe is hovering near $3,300 and continues to slope downward, reinforcing the overhead supply zone. RSI is holding around 40, below its average near 47, indicating that momentum is still in the weaker sides.
Key Levels
- Next Support: $2,794
- Next Resistance: $3,055
- Direction: Neutral-Bearish
- Upside Target: $3,286
- Downside Target: $2,717
Cryptonary’s Take
Ethereum has done what was expected after losing $3,055, it swept downside liquidity and is now stabilizing within a corrective range. However, stabilization does not equal strength. Until Ethereum can reclaim $3,055 and show acceptance above it, the broader structure remains fragile.The focus now shifts to reaction quality around $2,794. Holding this level keeps Ethereum range-bound, while a breakdown would likely invite a move toward $2,717. A genuine shift in bias will only come with a structural reclaim on the daily timeframe, until then, rallies should be treated cautiously and within a neutral-bearish framework.
Solana
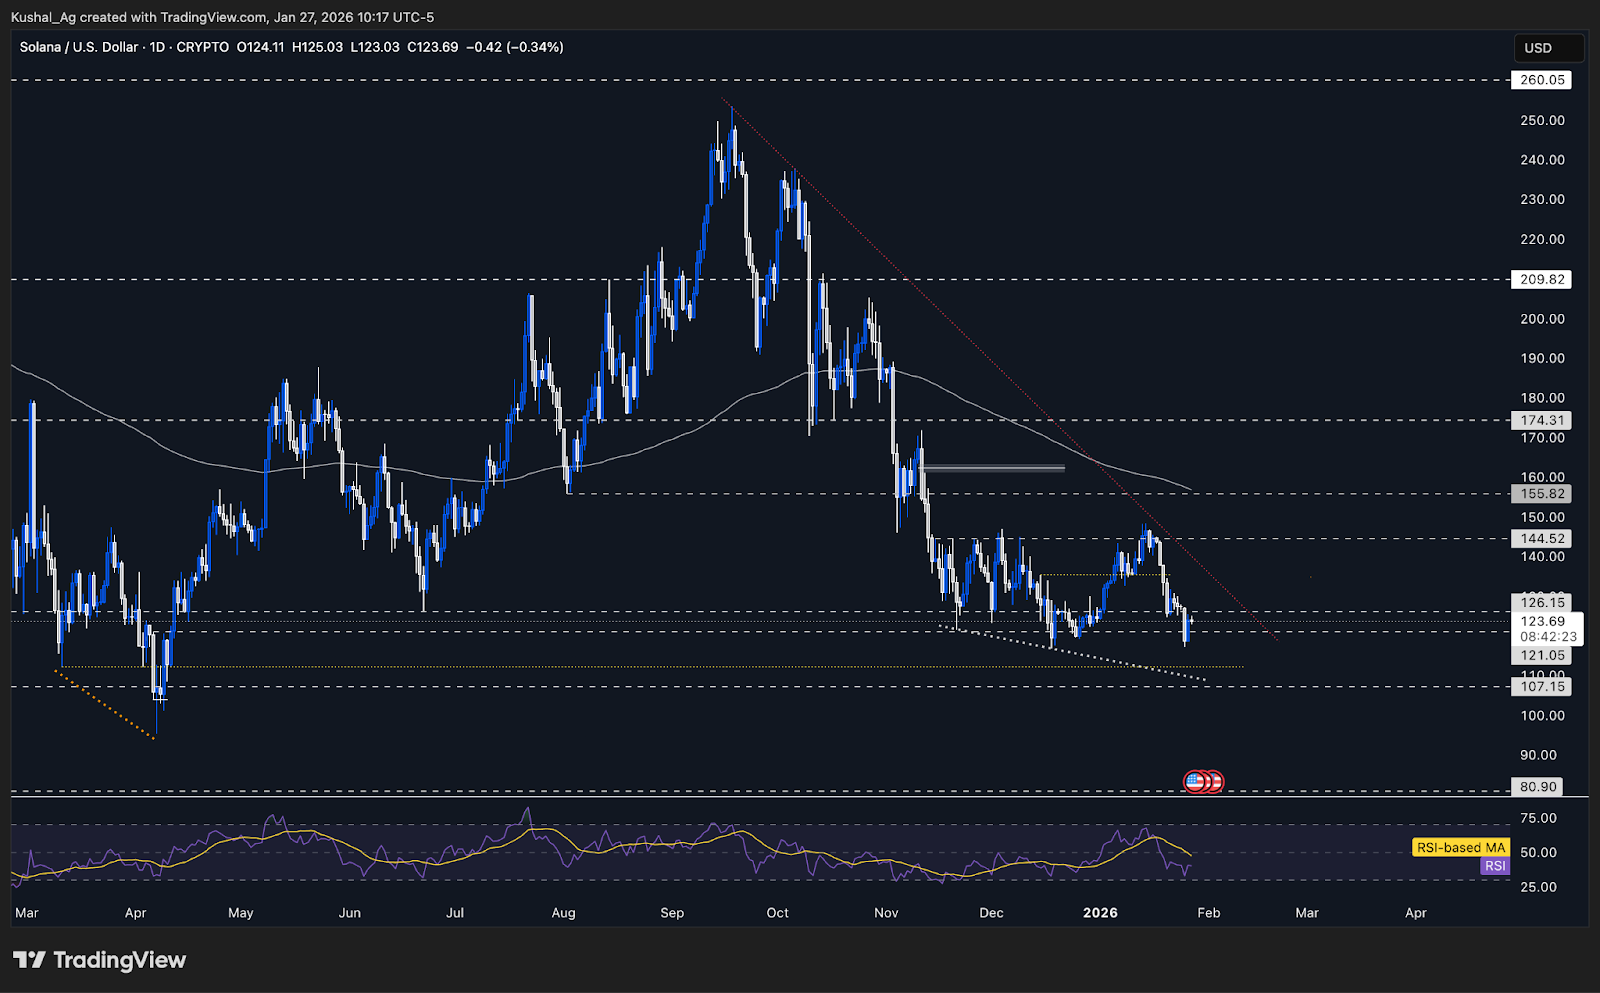
TASolana recently failed to hold the $126.15 support. Although breakdown below was not long lived, price found strong demand near $117, which is the same region where Solana printed a local bottom around 18th December 2025 before rallying sharply toward the $150 region into mid-January 2026.
The reaction from $117 was swift, indicating responsive buyers at this level. Since that bounce, Solana has reclaimed $121 and is currently consolidating above it. Crucially, we have not seen a daily or weekly close and continuation below $121, which was the condition required for us to pivot into a neutral bearish stance. That condition has not been met.
This area also aligns closely with the weekly 200 EMA around $123, reinforcing the idea that Solana is still trading at a meaningful higher timeframe support cluster. Being outright bearish while price is holding above such a level is not an optimal risk reward decision, especially given the repeated historical reactions from this zone.
As a result, Solana is best viewed as range bound for now, compressing between $121 support and $126 resistance. Acceptance below $121 would shift the structure lower and open the door toward $112.
The daily 200 EMA remains well above price around$156 and continues to slope downward, showing broader trend weakness, RSI has stabilized near 39-40 and average hovers around 47, telling us that there is a bit of weakness in overall price action.
Key Levels
- Next Support: $121
- Next Resistance: $126
- Direction: Neutral
- Upside Target: $135.5
- Downside Target: $112.2
Cryptonary’s Take
Solana is holding a high timeframe support zone that has produced strong reactions in the past. The bounce from $117 and the absence of a confirmed close below $121 justify maintaining a neutral stance and not leaning bearish outright.Until Solana either accepts below $121 or reclaims $126 with follow through, we will stay neutral waiting for price action to develop more here and give us the signs we need.
Hyperliquid
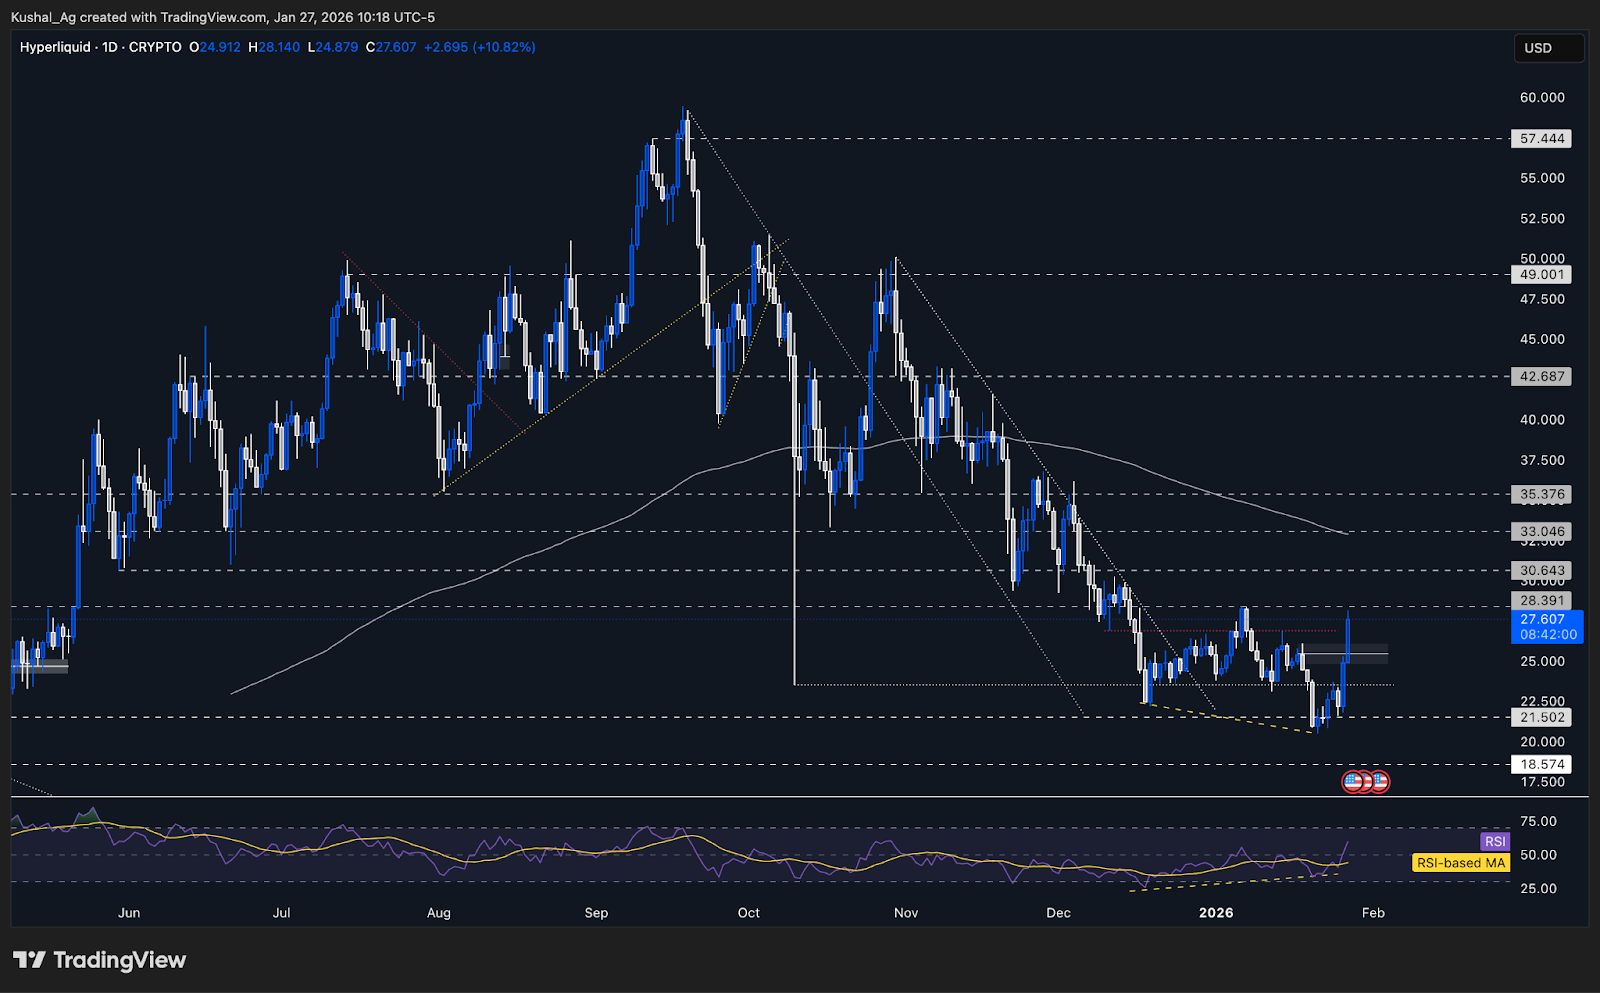
TAHyperliquid delivered a strong upside move after confirming the bullish divergence setup that we had been tracking well before the structure even formed. When HYPE was trading above $23.5, we highlighted the potential for a bullish divergence, and in the last Market Direction, as price was holding around $21.5, the setup was clearly in its formation phase.
That confirmation came as expected once HYPE reclaimed $23.5, followed by a clean break above $26.9. From there, price expanded aggressively into the next resistance zone, $28.3 and printed a local high around $28.15. This move fully confirms the bullish divergence setup and validates the upside continuation thesis.
Given the broader context, with Bitcoin and Ethereum still having downside liquidity risks, we are not shifting into a full bullish stance yet. However, structure and momentum in HYPE are now clearly constructive, and the bias pivots to neutral-bullish. Any pullbacks from here are now viewed as retracements.
Structurally, the key support zone has shifted higher. The former supply area between $24.7-$26.1, which HYPE broke through during the impulse move, now acts as a breaker block. The midpoint of this zone around $25.4 is the primary support to watch on any retracement. Holding this region keeps the bullish structure intact.
The daily 200 EMA is beginning to flatten around $32.9, and RSI has expanded sharply, now hovering near 60, well above its average around 44. While short-term conditions are slightly stretched, this is consistent with a post breakout phase and not exhaustion just yet.
Key Levels
- Next Support: $25.4
- Next Resistance: $28.3
- Direction: Neutral Bullish
- Upside Target: $30.6
- Downside Target: $23.5
Cryptonary’s Take
The bullish divergence in Hyperliquid has played out cleanly and decisively, with price reclaiming key levels and expanding into higher resistance as anticipated. This confirms the quality of the setup and shifts the structure firmly into a neutral-bullish regime.From here, the focus is on how price behaves on retracements. As long as HYPE continues to hold the $24.7-$26.1 breaker zone, the path of least resistance remains higher. Failure to hold this area would bring $23.5 back into play, but unless that happens, pullbacks are considered healthy and constructive within a developing uptrend.
Aura
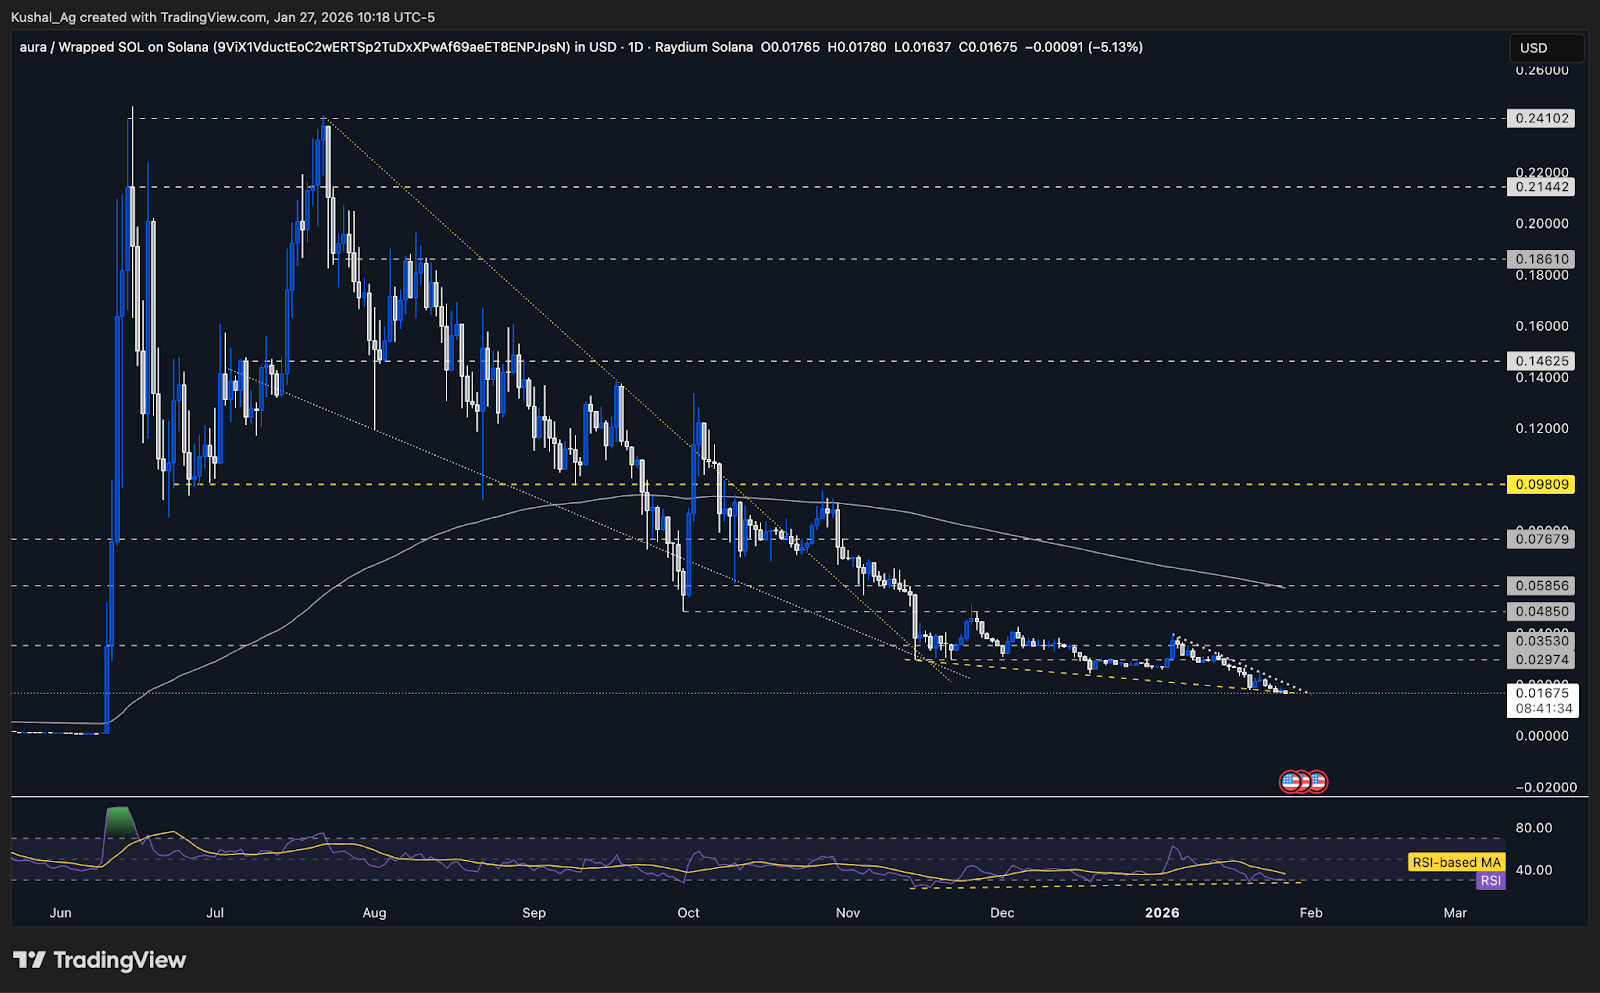
Aura continues to trade without any major structural developments, price is still under mild selling pressure. From a structure perspective, Aura remains within the same wider consolidation but price action also lacks momentum to reclaim higher levels.This weakness is largely a reflection of broader Solana side pressure, as Solana has pulled back toward the $126 support region and briefly dipped below it. Until Solana shows clearer strength, Aura is unlikely to see meaningful upside follow through.
On momentum, the 200 EMA on the daily timeframe is hovering around 0.057, still well above current price, reinforcing that Aura remains structurally weak on higher timeframes. This level will remain a key medium term hurdle if price attempts any sustained recovery.
RSI continues to reflect exhaustion, currently hovering around 29, with the average near 35. While momentum is clearly weak, this also aligns with the potential bullish divergence setup we highlighted in the previous market direction. That setup is still in its formation phase and has not yet received confirmation.
- Direction: Bullish
- Action Plan: DCA and Raid
Cryptonary’s Take
Aura remains a patience trade. While price action is soft and momentum is weak, the developing bullish divergence keeps this asset on watch. A confirmed shift would require stabilization followed by strength, ideally alongside Solana reclaiming key levels. Until then, Aura remains in a waiting phase, with focus on whether this divergence matures into a valid reversal setup.Closing Thoughts
Overall, downside liquidity for Bitcoin remains open at $83,790, and as long as that level is untapped, downside risk stays on the table for the broader market. This is why Ethereum still has $2,717 as the next downside liquidity level in play, despite having already tapped its initial targets. Until Bitcoin resolves its downside, pressure across majors can persist.For Solana, the situation is different. We are not actively tracking downside liquidity here yet, as price continues to hover around a high timeframe support cluster near $121-$126, where the weekly 200 EMA at $123 sits. Because of this, we remain cautious about adopting any bearish bias on Solana unless we see a clear breakdown and acceptance below $121.
Hyperliquid stands out after confirming its bullish divergence setup and showing clear relative strength. Pullbacks from here are now best treated as retracements, and the focus shifts to how well HYPE can hold structure during these pullbacks and maintain strength relative to the rest of the market.
For Bitcoin, downside risk only meaningfully reduces if price reclaims $90,200 with follow through, while a clean break above $94,000 would fully invalidate the downside liquidity thesis. Until then, open liquidity below continues to act as a headwind for the broader market.
Cryptonary Out!
Continue reading by joining Cryptonary Pro
$1,548 $1,197/year
Get everything you need to actively manage your portfolio and stay ahead. Ideal for investors seeking regular guidance and access to tools that help make informed decisions.
For your security, all orders are processed on a secured server.
As a Cryptonary Pro subscriber, you also get:
3X Value Guarantee - If cumulative documented upside does not reach 300% during your 12-month membership, you can request a full refund. Terms
24/7 access to experts with 50+ years’ experience
All of our top token picks for 2025
On hand technical analysis on any token of your choice
Weekly livestreams & ask us anything with the team
Daily insights on Macro, Mechanics, and On-chain
Curated list of top upcoming airdrops (free money)
3X Value Guarantee
If cumulative documented upside does not reach 300% during your 12-month membership, you can request a full refund.
Our track record speaks for itself
With over 2.4M tokens and widespread misinformation in crypto, we cut through the noise and consistently find winning assets.
Our track record speaks for itself
With over 2.4M tokens and widespread misinformation in crypto, we cut
through the noise and consistently find winning assets.


Frequently Asked Questions
Can I trust Cryptonary's calls?
Yes. We've consistently identified winners across multiple cycles. Bitcoin under $1,000, Ethereum under $70, Solana under $10, WIF from $0.003 to $5, PopCat from $0.004 to $2, SPX blasting past $1.70, and our latest pick has already 200X'd since June 2025. Everything is timestamped and public record.
Do I need to be an experienced trader or investor to benefit?
No. When we founded Cryptonary in 2017 the market was new to everyone. We intentionally created content that was easy to understand and actionable. That foundational principle is the crux of Cryptonary. Taking complex ideas and opportunities and presenting them in a way a 10 year old could understand.
What makes Cryptonary different from free crypto content on YouTube or Twitter?
Signal vs noise. We filter out 99.9% of garbage projects, provide data backed analysis, and have a proven track record of finding winners. Not to mention since Cryptonary's inception in 2017 we have never taken investment, sponsorship or partnership. Compare this to pretty much everyone else, no track record, and a long list of partnerships that cloud judgements.
Why is there no trial or refund policy?
We share highly sensitive, time-critical research. Once it's out, it can't be "returned." That's why membership is annual only. Crypto success takes time and commitment. If someone is not willing to invest 12 months into their future, there is no place for them at Cryptonary.
Do I get direct access to the Cryptonary team?
Yes. You will have 24/7 to the team that bought you BTC at $1,000, ETH at $70, and SOL at $10. Through our community chats, live Q&As, and member only channels, you can ask questions and interact directly with the team. Our team has over 50 years of combined experience which you can tap into every single day.
How often is content updated?
Daily. We provide real-time updates, weekly reports, emergency alerts, and live Q&As when the markets move fast. In crypto, the market moves fast, in Cryptonary, we move faster.
How does the 3X Value Guarantee work?
We stand behind the value of our research. If the documented upside from our published research during your 12-month membership does not exceed three times (3X) the annual subscription cost, you can request a full refund. Historical context: In every completed market cycle since 2017, cumulative documented upside has exceeded 10X this threshold.
TermsRecommended from Cryptonary


