Save 23% ($351) & Get a Free 1-1 Call with our Team ⏰ : 0d 2h 59m 43s

Disclaimer: This analysis is for informational purposes only and not financial advice.
TLDR:
- BTC: Neutral bias. Corrections continue. Watch $108k-$110k support and resistance at $114k-$116k. Major long if $100k-$102k tested.
- ETH: Neutral. Ranging $3,750-$4,250. Major buy on dip to $3,400-$3,500 or break above $4,250.
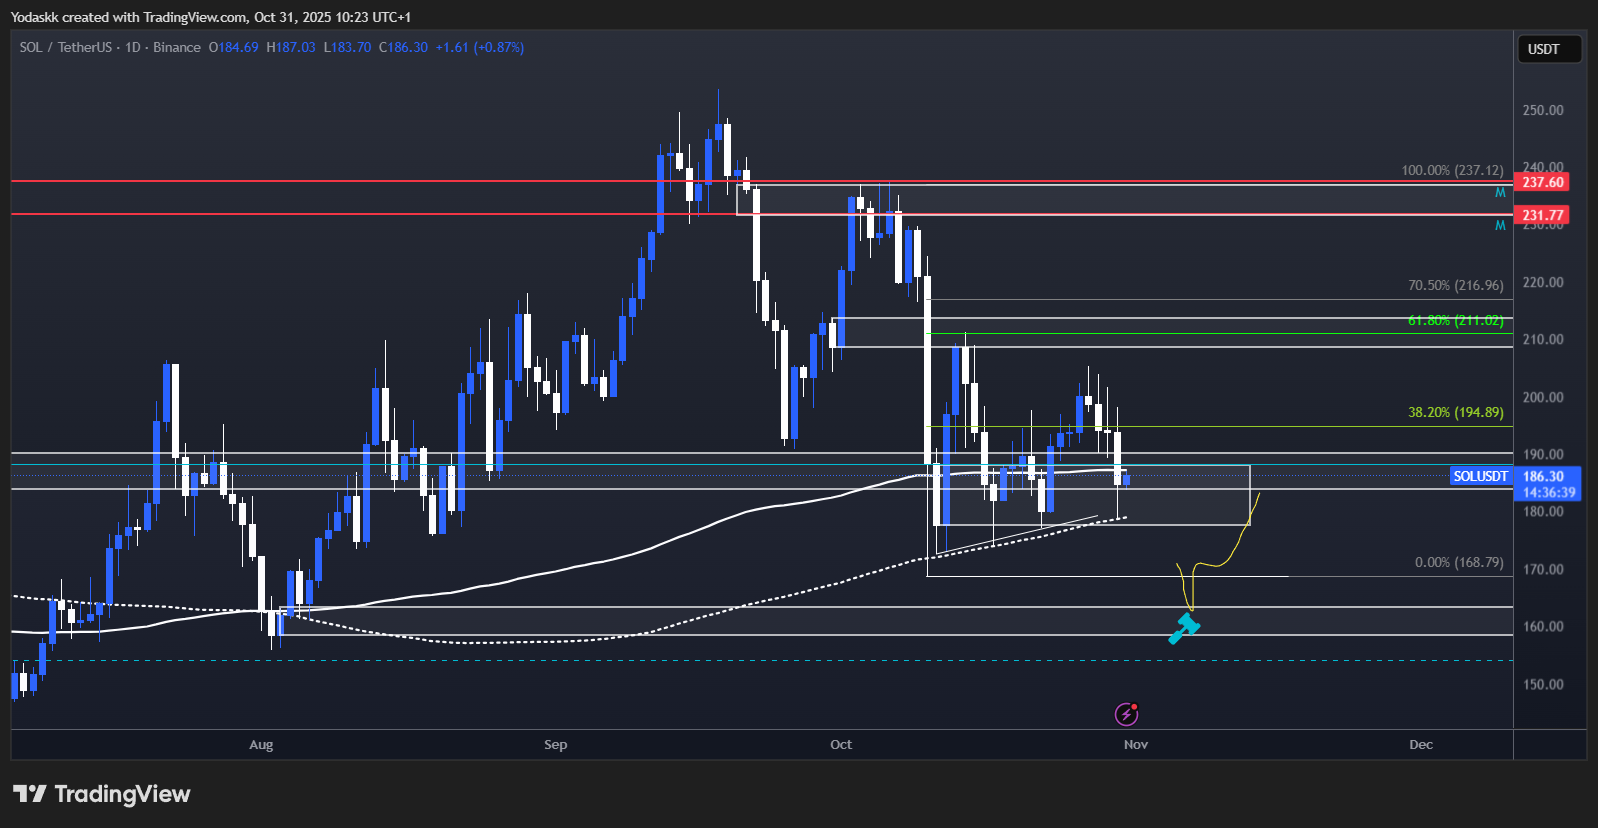
- SOL: Neutral. Rangebound $178-$210. Bullish on break above $213 or dip to $160-$169. Danger if breaks below $175.
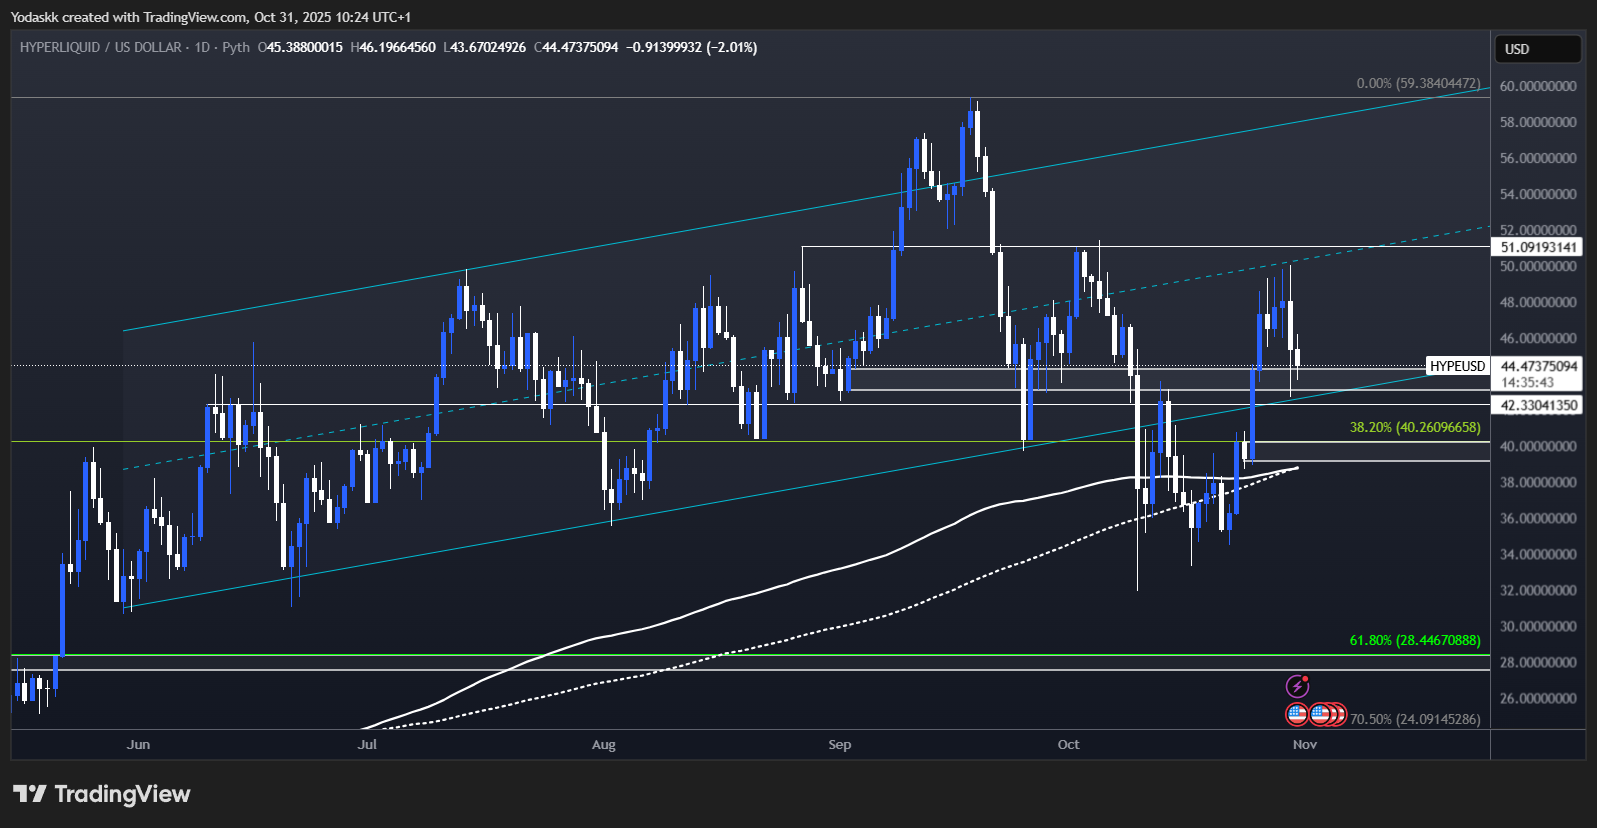
- HYPE: Neutral to bullish. Outperforms, testing $43-$44 support, $51 resistance. Strong buy if dips to $39-$40.
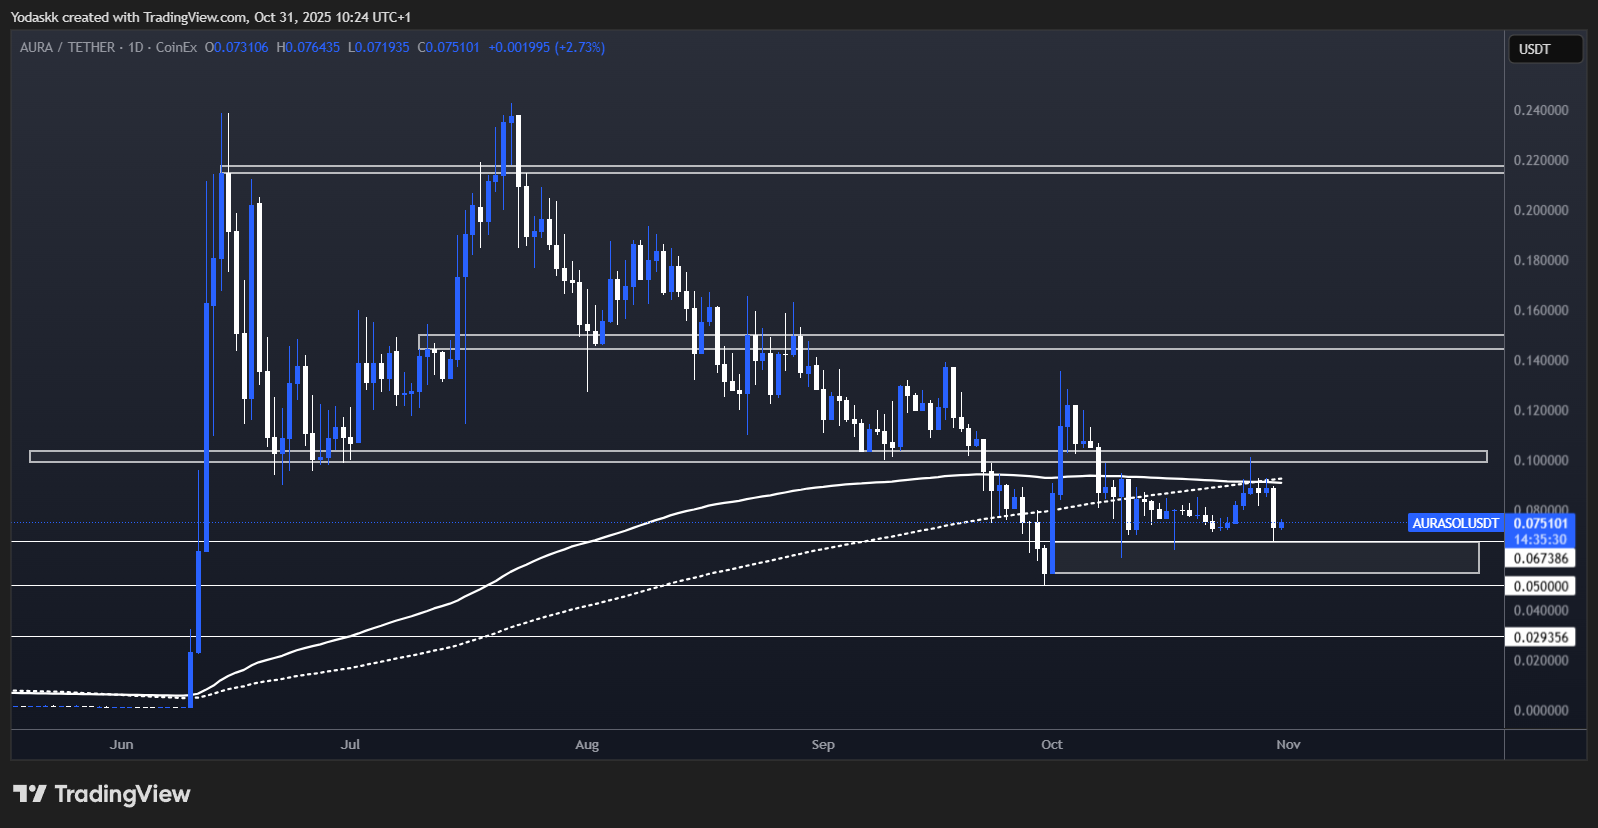
- AURA: Neutral to bullish. Consolidates $0.065-$0.10. Wait for $0.10 breakout or buy $0.065 support.
BTC:
Technical analysis
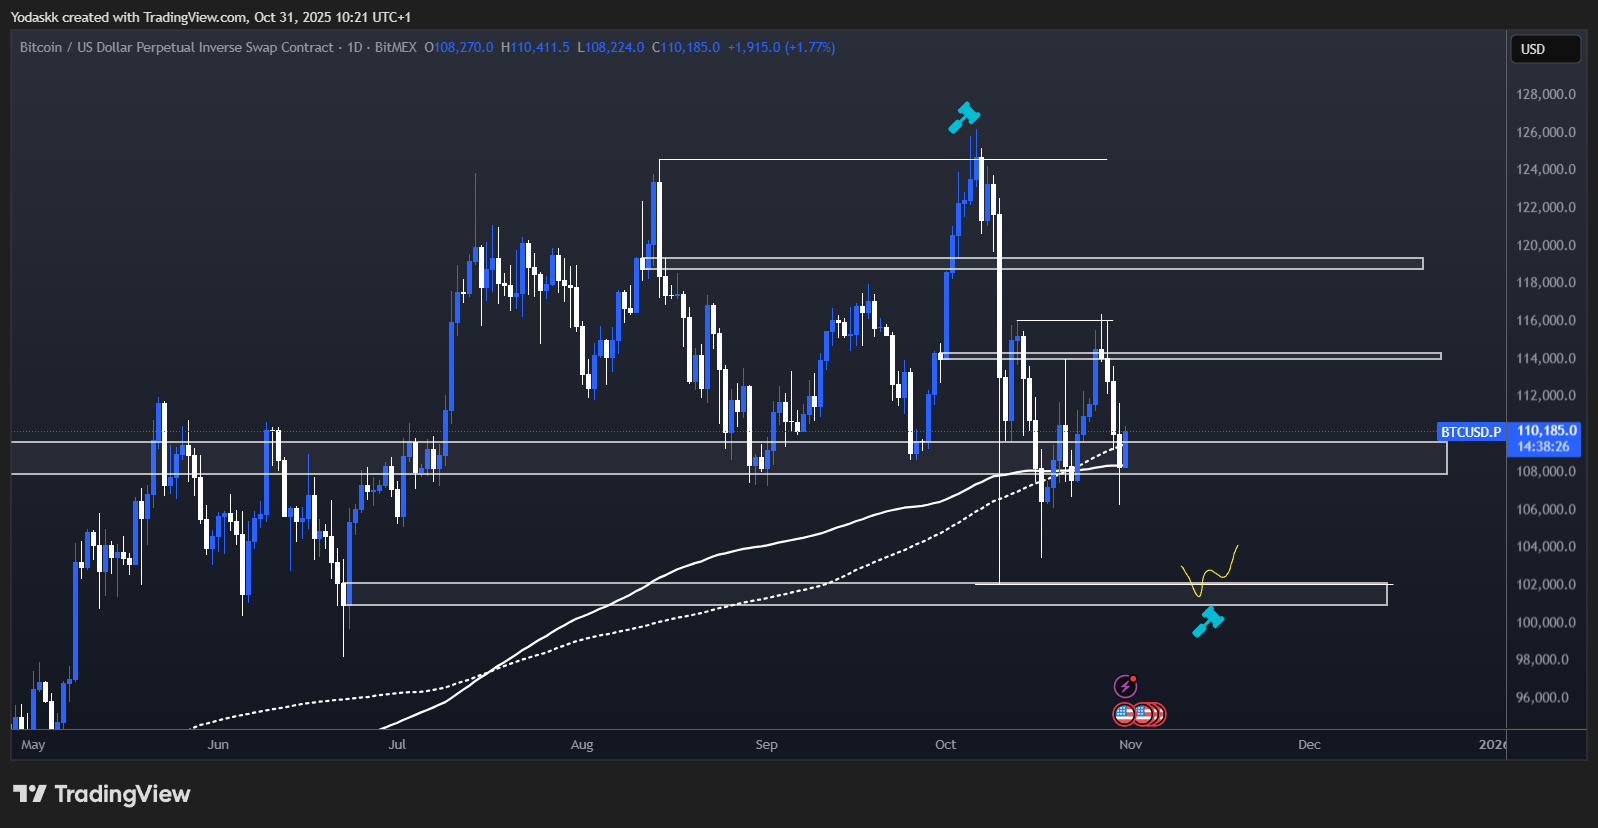
- Range: $102,000 – $116,000, bias neutral.
- Resistance $114,000 – $116,000, key support $108,000 – $110,000, breakdown trigger $106,000-$107,000.
- Bullish if $114k-$116k breaks; bearish if $107k fails. Major bids layered $100k-$106k.
- Market structure at risk with closes below $98k-$100k.
- Profit opportunities align with previous swing failure pattern setups and strong liquidity walls at the lows.
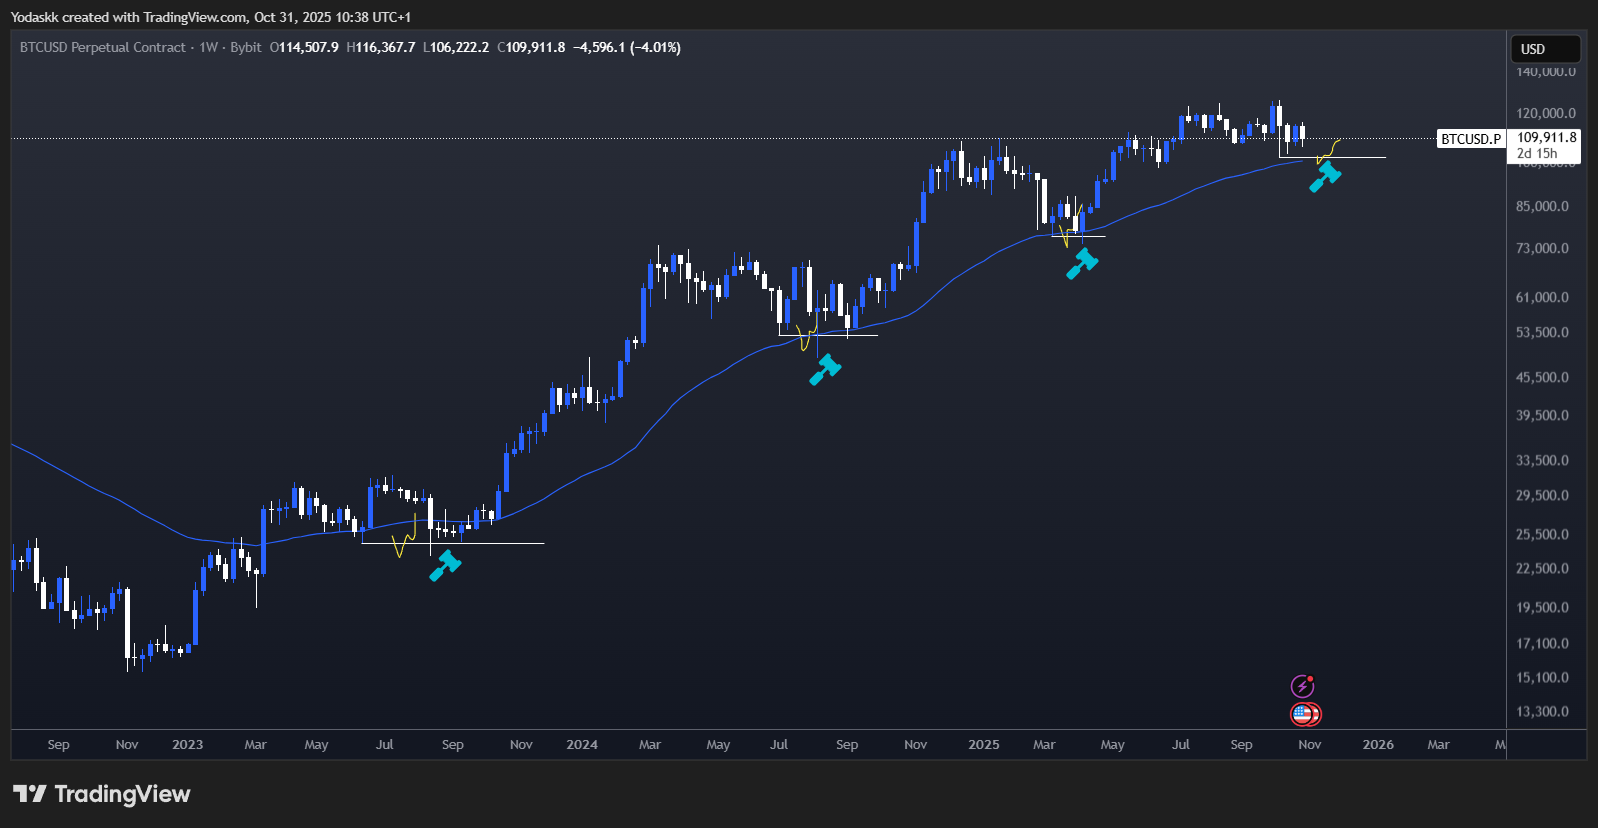
1- Form a low
2- SFP (Swing Failure Pattern) of the previous low while retest the Weekly 50 EMA
3- Continuation of the uptrend
This is why a retest of the $100k- $102k area, if we get it, should be an awesome opportunity.
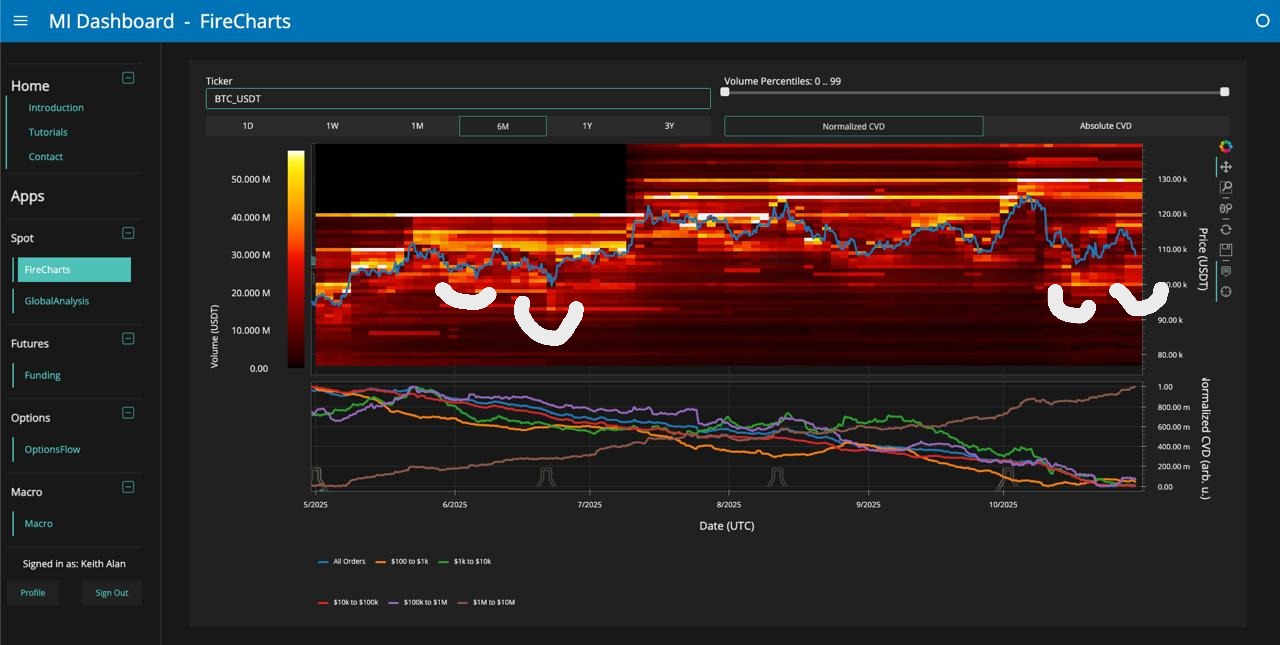
If we look at this BTC heatmap, we can see that there is a wall of bids layered from $100k to $106k. This signature is very similar to previous lows. This is another confirmation that a move into low $100ks would be an incredible opportunity.
What is a BTC heatmap? It shows where large buy and sell orders (liquidity walls) sit across price levels. Bright colors (like red, yellow, orange) represent high concentrations of limit orders, meaning areas where many traders are looking to buy or sell. These zones often act as support (buy walls) or resistance (sell walls) and can influence short-term price action.
Cryptonary's take
BTC's correction aligns with Fed and macro headlines. $114k is critical resistance, with a move down to $100k-$102k presenting a strong long opportunity. Structure remains bullish unless $98k-$100k breaks.- Next Support: $108,000
- Next Resistance: $114,000
- Direction: Neutral
- Upside Target: $116,000
- Downside Target: $100,000
ETH:
Technical analysis
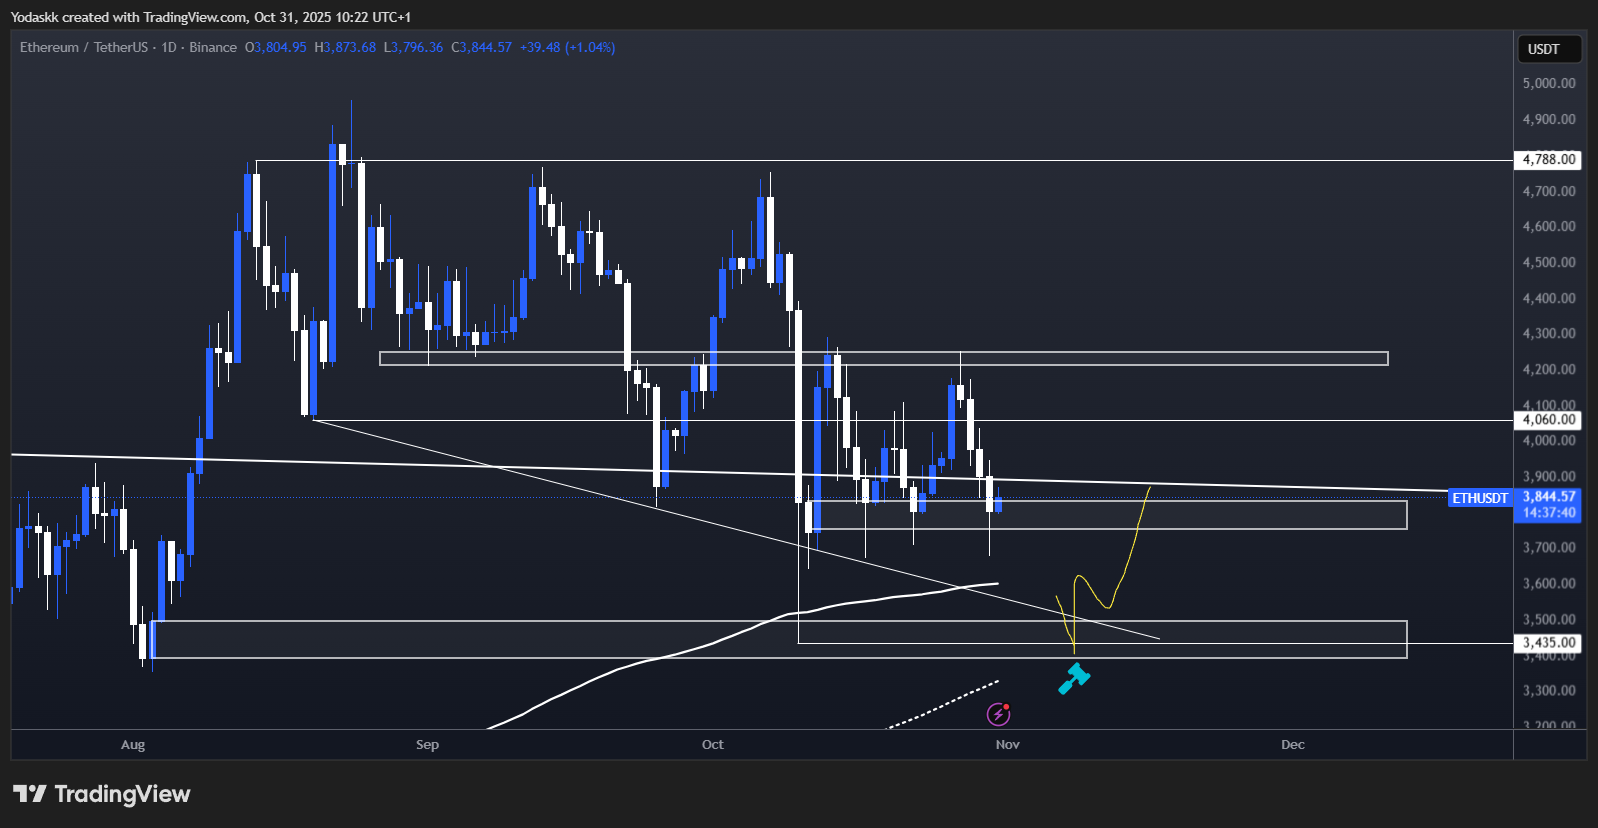
- Local price range $3,750–$4,250, neutral bias with strong resistance at $4,250.
- Supports at $3,750-$3,800, breakdown trigger $3,700 targeting $3,400-$3,500 zone (daily order block, 200D SMA).
- Bullish confirmation requires reclaim of $4,250; below $3,700 targets major buy zone.
- Long opportunity exists on dip to daily order block.
Cryptonary's take
ETH remains in a holding pattern. Awaiting either a breakout above $4,250 for bullish momentum, or a buy-the-dip move if price tests $3,400-$3,500.- Next Support: $3,750
- Next Resistance: $4,250
- Direction: Neutral
- Upside Target: $4,800
- Downside Target: $3,400
SOL:
Technical analysis
- Price range $178–$210, neutral bias; resistance and key reclaim level $213.
- Support zone $178–$190, breakdown below $175 targets $160 orderblock and potential SFP at $169.
- If $213 breaks, target $237+; if $175 fails, further weakness expected.
- Long setups on deep supports.
Cryptonary's take
SOL shows weakness relative to ETH. Awaiting a reclaim of $213 for bullish scenario, or a deep pullback to $160-169 for a buying opportunity.- Next Support: $178
- Next Resistance: $213
- Direction: Neutral
- Upside Target: $237
- Downside Target: $160
HYPE:
Technical analysis
- Price range $39–$51, neutral to bullish bias. Strongest major after Robinhood listing.
- Recently retested channel support $43-$44 after breaking resistance. Currently trading in range.
- Breakout above $51 targets $59 ATH. Breakdown below $42.5 targets $39-$40, then $28 major support.
- Fibonacci retracement aligns with $28 as strong reversal potential.
Cryptonary's take
HYPE continues to outperform majors. Consolidation above $43-44 is bullish. Break of $51 would target new highs; multi-level buy opportunities lower if sharp correction.- Next Support: $43
- Next Resistance: $51
- Direction: Neutral to Bullish
- Upside Target: $59
- Downside Target: $39
AURA:
Technical analysis
- Price range $0.065–$0.10, neutral to bullish. Resistance at $0.10, support at $0.065, breakdown trigger below $0.05.
- Adam and Eve bottom pattern develops; breakout above $0.10 targets $0.15+, confirmation at $0.12.
- Temporary dips under $0.05 present strong long-term opportunities but unlikely in current scenario.
Cryptonary's take
AURA's healthy consolidation points to accumulation. Await breakout above $0.10 for bullish surge, or buy deep at $0.065 support.- Next Support: $0.065
- Next Resistance: $0.10
- Direction: Neutral to Bullish
- Upside Target: $0.15
- Downside Target: $0.05
Recommended from Cryptonary


