Save 35% ($551) & Get a Free 1-1 Call with our Team ⏰ : 0d 2h 59m 44s
BTC, ETH and More: Relief Rally Fizzles, Downside Bias Persists
Relief rallies often feel convincing in the moment, but structure determines direction. Despite strong upside reactions earlier this week, majors failed to secure acceptance above resistance, keeping the broader corrective phase intact. The focus now shifts back to key support reactions. Here's what you need to know...

Disclaimer: This is not financial or investment advice. You are responsible for any capital-related decisions you make, and only you are accountable for the results.
Quick bridge from earlier this week…
Earlier this week, our base case remained tilted toward downside continuation. Instead, the market delivered an aggressive short-term relief rally across majors. Bitcoin and Ethereum reclaimed immediate resistance levels, Solana pushed into the $89 region, and Hyperliquid bounced from support toward $28.39. However, follow-through above resistance was limited, and we are now seeing price stall and rotate lower from those exact levels.While the bounce (short term) was strong, it lacked structural confirmation. Supports are now back under pressure, and resistance continues to cap upside momentum. The broader backdrop still leans cautious, equity weakness and geopolitical uncertainty remain in focus. For a deeper breakdown of that context, refer to today’s Market Update.
Disclaimer: This content is for informational and educational purposes only. It does not constitute financial advice, and should not be relied upon as a basis for making investment decisions. Virtual assets are volatile and may lose their value in full. Past performance does not indicate future results. Always do your own research.
TLDR
- Risk Posture: Defensive
- Bitcoin (BTC): Retesting $65,650 after relief bounce to $70K, base case remains breakdown toward $59.8K and $57.3K.
- Ethereum (ETH): Rejected at $2,116 after clearing prior week high, holding $1,957 for now, but break opens $1,752 and potentially $1,615.
- Solana (SOL): Divergence bounce played out to $92, but capped at range highs at $89. Range intact still, bias remains neutral. Below $78 opens $67.6.
- Hyperliquid (HYPE): Bounce from $25.4 stalled at $28.39 with repeated rejections, structure remains bearish toward $23.5, invalidation remains $30.64 reclaim.
- BTC.D: Rejected from 59.9% and breaking the Feb 2024 uptrend. Now moving toward 57.2% support. Falling dominance with weak BTC is not bullish for alts yet, constructive rotation needs BTC stability first.
Bitcoin (BTC)
TA:In the previous analysis, Bitcoin had broken below the $65,650 support and rotated toward the $62K region, where it printed a swing low around $62,400. From there, price delivered an aggressive relief bounce, reclaiming $65,650 and extending toward the next resistance band, topping out near $70,000, just below the $70,500 resistance.
Since that rejection, Bitcoin has been retracing back toward the $65,650 level once again. While the bounce was strong, the structure remains corrective. The reclaim did not transition into sustained continuation, and price is now testing the same pivot zone.
We do not expect $65,650 to hold on a sustained basis. The base case remains a breakdown from this region, which would open $59,800 as the next downside objective, followed by $57,300. The $62K region is no longer a primary level in play.
If $65,650 does hold temporarily, we could see another short-term relief move toward $70,500 resistance, with $73,800 as the upside extension. However, that scenario would still be treated as a corrective bounce.
The 200 EMA on the daily timeframe continues to slope downward near $91,000, reinforcing broader downside pressure. RSI has recovered from oversold conditions and is hovering near 39 with average at 26, but momentum remains weak overall. Structure continues to favor downside continuation in the short to medium term.
Chart: BTC Price Action
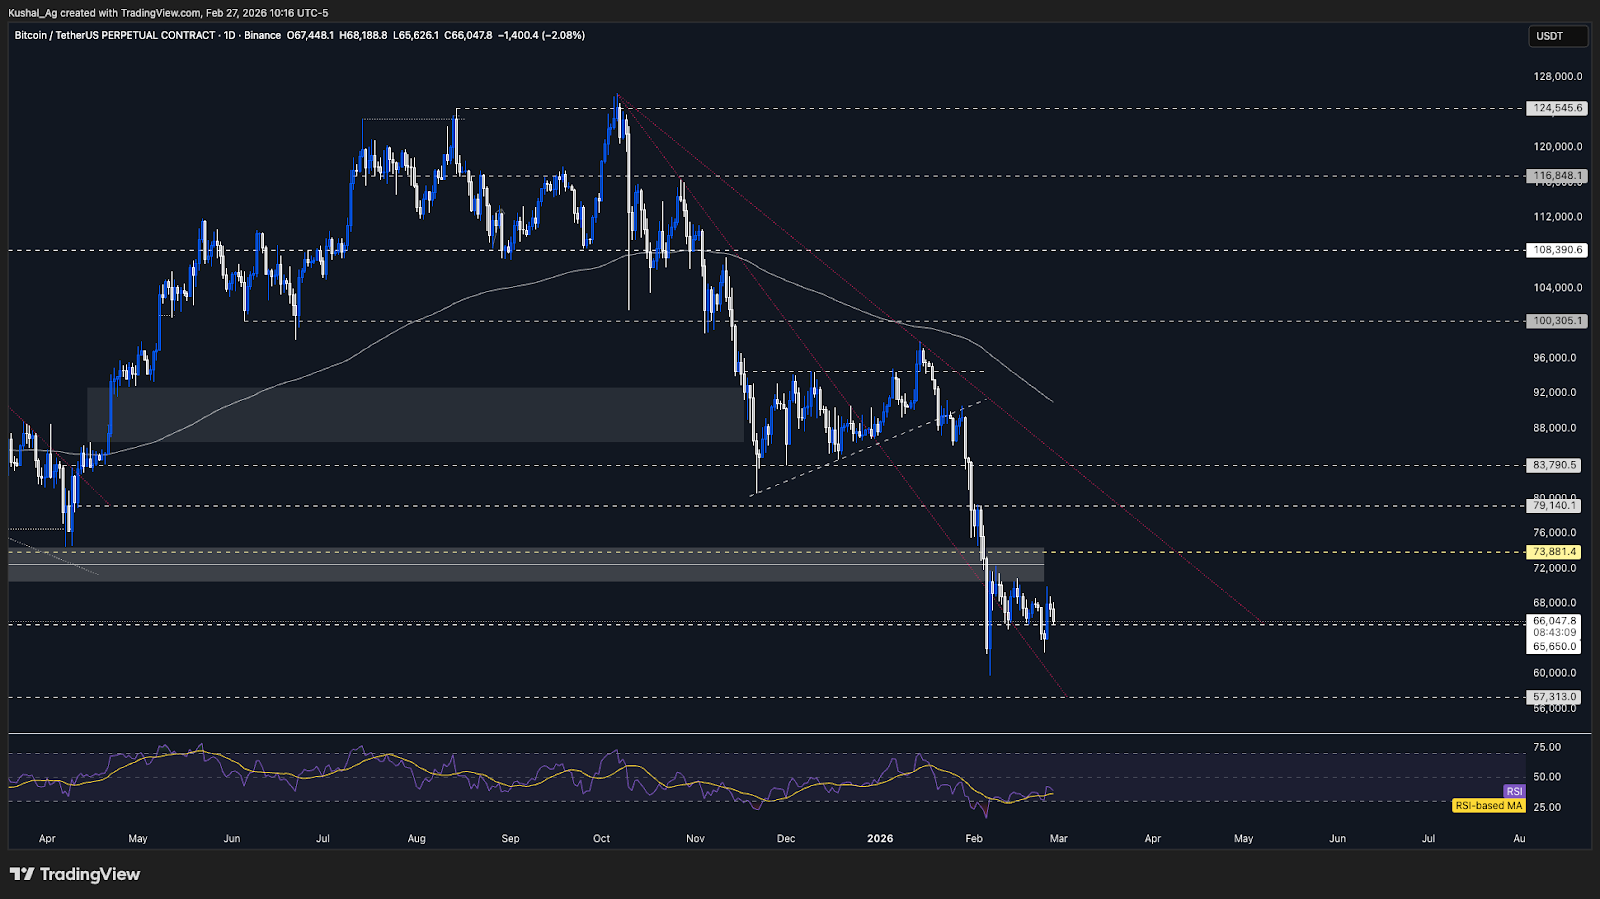
Key Levels:
- Support: $65,650
- Resistance: $70,500
- Direction: Neutral Bearish
- Upside Target: $73,800
- Downside Target: $59,800 and $57,300
Cryptonary’s Take:
The relief rally pushed Bitcoin back above $65,650 and toward the $70K region, but acceptance above those levels failed. Price is now rotating back toward support, and structurally nothing has shifted in a decisive way. Until we see sustained strength above $70,500–$73,800, this remains corrective rather than impulsive.The macro side isn’t offering strong tailwinds either. Risk appetite remains fragile, equities are showing signs of hesitation, and broader uncertainty continues to weigh on sentiment.
As long as $65,650 stays vulnerable, the next objective remains lower toward $59,800 and potentially $57,300. Counter-case only develops on sustained strength above resistance.
Ethereum (ETH)
TA:Similar to Bitcoin, Ethereum delivered a relief bounce after rotating into support, although its swing low formed slightly above the support before reversing. From there, price reclaimed the immediate $1,957 resistance and extended toward the next resistance at $2,116, where it faced rejection.
After clearing that upside liquidity, Ethereum has retraced back toward the $1,957 region, which is now acting as short-term support. While a bounce from this level remains possible, the broader structure still leans corrective.
An important development here is that Ethereum cleared the previous week’s high before rejecting, effectively taking upside liquidity. That liquidity sweep makes the structure slightly more vulnerable if weakness returns.
If $1,957 breaks, we expect a relatively aggressive move toward $1,752, followed by $1,615 as the extended downside objective. If $1,957 holds, a short-term relief bounce toward $2,116 is possible, with $2,368 as the upside extension.
The 200 EMA on the daily timeframe continues to slope downward near $2,982, reinforcing broader downside pressure. RSI has recovered from weaker conditions and is hovering near 40 with average at 36, showing mild recovery but not strong momentum expansion.
Chart: ETH Price Action
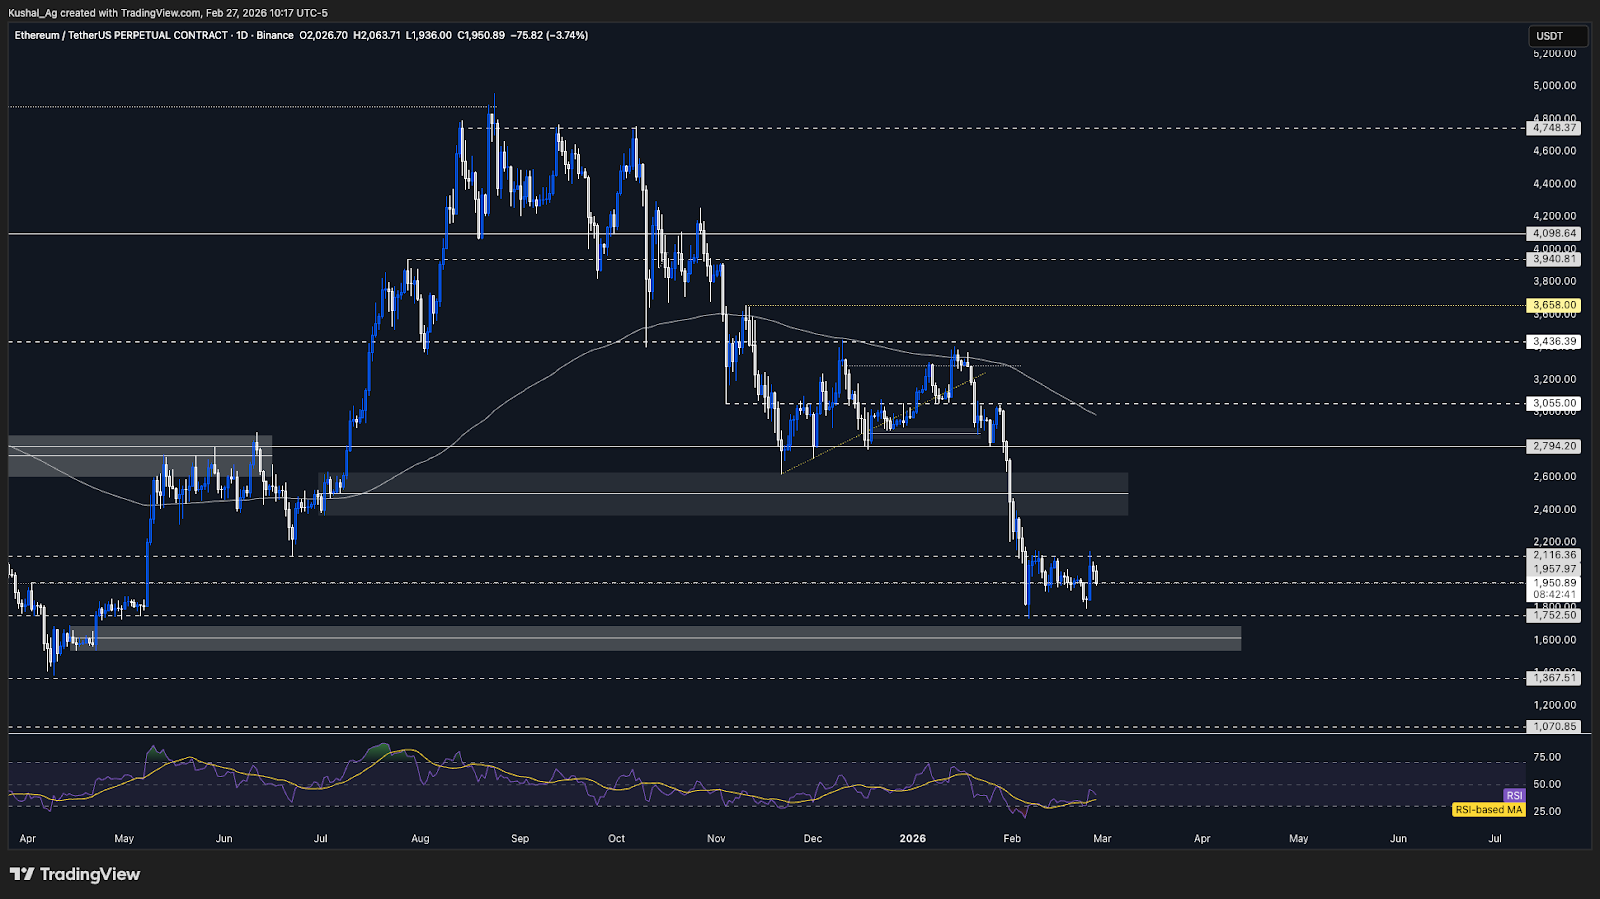
Key Levels:
- Support: $1,957
- Resistance: $2,116
- Direction: Neutral Bearish
- Upside Target: $2,368
- Downside Target: $1,752 and $1,615
Cryptonary’s Take:
Ethereum’s reclaim of $1,957 and sweep of the previous week’s high showed relative strength versus Bitcoin, but the rejection at $2,116 keeps the broader structure fragile. Price is now back at a key level, and unless we see sustained acceptance above resistance, the base case continues to lean neutral-bearish.On the relative side, the ETH-BTC ratio held the 0.029 level and delivered a short-term bounce toward 0.0307. That relative strength likely explains why Ethereum cleared the previous week’s high while Bitcoin did not. However, this move currently looks corrective.
If the 0.029 region continues to hold, Ethereum may continue to show relative strength. If that level fails, the broader downside thesis regains dominance quickly.
Solana (SOL)
TA:The previously discussed bullish divergence setup played out, with Solana bouncing from support and reclaiming $80. The move extended toward $89 resistance, printing a local high near $92.1 before facing rejection.
That bounce occurred alongside a broader market relief move, although Solana did outperform Bitcoin during that phase, likely reflecting the divergence structure. However, the reaction at $89 has once again been firm, reinforcing it as a key ceiling that has capped price since early February.
Follow-through above $89 has been limited, and price is now rotating back toward the $78 support region. Until we see a decisive daily close above $89, the structure remains range-bound between $78 and $89.
If $78 breaks with acceptance, downside targets shift toward $67.6, followed by $58.5 in an extended weakness scenario. A fresh daily close below $77-$78 could begin forming another bullish divergence, but confirmation would still require strength after the low.
The 200 EMA on the daily timeframe continues to slope downward near $138.7, maintaining broader pressure. RSI has recovered toward 41 with average around 37 but remains in the weaker zone, showing improvement without strong expansion.
Chart: SOL Price Action
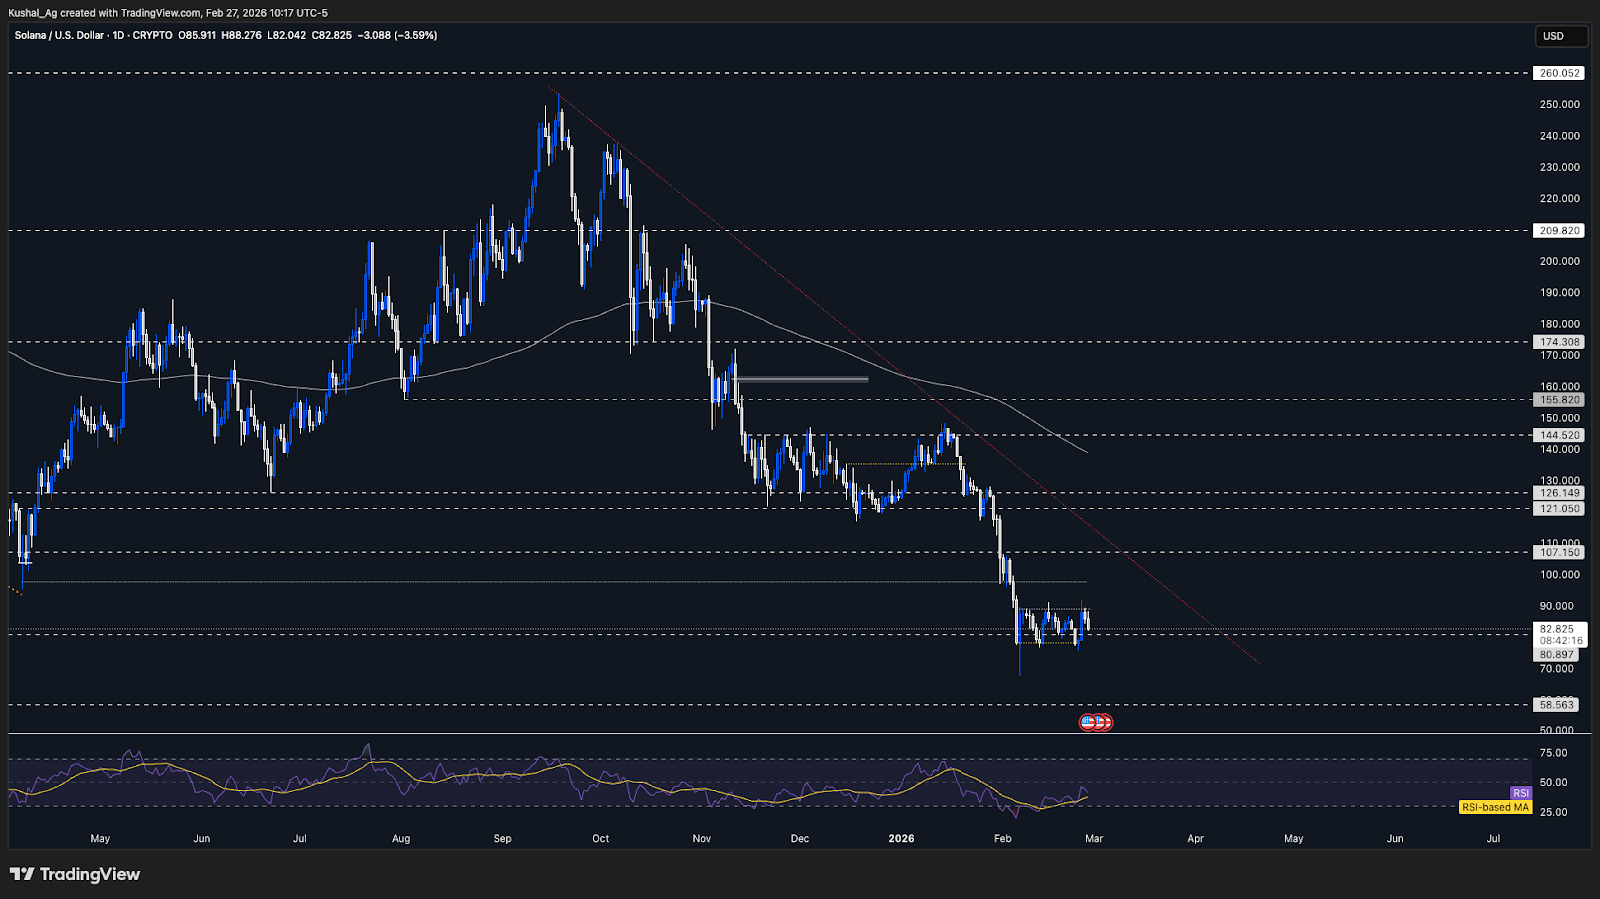
Key Levels:
- Support: $78
- Resistance: $89
- Direction: Neutral
- Upside Target: $97.7
- Downside Target: $67.6 and $58.5
Cryptonary’s Take:
The divergence delivered the expected bounce, but that move may have already played out. While Solana showed relative strength during the relief rally, the inability to secure follow-through above $89 keeps us cautious.If downside continuation resumes and Solana rotates toward the $50s region, that is where historical buying interest has previously emerged. That zone would likely shift the discussion from short-term structure to potential longer-term accumulation. We are not positioning for it yet, but if and when price approaches that region, we will reassess stance accordingly.
Hyperliquid (HYPE)
TA:Previously, when we analyzed HYPE, price was hovering around the $25.4 support and we mentioned that a short-term bounce from that region was possible before further downside continuation. That is exactly what played out. Price bounced from $25.4 and rotated directly toward the $28.39 resistance.
Since reaching $28.39, HYPE has attempted multiple reclaim attempts. However, each daily candle has wicked above $28.39 and closed back below it. The repeated failures to secure acceptance above resistance suggest buyer exhaustion.
The inability to hold above $28.39 keeps the structure heavy. As long as this level caps price, the probability favors another rotation lower toward $25.4 support.
If $25.4 breaks, the next downside objective remains $23.5. On the upside, only a sustained break and hold above $30.64 would invalidate the current bearish thesis.
The 200 EMA on the daily timeframe remains overhead near $32.26, acting as dynamic resistance. RSI has slipped below the 50 neutral level and is hovering near 45 with average at 48, reflecting weakening momentum and supporting downside bias.
Chart: HYPE Price Action
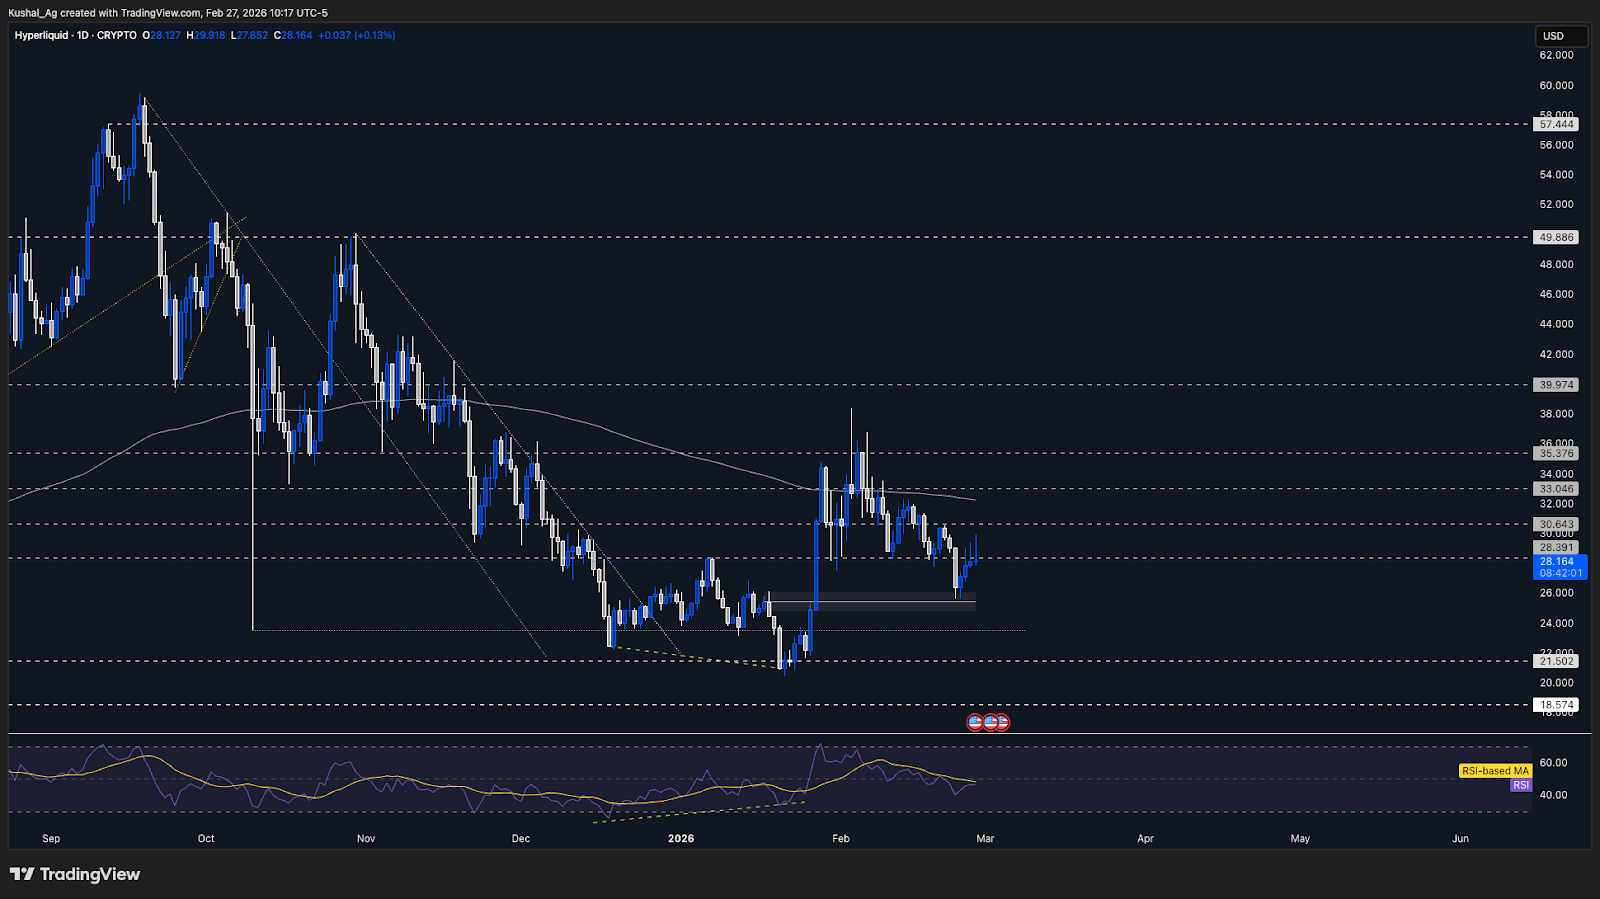
Key Levels:
- Support: $25.4
- Resistance: $28.39
- Direction: Bearish
- Upside Target: $30.64
- Downside Target: $23.5
Cryptonary’s Take:
The bounce from $25.4 was anticipated and has now played out. What matters is the reaction at $28.39, and so far that reaction shows clear rejection.Unless we see sustained acceptance above $30.64, rallies remain corrective. The structure continues to favor downside continuation, with $25.4 and $23.5 as the levels in focus.
Aura (AURA)
TA:Price structure on the daily timeframe remains largely unchanged, with no meaningful breakout or breakdown since the previous analysis. Aura continues to compress within its recent range without structural expansion.
The potential bullish divergence remains in place. RSI continues to hold above prior swing lows while price stays near local lows, but confirmation will require visible strength and upside follow-through.
There has been no continuation yet, and without broader market strength, particularly from Solana, upside expansion remains limited.
The 200 EMA on the daily timeframe continues to slope downward near 0.0455, reflecting prevailing pressure. RSI is hovering near 46 with average 36, showing mild recovery but still within a relatively weak momentum regime.
Chart: AURA Price Action
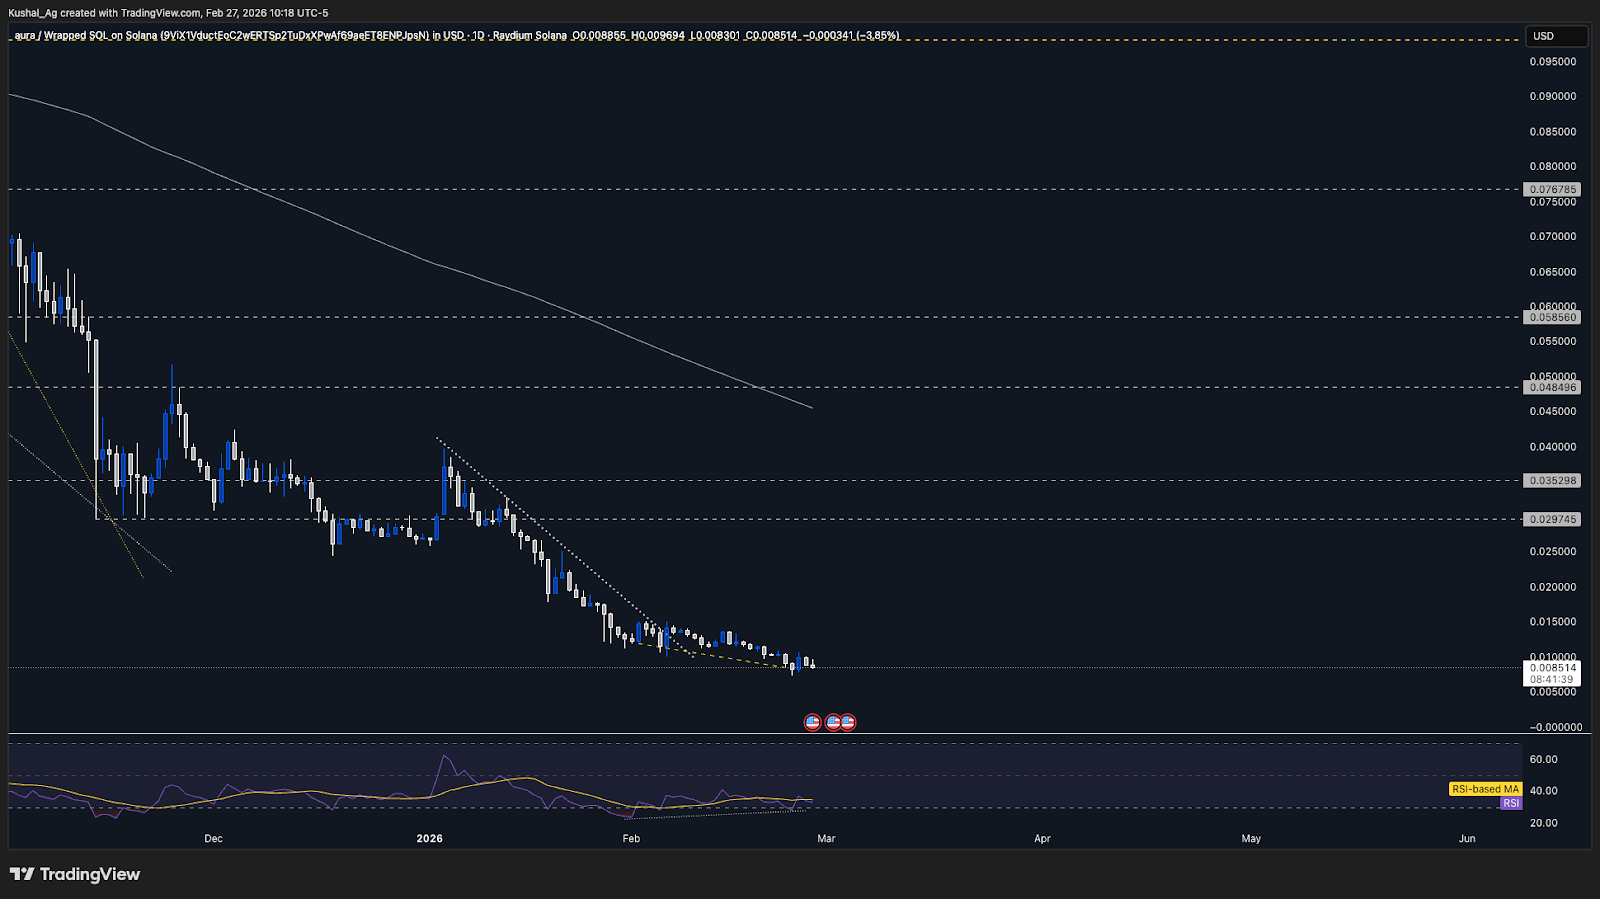
Cryptonary’s Take:
Aura remains in compression with a developing bullish divergence, but without strength confirmation, the setup is still in the works. Aura and other high beta assets are likely waiting for the broader market to complete its downside move to start carving out a base.Bitcoin Dominance (BTC.D)
Bitcoin dominance topped precisely within the 59.9%-61.26% supply range we had mapped out as a likely exhaustion zone a couple of weeks ago. From there, dominance rolled over into the 58.7%-58.5% region, which was the next downside level.The long-standing yellow uptrend that had been supporting dominance since February 2024 is now breaking down. That structural violation is meaningful, as it signals the broader upward dominance trend is weakening.
Context remains critical. A falling dominance is constructive for alts only if Bitcoin is stable or trending higher. Currently, dominance is declining while Bitcoin itself is also under pressure. That dynamic is not bullish for alts, it typically reflects broader risk-off conditions.
The next wider support for dominance sits near 57.2%. If dominance continues lower while Bitcoin weakens simultaneously, alts could face further relative underperformance before any constructive rotation develops.
A potential future scenario would involve dominance breaking lower alongside Bitcoin, followed by a retest of the broken yellow trendline from below. That retest, if rejected, could coincide with Bitcoin forming a broader base and alts beginning to outperform. However, this remains a conditional setup and not the current base case.
Chart: BTC Dominance
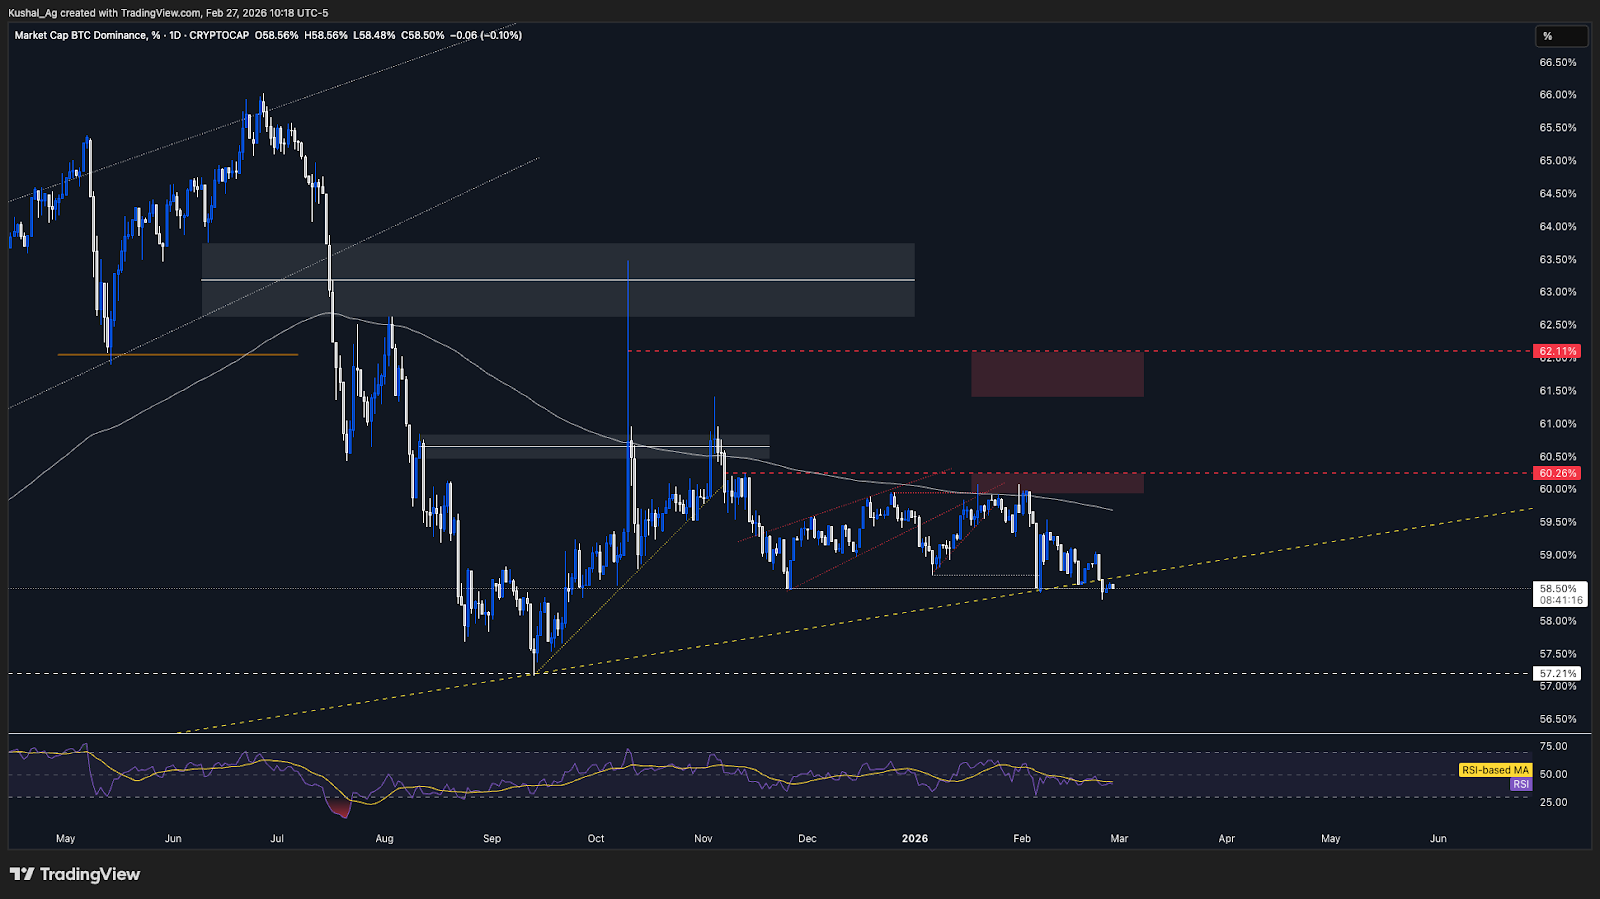
Cryptonary’s Take:
The breakdown in Bitcoin dominance is structurally important, but the quality of that breakdown matters. Dominance falling alongside a weak Bitcoin is not the type of rotation that signals healthy alt-season conditions. Instead, it can often reflect broader market stress.The ideal setup for alt outperformance remains dominance falling while Bitcoin stabilizes or trends higher. Until we see that alignment, we treat the current dominance decline cautiously.
Closing Thoughts
The relief rally has likely run its course. While the bounce was aggressive, it did not alter the broader structure. Resistance levels across majors have held, and momentum is beginning to fade as price rotates back toward key supports.For Bitcoin, failure to sustain above reclaimed resistance keeps the neutral-bearish bias intact, with the mid-high $50Ks still on the table when support breaks. Ethereum reflects a similar setup, the move above $1,957 lacked follow-through, and unless we see strength above $2,116, downside toward $1,752 remains exposed.
Solana showed relative strength during the bounce, likely driven by the divergence setup, but the rejection at $89 caps upside for now. Unless that level is reclaimed, the move remains corrective. Hyperliquid, meanwhile, is structurally weaker, repeated rejections at $28.39 suggest exhaustion, and sustained selling below that region could open continuation toward the mid-low $20s.
An additional development to monitor is the emergence of hidden bearish divergence on the daily timeframe across Bitcoin, Ethereum, and Solana. Price has printed lower highs while RSI has pushed into relatively higher highs during the bounce phase. If/when reclaimed support levels now break again, the move could accelerate to the downside.
Overall, the bounce did not invalidate the broader thesis. Until resistance levels are decisively reclaimed across majors, posture remains defensive and continuation lower remains the base case.
Continue reading by joining Cryptonary Pro
$1,548 $997/year
Get everything you need to actively manage your portfolio and stay ahead. Ideal for investors seeking regular guidance and access to tools that help make informed decisions.
For your security, all orders are processed on a secured server.
As a Cryptonary Pro subscriber, you also get:
Value Guarantee - If cumulative documented upside does not reach 100% during your 12-month membership, you can request a full refund. Terms
24/7 access to experts with 50+ years’ experience
All of our top token picks for 2025
On hand technical analysis on any token of your choice
Weekly livestreams & ask us anything with the team
Daily insights on Macro, Mechanics, and On-chain
Curated list of top upcoming airdrops (free money)
Value Guarantee
If cumulative documented upside does not reach 100% during your 12-month membership, you can request a full refund.
Our track record speaks for itself
With over 2.4M tokens and widespread misinformation in crypto, we cut through the noise and consistently find winning assets.
Our track record speaks for itself
With over 2.4M tokens and widespread misinformation in crypto, we cut
through the noise and consistently find winning assets.


Frequently Asked Questions
Can I trust Cryptonary's calls?
Yes. We've consistently identified winners across multiple cycles. Bitcoin under $1,000, Ethereum under $70, Solana under $10, WIF from $0.003 to $5, PopCat from $0.004 to $2, SPX blasting past $1.70, and our latest pick has already 200X'd since June 2025. Everything is timestamped and public record.
Do I need to be an experienced trader or investor to benefit?
No. When we founded Cryptonary in 2017 the market was new to everyone. We intentionally created content that was easy to understand and actionable. That foundational principle is the crux of Cryptonary. Taking complex ideas and opportunities and presenting them in a way a 10 year old could understand.
What makes Cryptonary different from free crypto content on YouTube or Twitter?
Signal vs noise. We filter out 99.9% of garbage projects, provide data backed analysis, and have a proven track record of finding winners. Not to mention since Cryptonary's inception in 2017 we have never taken investment, sponsorship or partnership. Compare this to pretty much everyone else, no track record, and a long list of partnerships that cloud judgements.
Why is there no trial or refund policy?
We share highly sensitive, time-critical research. Once it's out, it can't be "returned." That's why membership is annual only. Crypto success takes time and commitment. If someone is not willing to invest 12 months into their future, there is no place for them at Cryptonary.
Do I get direct access to the Cryptonary team?
Yes. You will have 24/7 to the team that bought you BTC at $1,000, ETH at $70, and SOL at $10. Through our community chats, live Q&As, and member only channels, you can ask questions and interact directly with the team. Our team has over 50 years of combined experience which you can tap into every single day.
How often is content updated?
Daily. We provide real-time updates, weekly reports, emergency alerts, and live Q&As when the markets move fast. In crypto, the market moves fast, in Cryptonary, we move faster.
How does the Value Guarantee work?
We stand behind the value of our research. If the documented upside from our published research during your 12-month membership does not exceed the annual subscription cost, you can request a full refund. Historical context: In every completed market cycle since 2017, cumulative documented upside has exceeded 10X this threshold.
TermsRecommended from Cryptonary