Save 23% ($351) & Get a Free 1-1 Call with our Team ⏰ : 0d 2h 59m 43s
BTC, ETH and More: Relief Rally Stalls, Downside Risks Emerge
Last week’s relief rally played out with precision across majors, but the follow-through never came. With price now stalling at resistance and momentum cooling, risk is beginning to rotate back to the downside...

Disclaimer: This is not financial or investment advice. You are responsible for any capital-related decisions you make, and only you are accountable for the results.
Quick bridge from last week…
Last week, in the Market Direction, we carried a neutral-bullish stance across the majors. For the majors, that neutral-bullish view was purely for a relief move, and that played out cleanly. Bitcoin and Ethereum both hit their upside relief targets almost to the level, with Bitcoin tapping the $72,000 zone and Ethereum tagging $2,116 before stalling and starting to roll over again. Overall, the levels on BTC and ETH levels were very precise.Solana, on the other hand, remained relatively sideways through the week. While it has managed to hold above support, price has lacked upside momentum and has not been able to extend meaningfully higher, keeping Solana range bound.
With that context, we now move forward to assess how price action develops from here and what the next few sessions are likely to bring.
TLDR
- Bitcoin: Relief rally targets have played out, price is now rejecting from resistance, and unless $72,000 is reclaimed, upside moves remain corrective with downside risk more likely.
- Ethereum: Relief rally has stalled at resistance similar to BTC, structure remains weak and price risks rolling over unless $2,150 is reclaimed.
- Solana: Still range bound and relatively weak, holding prior support for now, but a break below $80.89 would likely open downside continuation.
Bitcoin
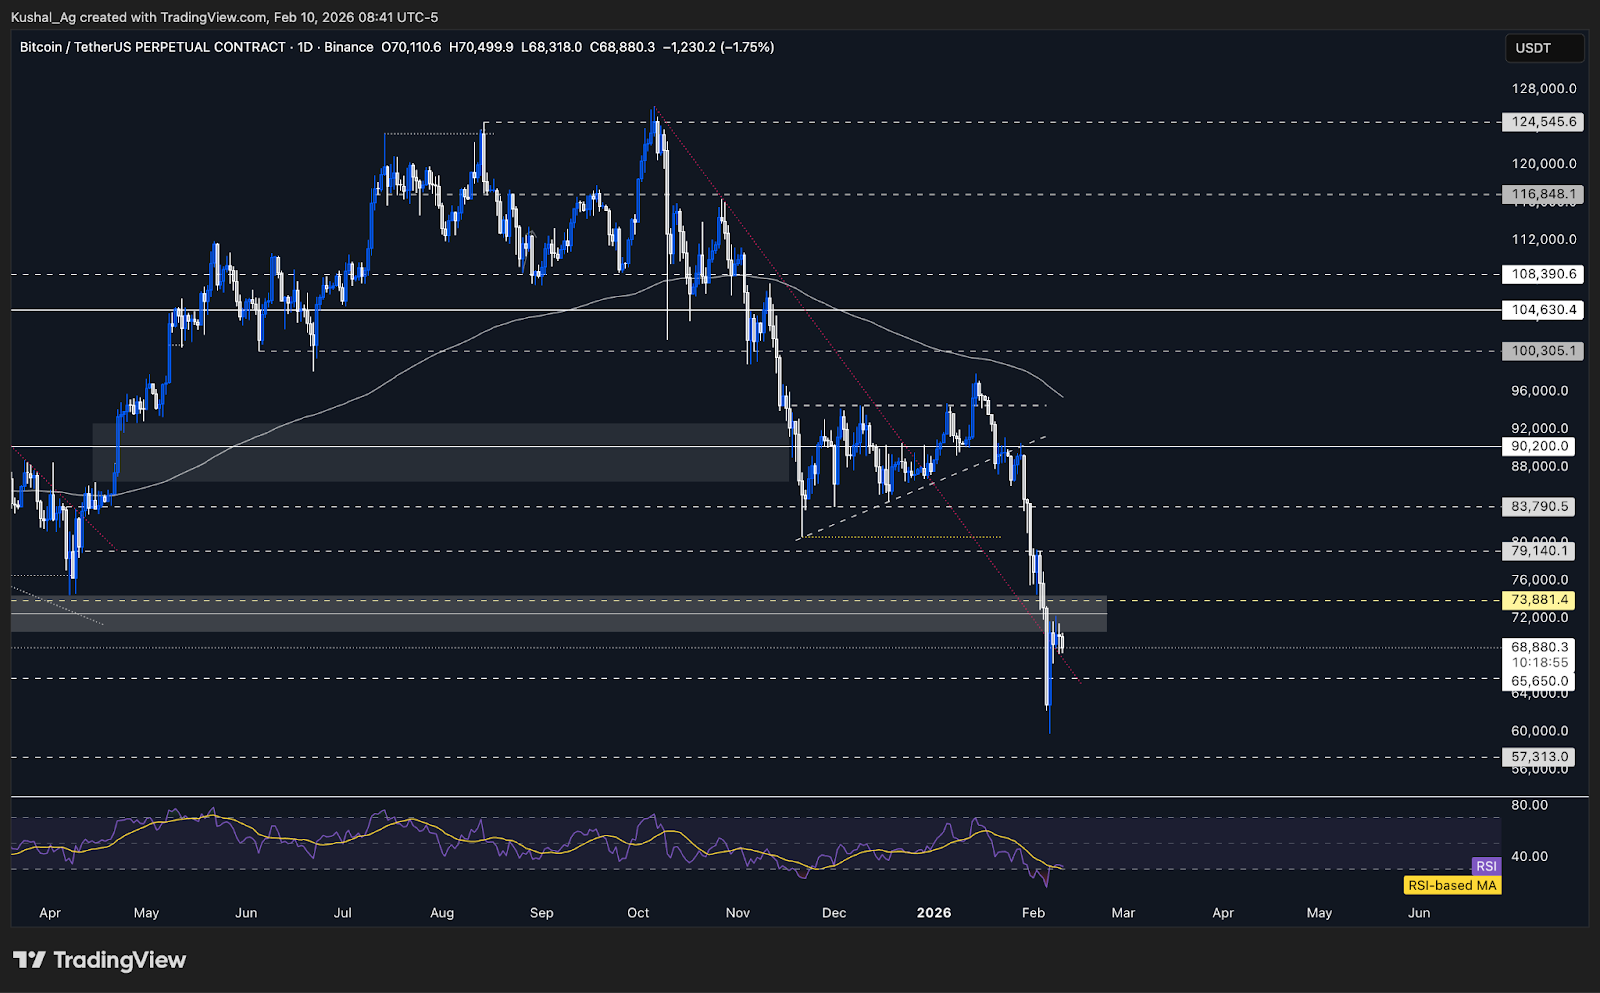
TABitcoin delivered the relief rally we were anticipating from the $65K region, price has cleanly hit both upside targets at $68.7K and $72K. After tagging a local high near $72.3K, price shifted into a choppy range, signaling exhaustion of this immediate relief move.
Price is now compressing just below the $72K resistance band while sitting slightly above the previously lost downtrend trendline. This area is acting as a decision zone, with Bitcoin neither breaking down aggressively nor showing follow-through strength on the upside for the relief rally. The lack of momentum continuation after the relief rally keeps upside conviction capped.
On the downside, the February 7 daily low around $67.2K becomes critical. A deviation below this level followed by a reclaim could extend the relief structure higher. However, acceptance below $67.2K would signal that the relief phase is likely complete.
If $67.2K fails decisively, the next key level to watch is $65.65K (monthly order-block support). Losing that level on a closing basis would reopen much deeper downside liquidity toward $57.3K, which remains the next major untested area on higher timeframes.
The daily RSI has bounced from deep oversold conditions but remains weak around 31 with average at 29, while the 200 EMA on the daily timeframe continues to slope downward near $95.3K, reinforcing that broader trend pressure is still bearish despite the relief bounce.
Key Levels
- Support: $67,200 and $65,650
- Resistance: $73,800
- Direction: Neutral-Bearish
- Upside Target: $79,140
- Downside Target: $57,300
Cryptonary’s Take
Bitcoin has likely completed its relief rally from deeply oversold conditions, and price is now stalling beneath heavy resistance. With upside targets already met, risk skews back toward consolidation or renewed downside unless price reclaims $72K with strength.As long as Bitcoin trades below $73.8K, rallies are best treated as corrective, with $67.2K acting as the line separating continuation from deeper downside.
Ethereum
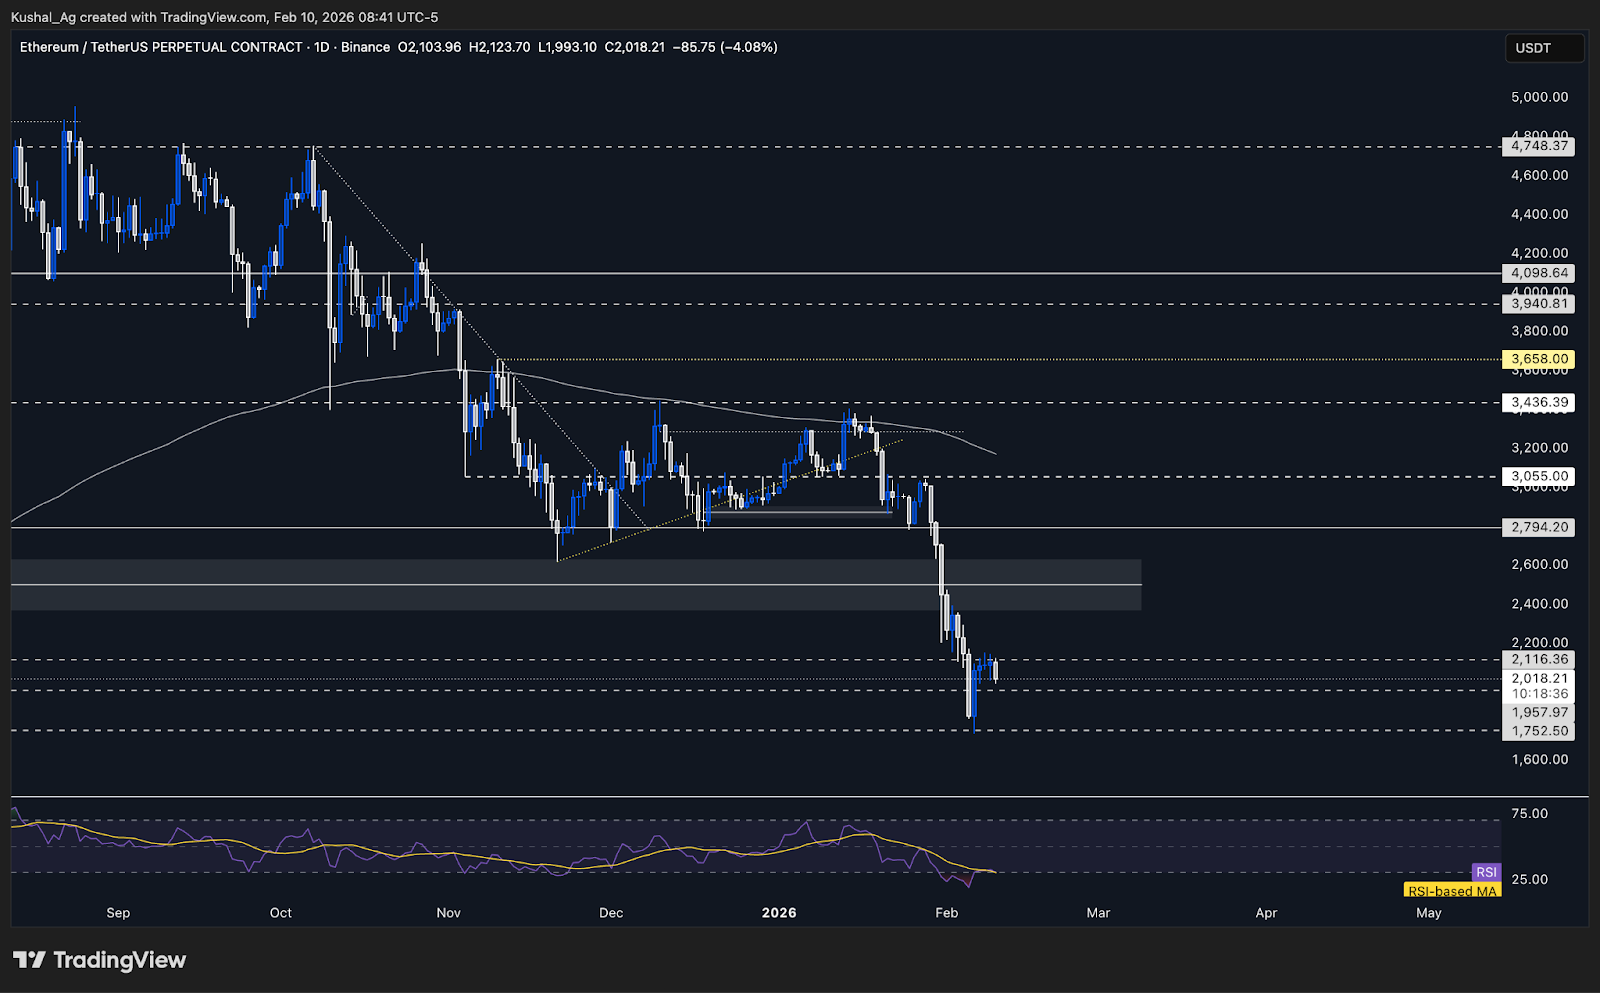
TAEthereum delivered the relief rally exactly as anticipated from oversold conditions, with price first reclaiming $1,957 and then pushing cleanly into the upside target at $2,116. This move aligned well with oversold momentum resetting, and the reaction into resistance was technically precise.
However, price failed to secure any daily close above $2,116, with only minor wicks above the level. This behavior signals exhaustion of the relief. The inability to build acceptance above resistance shifts the bias back toward caution.
With the relief structure likely complete, Ethereum now risks rolling over alongside Bitcoin. The $1,957 level, previous resistance, now becomes the key support to watch. As long as price remains below $2,116, upside attempts should be treated as corrective.
A breakdown below $1,957 would reopen the path toward $1,752, which remains the next major downside liquidity level. If $1,752 is lost, downside risk expands quickly, with limited structural support until the $1,615 region.
The daily RSI remains weak around 30 with average at 30 as well, and the 200 EMA has begun sloping downward, reinforcing broader bearish pressure despite the recent bounce.
Key Levels
- Support: $1,957
- Resistance: $2,116
- Direction: Neutral-Bearish
- Upside Target: $2,372
- Downside Targets: $1,752 & $1,615
Cryptonary’s Take
Ethereum has completed its relief rally from oversold conditions, but failure to break above $2,116 shifts the bias to neutral-bearish. As long as price trades below this level, rallies are corrective in nature, with downside liquidity at $1,752 in play. A daily close above $2,116 would invalidate this view, but until then, risk remains skewed to the downside.Solana
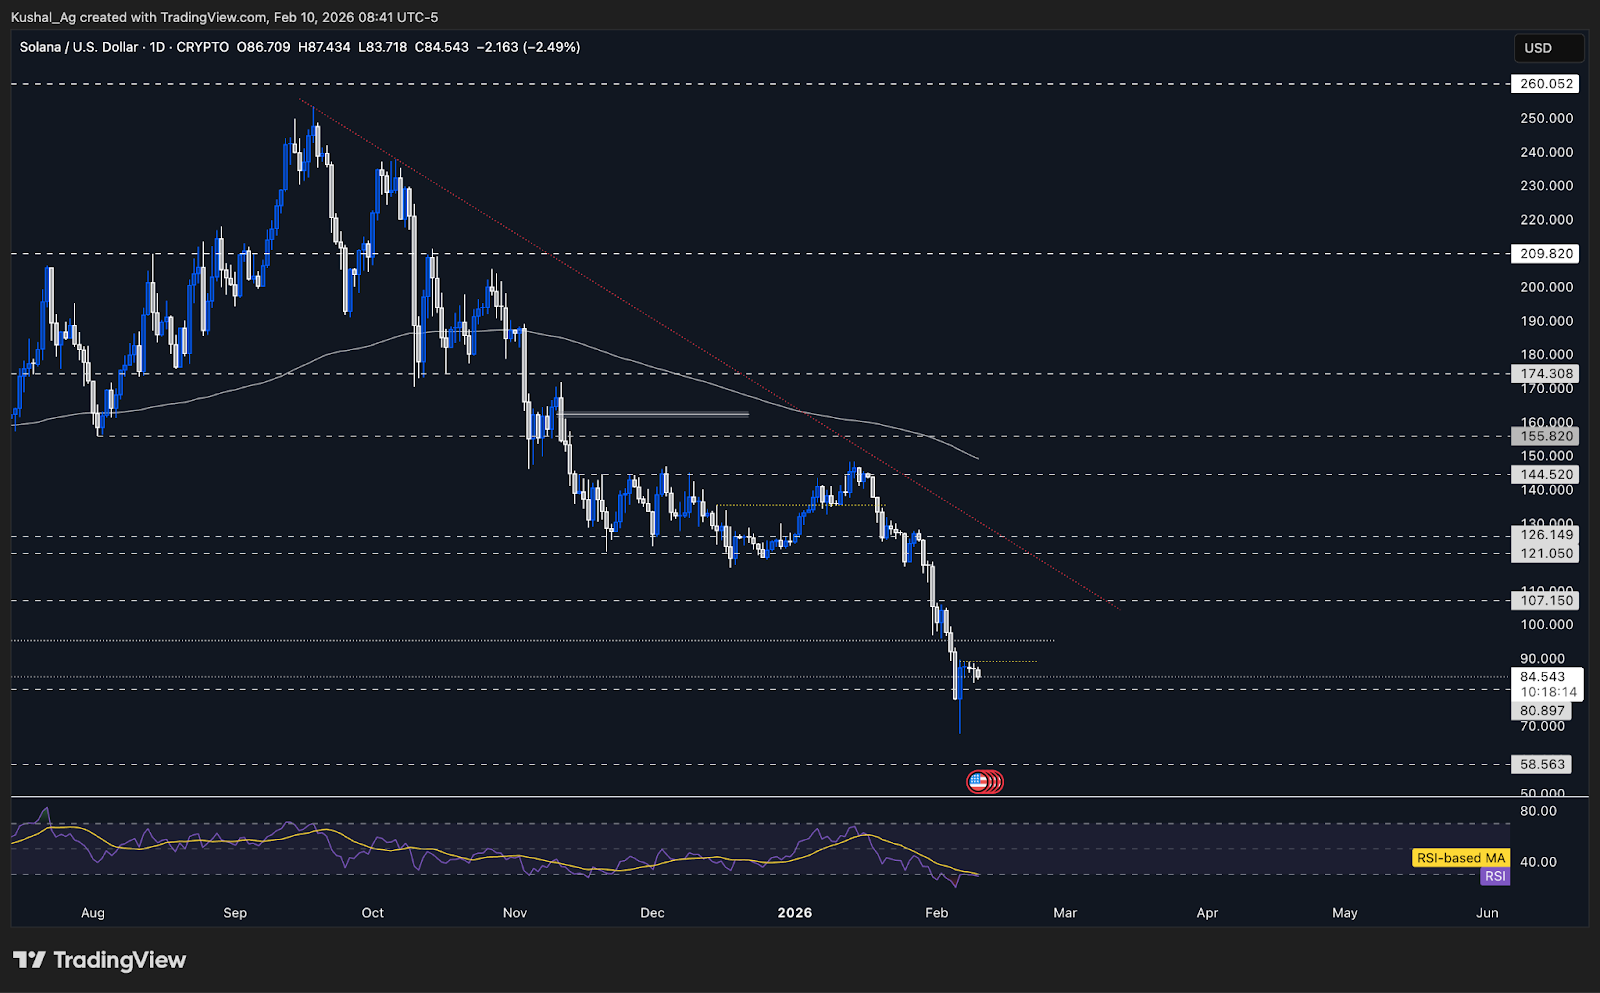
TASolana continues to trade weaker relative to Bitcoin and Ethereum, price is still stuck inside the same broader range and showing no meaningful structural shift in either direction. There has been no reclaim of key resistance and no breakdown of support yet, keeping Solana locked in a tight space.
Price remains capped below the mid range resistance near $89, which has consistently rejected upside attempts over the past few sessions. This level has now become the immediate pivot, with Solana unable to build acceptance above it despite oversold conditions across momentum indicators.
On the downside, $80.89 remains the key support holding the range together. As long as this level holds, price stays range-bound. However, a clean break below $80.89 would reopen downside risk toward the recent local low near $67.7, which marks the next meaningful liquidity pocket.
If $67.7 fails to hold, downside risk expands further toward $58.56, which becomes the next high-probability support level in a broader risk-off scenario.
The daily 200 EMA continues to slope downward around $148.8, reinforcing higher-timeframe bearish pressure, while RSI remains deeply oversold near 28 with average at 30 with no clear divergence or reversal signal yet.
Key Levels
- Support: $80.89
- Resistance: $89
- Direction: Neutral-Bearish
- Upside Targets: $95 & $107
- Downside Targets: $67.7 and $58.56
Cryptonary’s Take
Solana remains range-bound and weak, price is stuck below $89 and there is no structural reclaim in sight. As long as $80.89 holds, downside might be capped, but failure there exposes $67.7 and potentially $58.56. Until Solana reclaims $89 with follow-through, any upside should be treated as corrective.Closing thoughts
The relief rally across majors appears to be losing momentum, price is starting to stall near resistance. As things stand, the base case is for markets to roll over again on the downside, consistent with the structure we’ve outlined in today’s analysis.That said, clear invalidation levels remain. A sustained break above $72,000 on Bitcoin and $2,150 on Ethereum would shift the narrative and reopen upside relief continuation. Until those levels are reclaimed, upside moves should be treated as corrective.
Solana remains largely reactive and is likely to follow Bitcoin and Ethereum unless it shows decisive strength of its own. Hyperliquid, meanwhile, has seen its bullish thesis invalidated, with a potential bearish divergence nearing confirmation, making it an important chart to watch for broader alt-side direction. Additionally, if the majors print fresh body closings below the recent swing lows, it could open the door for potential bullish divergence setups to form across the board, a hypothetical but plausible setup to keep on the radar if downside continuation materialises.
Overall, while a relief phase appears to be fading, markets remain fluid. We’ll stay guided by price action and key invalidation levels, and adjust as clarity develops.
Peace!
Recommended from Cryptonary


