Save 23% ($351) & Get a Free 1-1 Call with our Team ⏰ : 0d 2h 59m 44s
BTC, ETH and More: Short-Term Upside Liquidity in Play
Markets are pausing at key levels, and the next move is starting to take shape. After completing the expected downside into support, the price is now stabilising while early signs of short-term upside liquidity begin to open across majors. At the same time, stablecoin dominance is reacting at a critical decision zone, setting the stage for whether this becomes a relief bounce or... the next leg lower. Let's dive in...
Disclaimer: This is not financial or investment advice. You are responsible for any capital-related decisions you make, and only you are accountable for the results.
Quick bridge from previous week…
In the previous analysis, we had a neutral-bearish stance across Bitcoin, Solana, and Hyperliquid, with a neutral stance on Ethereum, and we expected prices to move into their key support regions. Since then, that thesis has played out, all majors tapped their respective supports, while Hyperliquid came just slightly short. Price is now stabilizing around these zones, and at the same time, we are also seeing the emergence of short-term setups on the higher (3-day) timeframe, which is opening up potential short-term upside liquidity across majors.Alongside this, we were tracking stablecoin dominance toward the 11.69% level, which has now been hit and is reacting, acting as a key decision zone. This has directly reflected in crypto, with markets finding support as dominance stalls. Given these developments, we have reassessed our stance across majors, and have also reintroduced stablecoin dominance into the analysis, as it remains a leading indicator, often signaling market direction before it becomes clear on the crypto charts themselves.
On the macro side, Middle East tensions continue to escalate, keeping oil prices elevated and financial conditions tight, which remains an unsupportive backdrop for risk assets. At the same time, markets are watching upcoming labour market data (April 3), although the primary focus remains on inflation and geopolitical developments. We have covered these dynamics and their implications in detail in yesterday’s Market Update, which you can refer to for a deeper macro view.
Disclaimer: This content is for informational and educational purposes only. It does not constitute financial advice, and should not be relied upon as a basis for making investment decisions. Virtual assets are volatile and may lose their value in full. Past performance does not indicate future results. Always do your own research.
TLDR
- Risk Posture: Defensive
- Bitcoin: BTC is holding $65,650 support after completing the initial downside move. The stance is now neutral, with a short-term bounce toward $70,500-$71,500 possible, while a breakdown of current support ($65,650) opens $62,400-$57,300.
- Ethereum: ETH bounced cleanly from $1,957 and is approaching $2,116 resistance. The stance remains neutral, with a breakout above $2,170 opening $2,400, while rejection keeps it range-bound.
- Solana: SOL has reacted from $80.89-$78 support after the breakdown. The stance is neutral, with consolidation likely unless $78 breaks, which would open $70-$67.8.
- Hyperliquid: HYPE is hovering just above $35.37 support after the selloff. The stance remains neutral-bearish, with a breakdown opening $33, while reclaiming $39.97 is needed for strength.
- Aura: AURA continues to consolidate with weak momentum and no structural change yet, with direction dependent on Solana.
- USDT.D + USDC.D: Stablecoin dominance is rejecting from the 11.69% level. A continued pullback supports short-term upside in crypto, while a breakout above keeps downside pressure intact.
Bitcoin
TABitcoin has now reached and held the $65,650 support, which was our primary downside target. The reaction from this level has been constructive over the past few sessions, indicating that sellers are slowing down in this region.
Given this, and with upside liquidity now open on the 3-day timeframe, we are pivoting from a neutral-bearish stance to a neutral stance. As long as $65,650 continues to hold, there is a short-term bounce scenario in play toward $70,500-$71,500, with further upside toward $73,800 if momentum builds.
However, this setup remains conditional. A clean breakdown below $65,650 would invalidate the bounce scenario and shift the structure back to the downside, at which point we would pivot back to a neutral-bearish stance, targeting $62,400, followed by $57,300.
On the upside, $70,500 remains the key resistance, and price reaction around this level will determine whether this is just a relief bounce or something more sustained.
The 200 EMA continues to trend downward near $85,000, reflecting broader weakness, while RSI is around 42, showing momentum is still soft despite the support holding.
Chart: Bitcoin Price Action
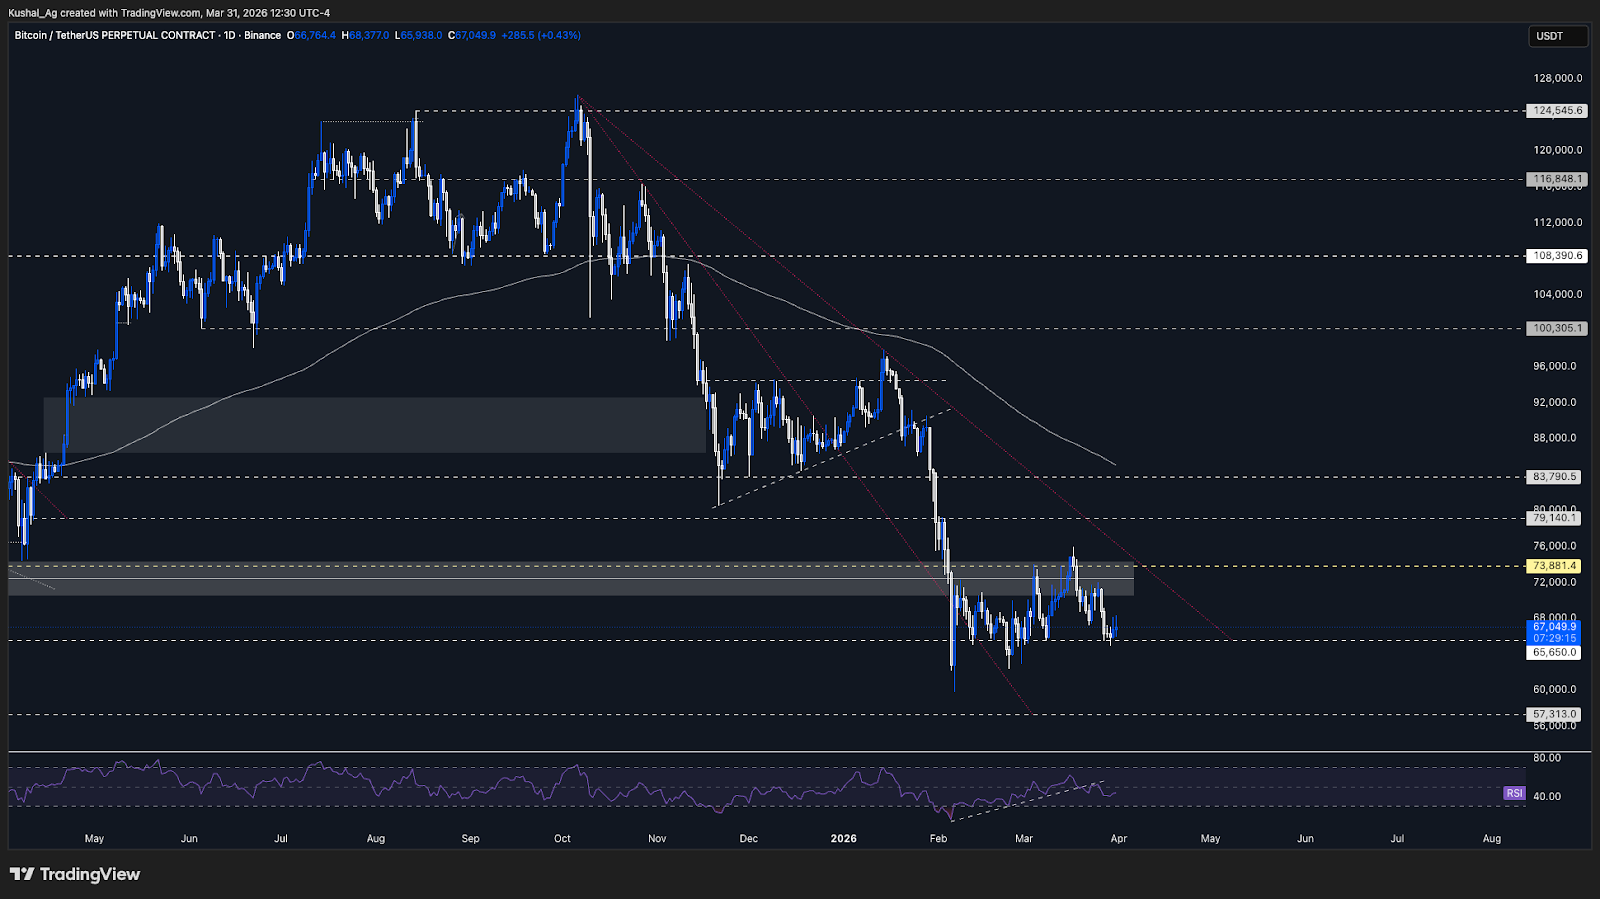
Key Levels:
- Support: $65,650
- Resistance: $70,500
- Direction: Neutral
- Upside Target: $71,500 & $73,800
- Downside Target: $62,400 & $57,300
Cryptonary’s Take:
Bitcoin is currently at a key level, with support holding and short-term upside liquidity opening up. This justifies the shift to a neutral stance, as the market has not yet confirmed either continuation or reversal.If price continues to hold above $65,650, we could see a relief move toward the upper range, driven by short-term positioning and liquidity. However, this would still be viewed as a bounce within a broader weak structure. A break below $65,650 remains the key trigger for downside continuation.
Ethereum
TAEthereum has now tapped the $1,957 support and reacted strongly from that region, with price currently pushing back toward the $2,116 resistance. The support held nicely, confirming it as a key level in the current structure.
Price is now approaching the upper range, and similar to Bitcoin, there is a short-term bounce setup in play. As long as $1,957 continues to hold, Ethereum has room to push toward $2,170 on the 3-day timeframe, with further upside toward $2,400 if momentum builds.
However, the structure remains range-bound, and confirmation is still required. A clean break and close above $2,116-$2,170 would be needed to shift the stance toward neutral-bullish and open continuation toward higher levels.
Until then, $2,116 acts as key resistance, and failure to break above it could result in continued consolidation within the range.
The 200 EMA continues to trend downward near $2,730, reflecting broader weakness, while RSI has recovered to around 50, indicating a more neutral and stable momentum profile.
Chart: Ethereum Price Action
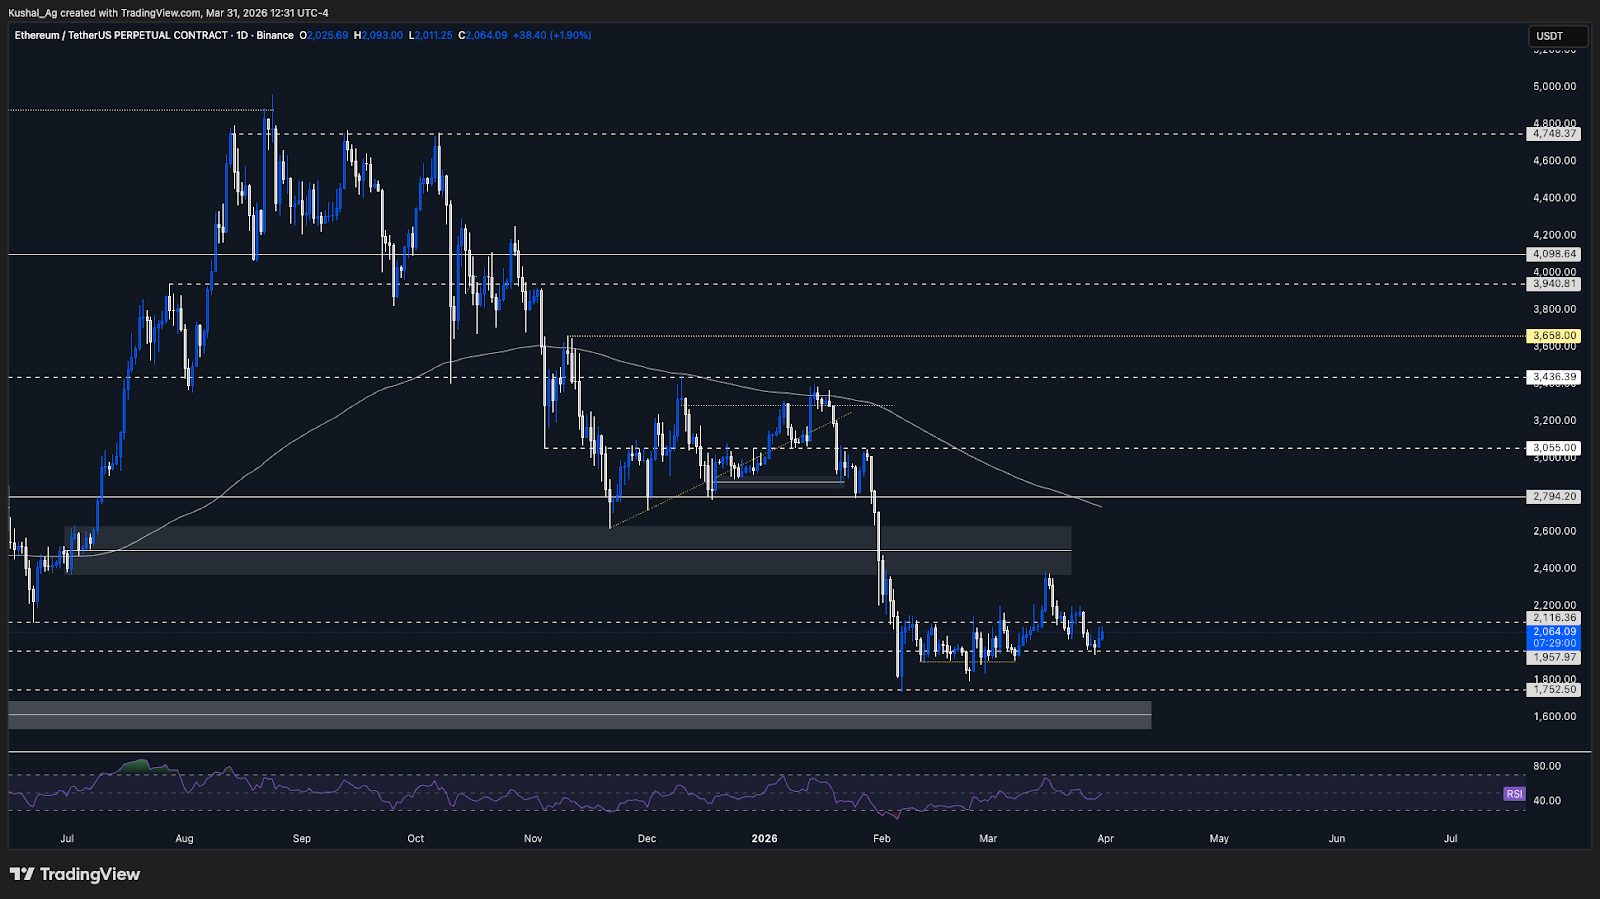
Key Levels:
- Support: $1,957
- Resistance: $2,116
- Direction: Neutral
- Upside Target: $2,170 & $2,400
- Downside Target: $1,957
Cryptonary’s Take:
Ethereum has shown a clean reaction from support, placing it in a short-term constructive position within the range. The current move still looks like a bounce toward resistance. The key lies in how price behaves at $2,116-$2,170, where a breakout would signal strength and continuation, while rejection would keep Ethereum range-bound.At the same time, the ETH/BTC ratio continues to hold the 0.03 level, which we’ve been tracking closely. As long as this level holds, it signals relative strength in Ethereum vs Bitcoin, with upside targets at 0.032, followed by 0.0346 if momentum builds. This supports the case for Ethereum potentially outperforming Bitcoin in the short term.
For now, the stance remains neutral with a slight upside bias, but confirmation on both ETH price and the ETH/BTC ratio is required before shifting to a more constructive outlook.
Solana
TAIn the previous analysis, we held a neutral-bearish stance, expecting continuation lower after the rejection from the long-term downtrend trendline and breakdown of the short-term structure. The initial downside move played out, Solana tapped $80.89 and took support from just a few cents above the $78 level.
Since then, price has shown a decent reaction, holding above the $80.89 level, which indicates that sellers are slowing down in this region. Given this, we are now pivoting from a neutral-bearish stance to a neutral stance.
The key levels to watch are $80.89 and $78. As long as these levels hold, Solana is likely to stabilize or move sideways, aligning with a broader market pause. However, this setup remains conditional. A break below $80.89 followed by a confirmed breakdown below $78 would reintroduce weakness, at which point we would pivot back to a neutral-bearish stance, targeting $70 & $67.8 on the downside.
On the upside, reclaiming higher levels, particularly $89, would be required to shift momentum back toward a more constructive structure.
The 200 EMA continues to trend downward near $124, reflecting macro weakness, while RSI is around 40, indicating soft momentum but nearing potential support zones.
Chart: Solana Price Action
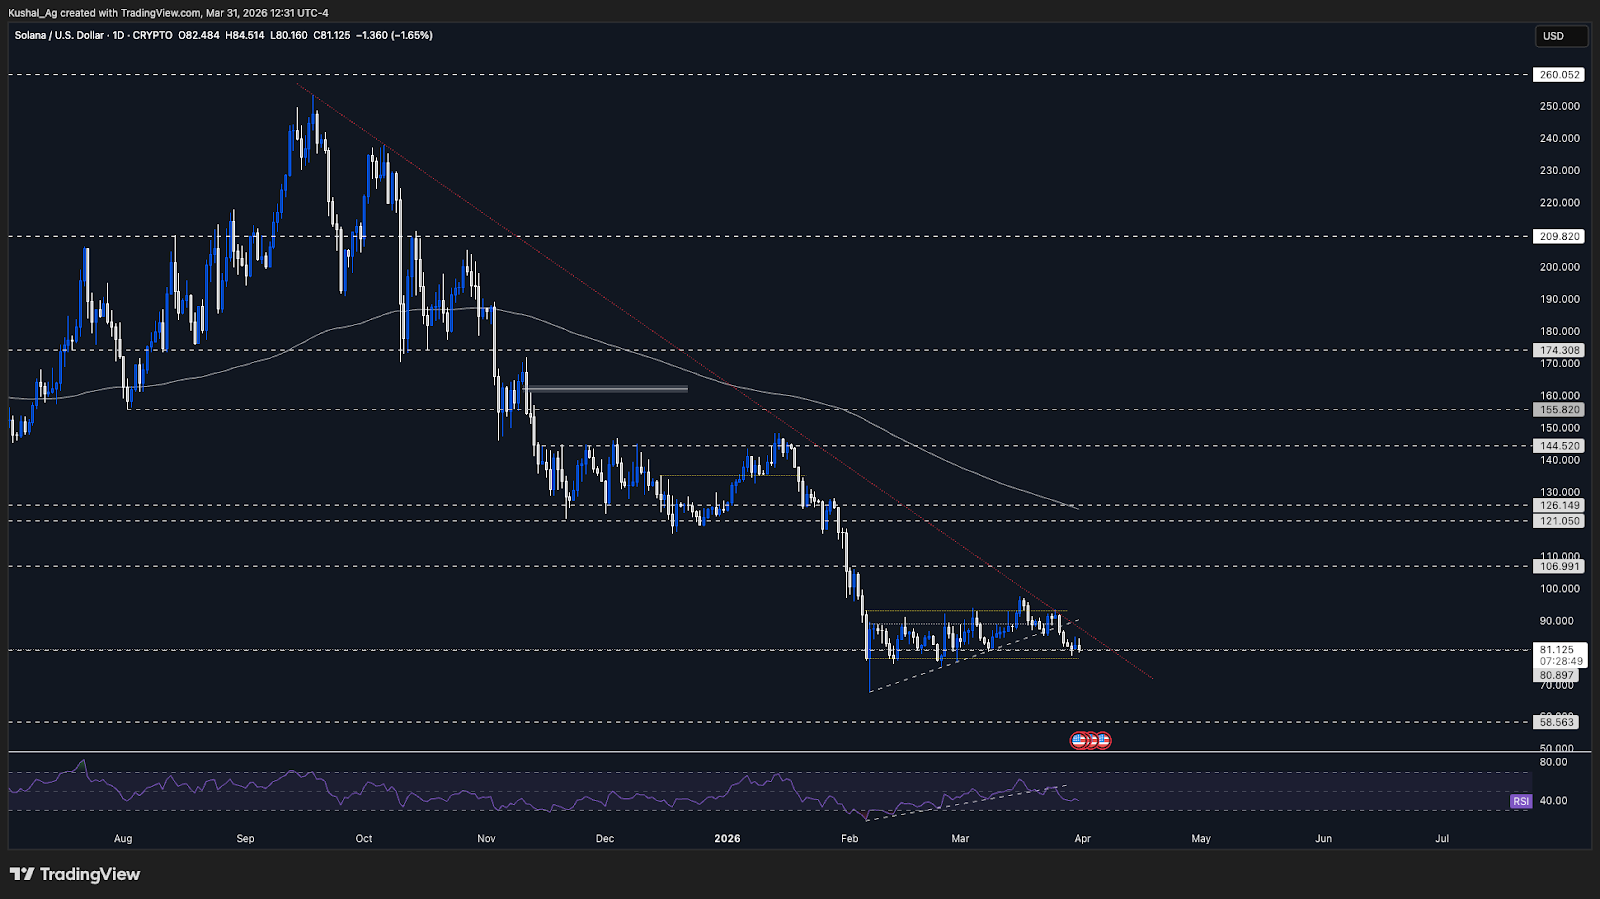
Key Levels:
- Support: $80.89 & $78
- Resistance: $89
- Direction: Neutral
- Upside Target: $89 & $100
- Downside Target: $70 & $67.8
Cryptonary’s Take:
Solana has now completed its initial downside move into key support, and the reaction from this region justifies a shift back to a neutral stance. The market is no longer in a clean trending phase and is now entering a decision zone.If support continues to hold, we can expect sideways consolidation or a short-term bounce, similar to what we are seeing across majors. However, the structure still remains fragile.
A break below $78 would quickly shift momentum back to the downside, while holding current levels keeps Solana in a range-bound environment, awaiting the next directional trigger.
Hyperliquid
TAIn the previous analysis, we had pivoted back to a neutral-bearish stance after HYPE retested the daily sell order block, expecting continuation lower. That move has now played out, with price dropping toward the $35.37 support, tapping a low near $35.68.
Currently, price is sitting just above this key support region, and the next move will be defined by how price behaves here. As long as $35.37 is under pressure, the structure continues to lean weak.
The stance remains neutral-bearish, with a break below $35.37 likely to open downside toward $33, which also aligns with the 200 EMA, adding strong confluence to this level.
On the upside, $39.97 remains key resistance, and only a reclaim and sustained move above this level would invalidate the current bearish structure and force a reassessment toward a more neutral or constructive stance.
The 200 EMA is flattening and slightly turning upward near $33, suggesting this region could act as a higher timeframe support zone. RSI has cooled to around 46, indicating weakening momentum after the prior strength.
Chart: Hyperliquid Price Action
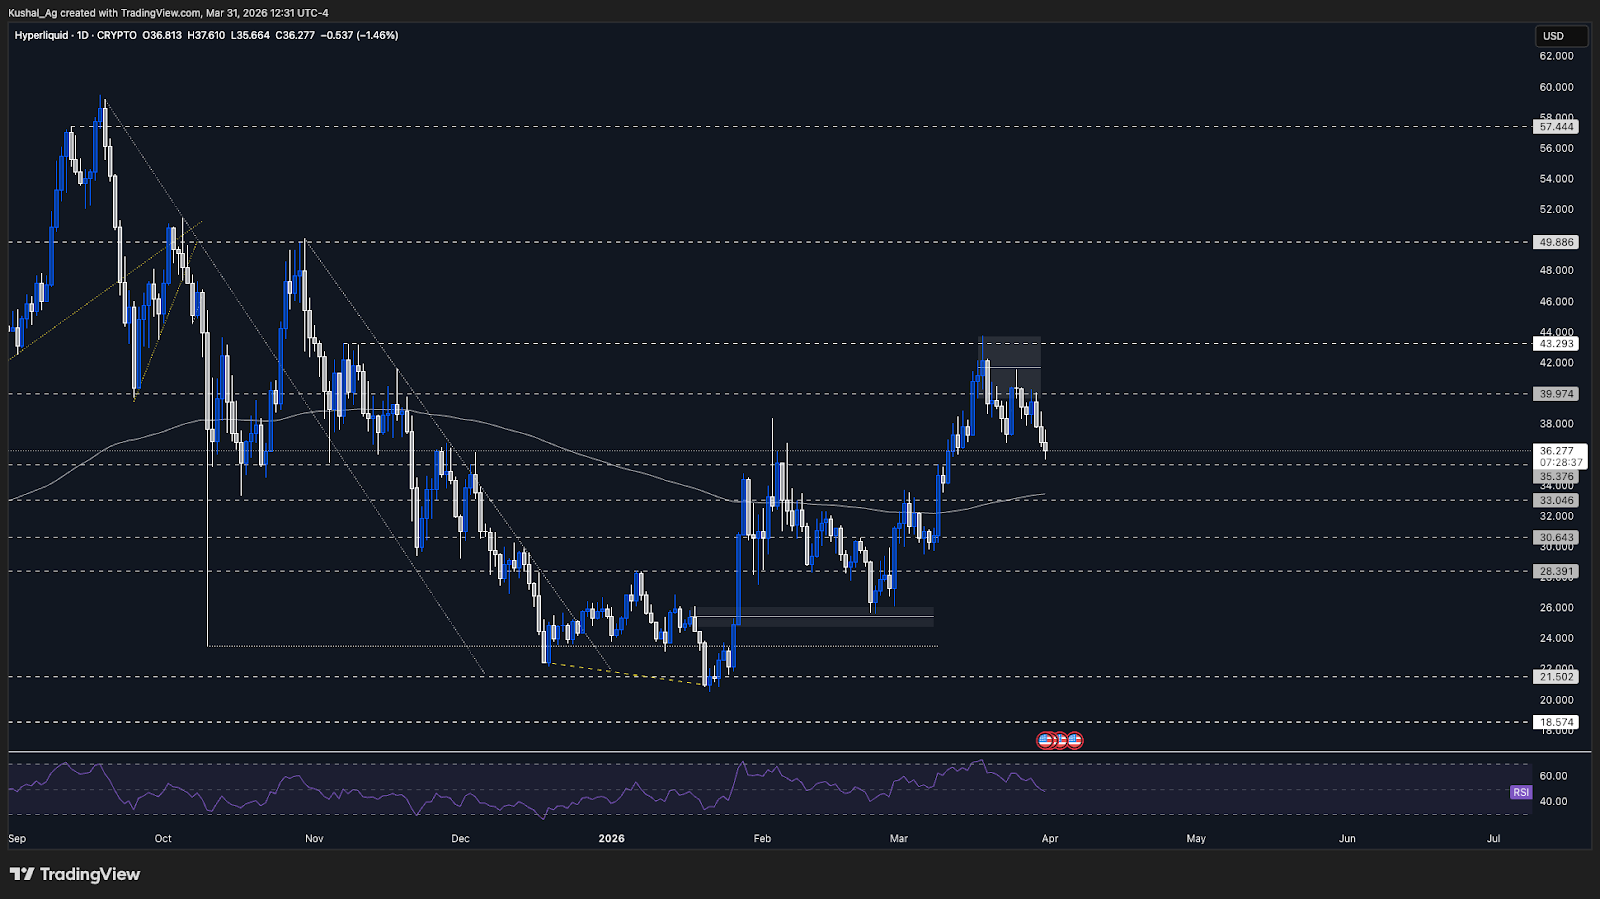
Key Levels:
- Support: $35.37
- Resistance: $39.97
- Direction: Neutral-Bearish
- Upside Target: $43.29
- Downside Target: $33
Cryptonary’s Take:
Hyperliquid continues to show relative weakness compared to the broader market, with the downside move playing out as expected after the order block rejection. Price is now at a critical support zone, where either stabilization or continuation will be decided.If $35.37 fails, the move toward $33 (200 EMA) becomes highly likely, and that region will be key for any potential base formation. Until then, the bias remains to the downside. Any short-term bounce is likely to be corrective unless $39.97 is reclaimed, keeping the overall stance neutral-bearish for now.
Aura
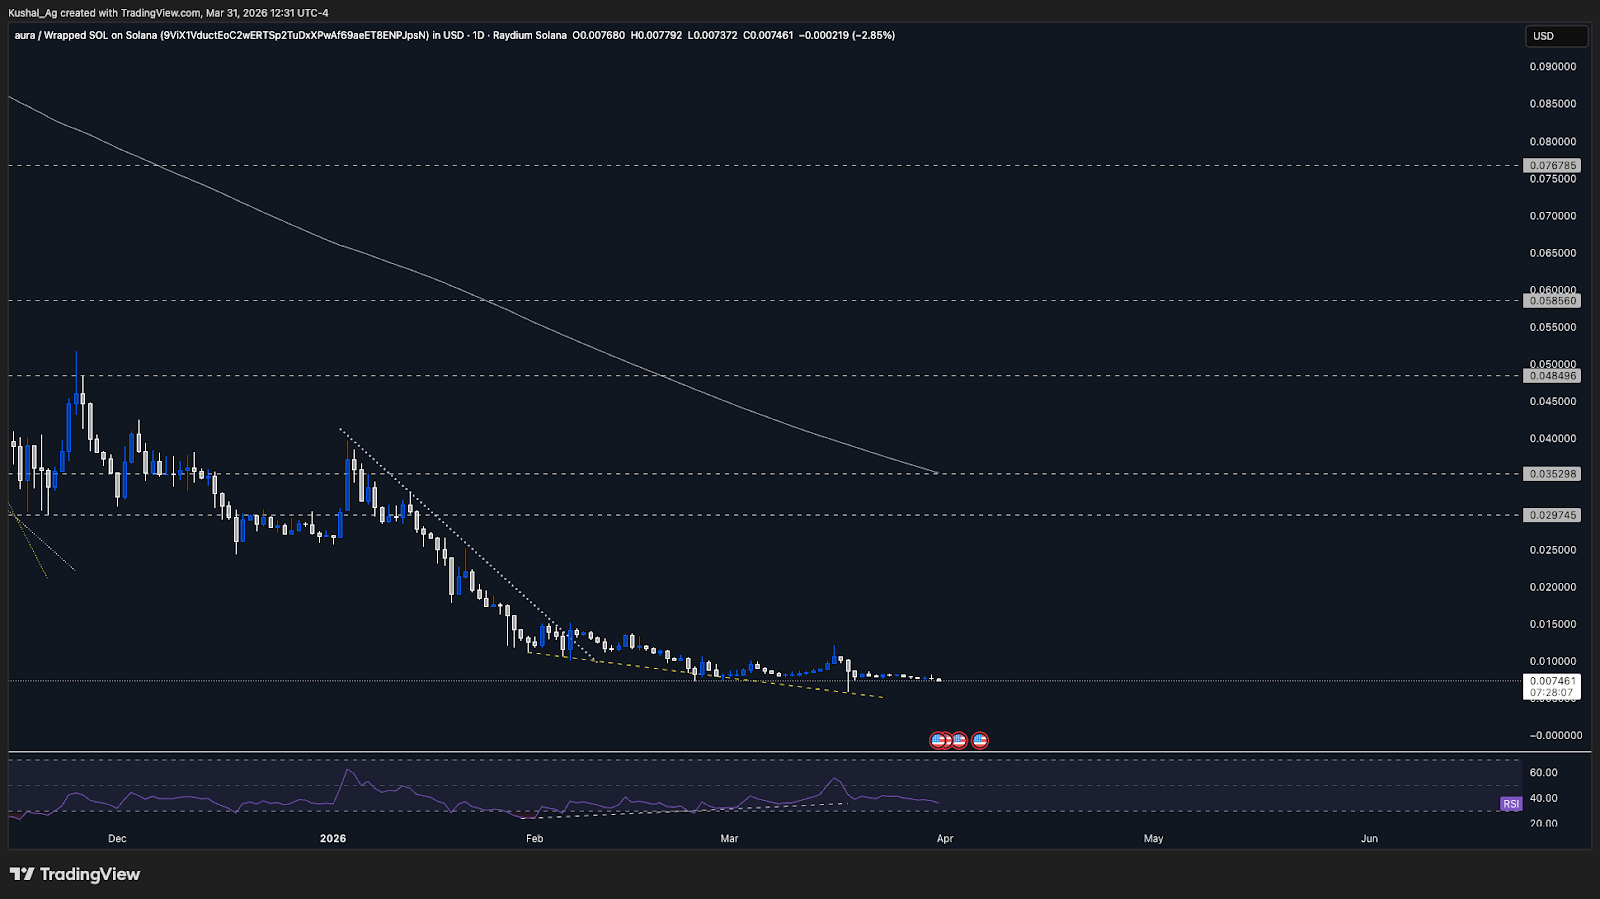
TAAura continues to trade within its broader consolidation range, with no meaningful structural changes over the past few weeks. Price action remains flat and low in volatility, indicating a lack of participation currently.
Momentum continues to stay weak, with RSI hovering around 36, reflecting sustained downside pressure and absence of strong buying interest.
The 200 EMA is still trending downward near 0.035, reinforcing the broader weak structure. Direction for Aura remains highly dependent on Solana and overall market strength.
Chart: Aura Price Action
Cryptonary’s Take:
Aura remains a passive asset in the current environment, with structure largely unchanged and momentum still weak. The lack of volatility and participation suggests that the market is waiting for a broader trigger, primarily from Solana. Until we see strength return in Solana and the wider market, Aura is likely to continue sideways consolidation with limited upside.Stablecoin Dominance (USDT.D + USDC.D)
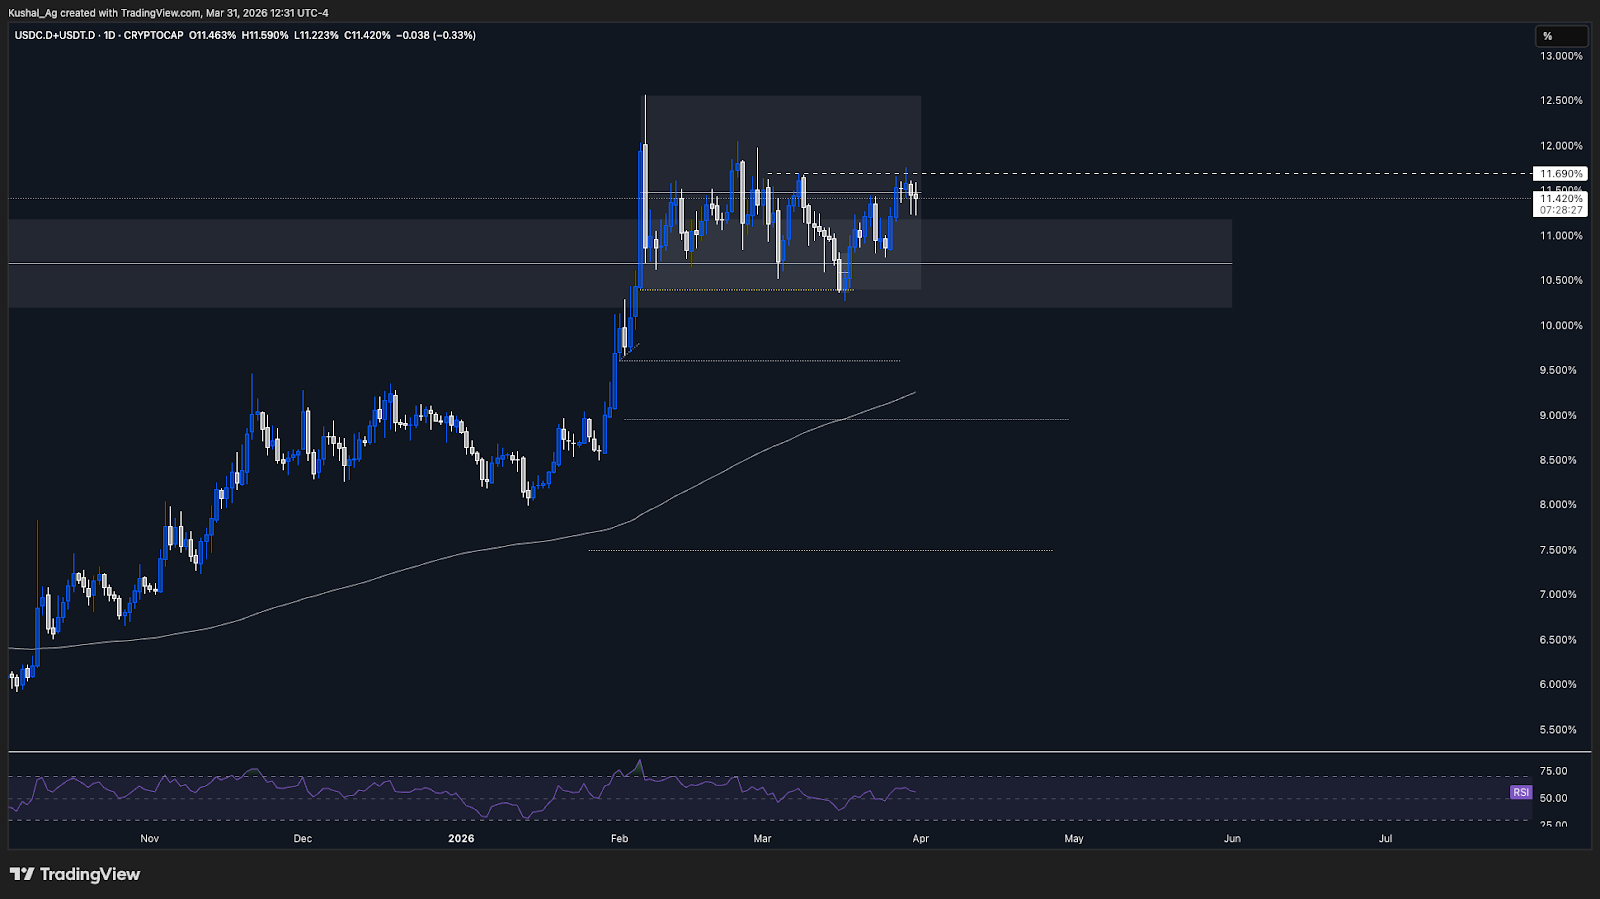
TAStablecoin dominance has now tapped the 11.69% level, which we had identified as a key decision zone, and is currently showing early signs of rejection from that region. The reaction from 11.69% is important, as this level has acted as a local resistance, and the initial rejection aligns with the broader crypto market finding short-term support.
As long as 11.69% continues to hold as resistance, we could see a short-term pullback in dominance, potentially toward 11% & 10.7%, which would support a relief bounce in crypto prices.
However, the broader structure remains range-bound, with dominance trading between 10.39% (support) and 12.57% (resistance), keeping the market in a non-directional environment overall. The mid-range around 11.48% is also acting as an important pivot, with current price hovering near this region, reinforcing the idea of indecision within the range.
A clean breakout above 11.69% would invalidate the rejection and open continuation toward 12.57%, which would likely translate into renewed downside pressure across crypto. On the flip side, continued rejection and drift lower would indicate temporary easing in financial pressure, allowing risk assets to stabilize or bounce in the short term.
The key structural shift only comes below 10.39%, which would confirm a breakdown in dominance and signal a stronger risk-on environment for crypto markets. Until that happens, the current movement remains range-bound, with short-term fluctuations and no confirmed macro trend shift.
Chart: Stablecoin Dominance
Cryptonary’s Take:
Stablecoin dominance continues to act as a leading indicator for crypto direction, and the reaction from 11.69% is currently the most important signal in the market. The rejection from this level has already started to reflect in crypto finding short-term support, reinforcing the inverse relationship.However, this is still a range environment, not a confirmed shift. As long as dominance stays within 10.39%-12.57%, the market will likely remain choppy and reactive.
The next decisive move will come from either a break above 11.69% (risk-off continuation) or a rejection and drift lower (short-term relief for crypto). A true structural shift only comes below 10.39%, and until that level is broken, the broader environment remains cautious with intermittent relief.
Closing Thoughts
We’ve remained very dynamic with our stance and directional bias across majors, and that has been necessary given the choppy, range-bound conditions in the market. Most of the short-term directional moves we’ve outlined have played out accurately, and with price now holding key supports for the past few sessions, we have reassessed our stance once again. As things stand, the base case is consolidation at current levels. However, if these supports continue to hold, the 3-day timeframe setups on Bitcoin and Ethereum leave room for a short-term move toward upside liquidity.This is why we’ve pivoted to a neutral stance on Bitcoin, Ethereum, and Solana, while Hyperliquid remains neutral-bearish given its relative weakness and structure. The key driver to watch remains stablecoin dominance at 11.69%, which is currently acting as a pivot. A break above this level would likely trigger broader downside across crypto, while continued rejection from this region could allow for short-term relief across majors.
For now, the framework is clear, support levels are the invalidation. As long as they hold, we allow for consolidation and potential short-term upside. A break below these supports on the daily timeframe would shift the market back toward a neutral-bearish outlook, with downside targets coming back into play.
Continue reading by joining Cryptonary Pro
$1,548 $1,197/year
Get everything you need to actively manage your portfolio and stay ahead. Ideal for investors seeking regular guidance and access to tools that help make informed decisions.
For your security, all orders are processed on a secured server.
As a Cryptonary Pro subscriber, you also get:
3X Value Guarantee - If cumulative documented upside does not reach 300% during your 12-month membership, you can request a full refund. Terms
24/7 access to experts with 50+ years’ experience
All of our top token picks for 2025
On hand technical analysis on any token of your choice
Weekly livestreams & ask us anything with the team
Daily insights on Macro, Mechanics, and On-chain
Curated list of top upcoming airdrops (free money)
3X Value Guarantee
If cumulative documented upside does not reach 300% during your 12-month membership, you can request a full refund.
Our track record speaks for itself
With over 2.4M tokens and widespread misinformation in crypto, we cut through the noise and consistently find winning assets.
Our track record speaks for itself
With over 2.4M tokens and widespread misinformation in crypto, we cut
through the noise and consistently find winning assets.


Frequently Asked Questions
Can I trust Cryptonary's calls?
Yes. We've consistently identified winners across multiple cycles. Bitcoin under $1,000, Ethereum under $70, Solana under $10, WIF from $0.003 to $5, PopCat from $0.004 to $2, SPX blasting past $1.70, and our latest pick has already 200X'd since June 2025. Everything is timestamped and public record.
Do I need to be an experienced trader or investor to benefit?
No. When we founded Cryptonary in 2017 the market was new to everyone. We intentionally created content that was easy to understand and actionable. That foundational principle is the crux of Cryptonary. Taking complex ideas and opportunities and presenting them in a way a 10 year old could understand.
What makes Cryptonary different from free crypto content on YouTube or Twitter?
Signal vs noise. We filter out 99.9% of garbage projects, provide data backed analysis, and have a proven track record of finding winners. Not to mention since Cryptonary's inception in 2017 we have never taken investment, sponsorship or partnership. Compare this to pretty much everyone else, no track record, and a long list of partnerships that cloud judgements.
Why is there no trial or refund policy?
We share highly sensitive, time-critical research. Once it's out, it can't be "returned." That's why membership is annual only. Crypto success takes time and commitment. If someone is not willing to invest 12 months into their future, there is no place for them at Cryptonary.
Do I get direct access to the Cryptonary team?
Yes. You will have 24/7 to the team that bought you BTC at $1,000, ETH at $70, and SOL at $10. Through our community chats, live Q&As, and member only channels, you can ask questions and interact directly with the team. Our team has over 50 years of combined experience which you can tap into every single day.
How often is content updated?
Daily. We provide real-time updates, weekly reports, emergency alerts, and live Q&As when the markets move fast. In crypto, the market moves fast, in Cryptonary, we move faster.
How does the 3X Value Guarantee work?
We stand behind the value of our research. If the documented upside from our published research during your 12-month membership does not exceed three times (3X) the annual subscription cost, you can request a full refund. Historical context: In every completed market cycle since 2017, cumulative documented upside has exceeded 10X this threshold.
TermsRecommended from Cryptonary


