Save 23% ($351) & Get a Free 1-1 Call with our Team ⏰ : 0d 2h 59m 44s
BTC, ETH and More: Stablecoin Dominance Signals Downside
A more fragile backdrop is beginning to show. With the Fed turning less supportive and stablecoin dominance rising, crypto markets are now aligning with a broader risk-off environment as key technical levels break across the board.

Disclaimer: This is not financial or investment advice. You are responsible for any capital-related decisions you make, and only you are accountable for the results.
Quick bridge earlier this week…
Last week, our pivot from a neutral-bullish stance on Bitcoin to neutral proved timely, as price rejected from the highs, broke below $73,800, and moved cleanly to the $70,500 downside target, which has now also been lost. This has led to a further reassessment of Bitcoin’s structure. Ethereum remained neutral and has since rejected from resistance back into support, where the next reaction will be key. Meanwhile, the neutral-bullish structures on Solana and Hyperliquid have invalidated, with Solana shifting back to neutral at support, and Hyperliquid transitioning into a neutral-bearish setup following a breakdown and signs of continued downside pressure.Alongside this, we’ve brought back stablecoin dominance (USDT.D + USDC.D) into focus again in today's MD, as the key levels identified in the previous report played out cleanly and coincided with the broader market move lower. Given its current positioning, stablecoin dominance continues to act as a leading indicator, offering a clearer view on where the overall crypto market could head in the coming sessions.
On the macro side, the latest update highlights a more uncertain Fed outlook, with rate cuts for 2026 being priced out, risk assets reacting negatively post-Fed, and financial conditions tightening further. While Bitcoin has shown relative resilience, the broader backdrop remains unsupportive. For a deeper breakdown of these developments and their implications, refer to today’s market update.
Disclaimer: This content is for informational and educational purposes only. It does not constitute financial advice, and should not be relied upon as a basis for making investment decisions. Virtual assets are volatile and may lose their value in full. Past performance does not indicate future results. Always do your own research.
TLDR
- Risk Posture: Defensive
- Bitcoin: BTC confirmed a breakdown below $73,800 and $70,500, shifting structure lower. The stance is now neutral-bearish, with downside toward $65,650-$62,400 likely unless price reclaims $70,500 and sustains above it.
- Ethereum: ETH rejected cleanly from $2,367 and has returned to the $2,116 support. The stance remains neutral, with a hold of support keeping the range intact, while a breakdown opens downside toward $1,957.
- Solana: SOL lost the $93.2 level and moved into $88-89 support, where it is now stabilizing. The stance is neutral, with sideways action likely unless $88 breaks, which would open downside toward $80.9.
- Hyperliquid: HYPE rejected from $43.29 and lost the $39.97 support, confirming a structural shift. The stance is neutral-bearish, with downside toward $35.37-$33 unless $40 is reclaimed.
- Aura: AURA remains within its broader range despite recent volatility, continuation dependent on renewed strength in Solana.
- USDT.D + USDC.D: Stablecoin dominance has pushed higher from key levels and is holding above 11%. This supports continued downside pressure on crypto, with further upside likely unless dominance breaks back below 10.39%.
Bitcoin
TABitcoins PA played out cleanly from the previous analysis, where we pivoted from neutral-bullish to neutral, anticipating rejection from the highs, which is what the price delivered. The failure to sustain above resistance was quickly met with selling pressure, confirming weakness at higher levels.
The break below $73,800 acted as the key trigger, and price moved swiftly toward the $70,500 level, which was our downside target. This level has now also been lost, indicating that the market is accepting lower prices and shifting into a weaker structure.
With $70,500 now flipped into resistance, Bitcoin is currently trading below a key breakdown level. As long as price remains below this region, the structure supports continued downside pressure. Only if price is able to reclaim $70,500 and sustain above it for a few sessions, we will reassess our neutral-bearish stance.
On the downside, the next key level to watch is $65,650, which now acts as the primary support and first downside target. A break below this would open up further downside toward $62,400, marking the next major liquidity zone.
The 200 EMA continues to slope downward near $87,000, reflecting broader structural weakness. RSI is hovering around 50, indicating neutral momentum, but price structure remains the dominant factor here, and that currently leans bearish.
Key Levels:
- Support: $65,650
- Resistance: $70,500
- Direction: Neutral-Bearish
- Upside Target: $73,800
- Downside Target: $65,650 & $62,400
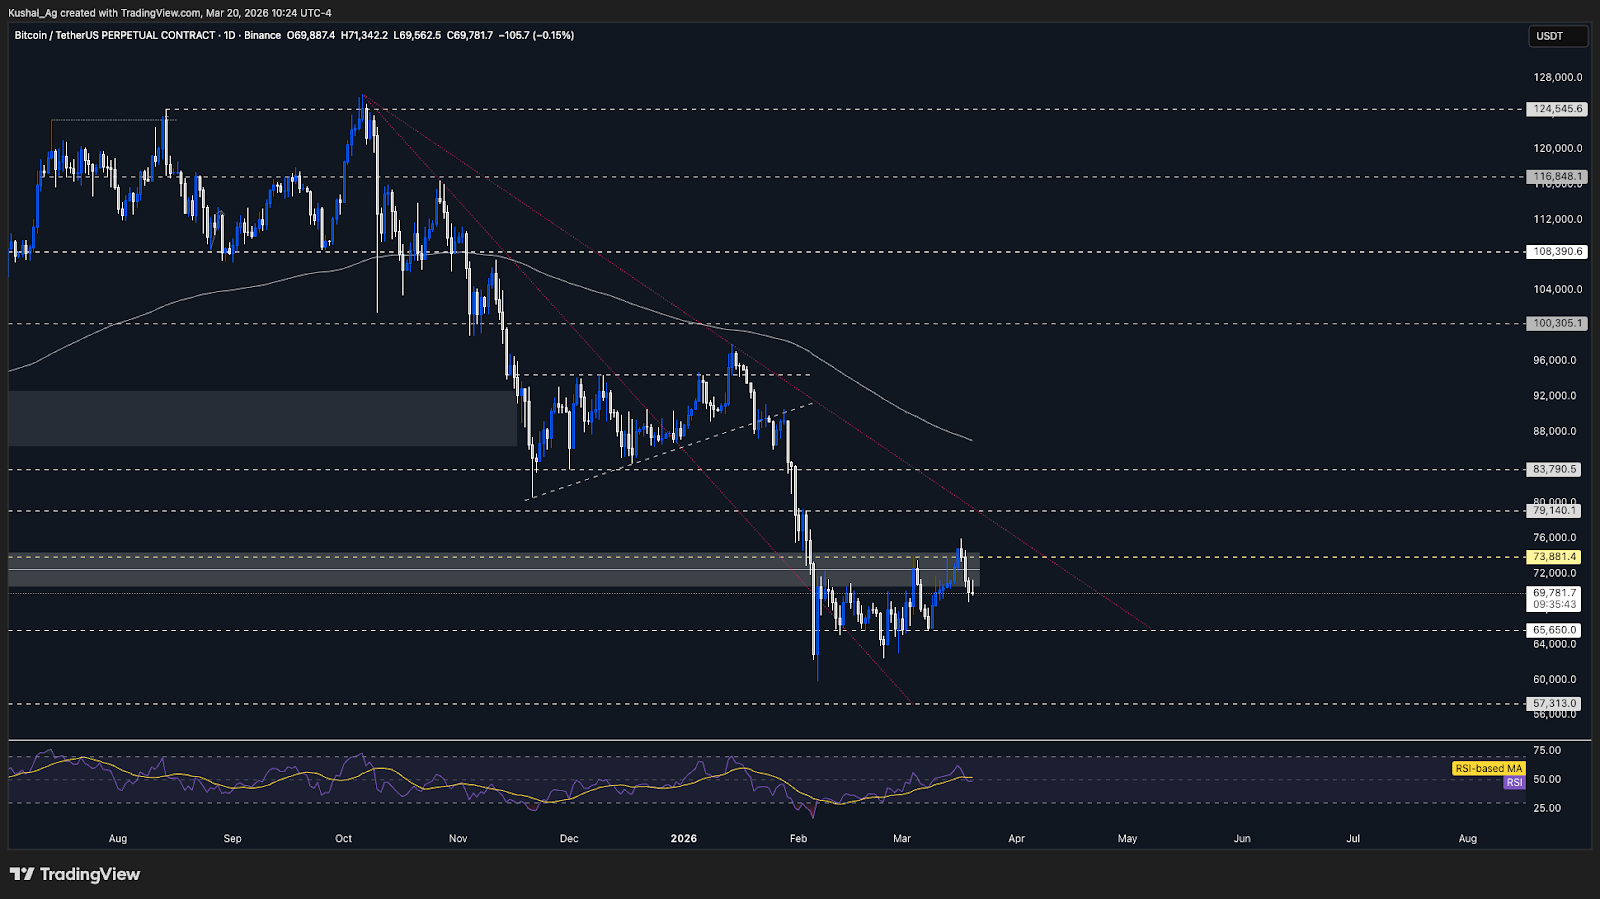
Cryptonary’s Take:
The rejection from the highs and the clean breakdown below both $73,800 and $70,500 confirms that Bitcoin is currently in a corrective phase. The move lower has been efficient, with key levels giving way without much support, which typically suggests continuation.As long as price remains below $70,500, the path of least resistance is to the downside, with $65,650 as the next key level to watch. However, if Bitcoin is able to reclaim $70,500 in the current or next session and sustain above it, we could see short-term stabilization or a relief move, potentially shifting price into a choppy consolidation phase The $68,500 region acts as an important intermediate support, and holding this level followed by a reclaim of $70,500 would weaken the immediate bearish momentum.
Bitcoin's RSI is currently right at its uptrend trendline, and this becomes a key trigger to monitor. A break below the RSI uptrend would likely align with further downside in price, reinforcing the move toward lower levels. Overall, rejection from current levels remains key for the neutral-bearish stance to play out, while reclaim scenarios would delay or phase out immediate downside continuation.
Ethereum
TAIn the previous analysis, Ethereum was trading at the $2,367 resistance zone, where we highlighted the possibility of rejection, price failed to break through resistance and has since rolled over back toward support, confirming the range-bound structure.
The $2,116 support region continues to act as a key demand zone for which was previously a strong resistance. Given the broader structure, it was not ideal to turn bullish at resistance, and similarly, it is not optimal to turn bearish at support, keeping the stance neutral for now.
As long as $2,116 holds, Ethereum remains within its established range and could see a short-term bounce from current levels. However, if we see a clean breakdown below $2,116, it would signal acceptance of lower prices and likely shift momentum toward the downside.
A confirmed loss of this level would lead us to pivot from neutral to neutral-bearish, with the next downside target coming in at $1,957. This would align Ethereum more closely with Bitcoin’s current weakness and broader market pressure.
The 200 EMA is hovering near $2.815, while RSI sits around 53 with average at 52, indicating neutral momentum, reinforcing the range-bound nature of the asset.
Key Levels:
- Support: $2,116
- Resistance: $2,367
- Direction: Neutral
- Upside Target: $2,500
- Downside Target: $1,957
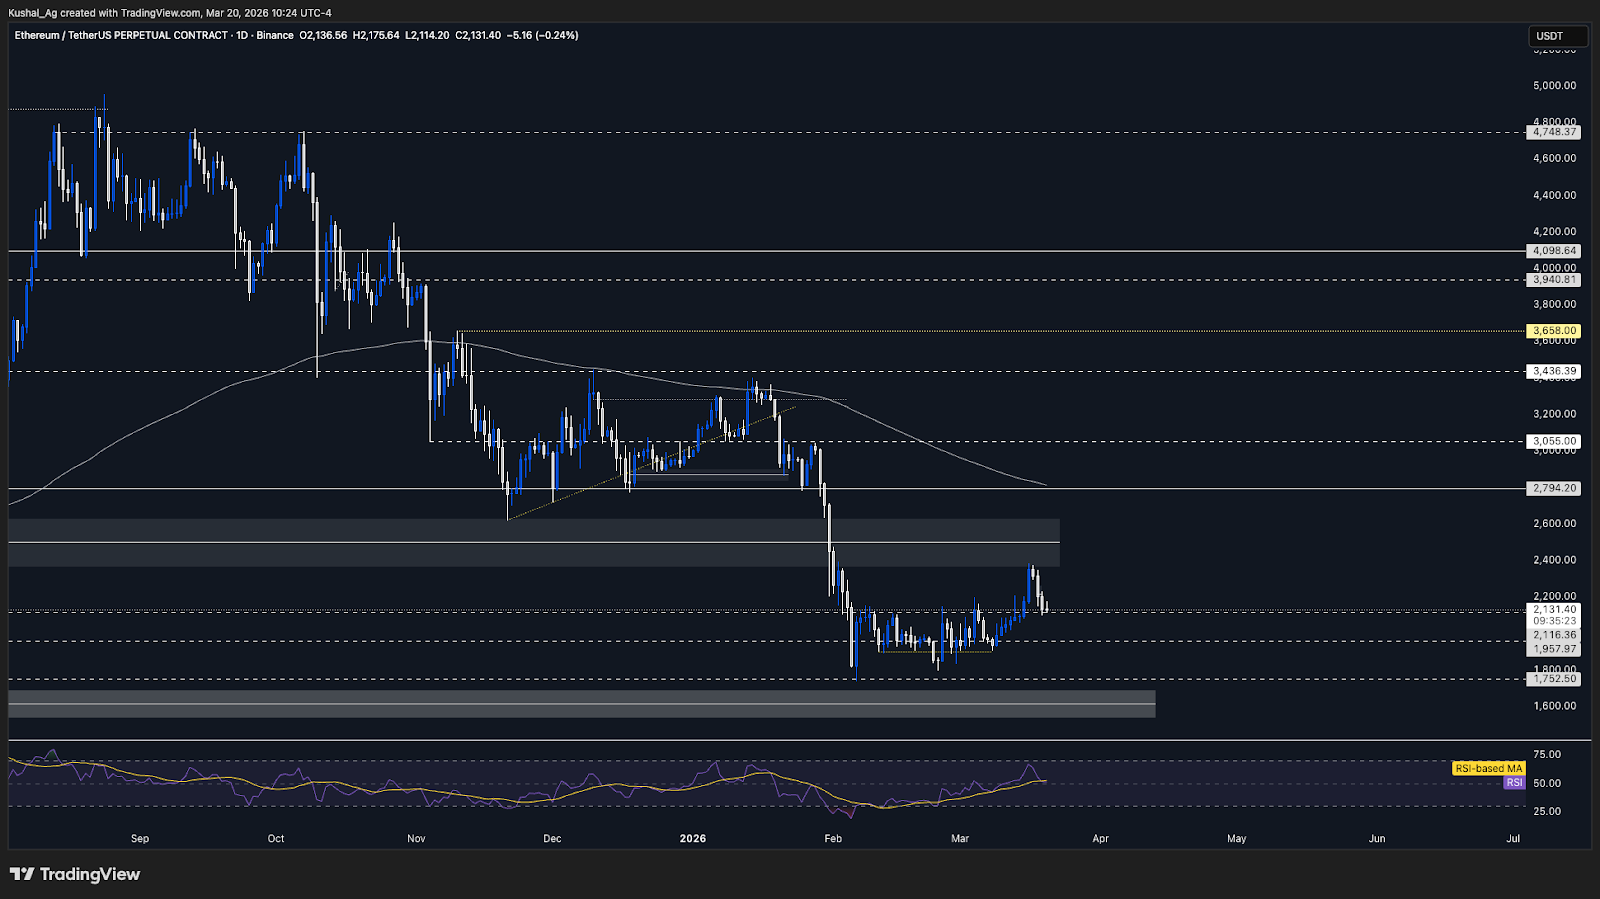
Cryptonary’s Take:
Ethereum continues to trade within a range, price is respecting both resistance and support levels for now. The recent rejection from $2,367 and move back to $2,116 reinforces that the market is still lacking a clear directional bias.For now, the focus is on how price reacts at support. A hold above $2,116 keeps the range intact and allows for potential short-term upside, but a break below this level would likely trigger a shift toward a more bearish structure, opening up downside toward the $1,900 region.
Solana
TAWe maintained a neutral-bullish stance on Solana previously as long as it held the $93.2 support, but that level was eventually lost, invalidating the structure and our thesis. Following the breakdown, the price moved to the $88-$89 region, which was our downside target.
Since then, Solana has tried to put a base around $88-$89, with this zone now acting as a key support region.
With the price now sitting at support, we shift our stance back to neutral, as it is not ideal to chase shorts into support. As long as $89 holds, Solana may see sideways consolidation.
However, if Solana sees a clean daily close below $89, it would indicate further weakness and lead us to pivot toward a neutral-bearish stance, targeting the next downside level at $80.9.
The 200 EMA continues to slope downward near $129, reflecting broader structural weakness, while RSI is around 50 and average at 50, indicating completely neutral momentum, aligning with the current range-bound setup.
Key Levels:
- Support: $89
- Resistance: $93.2
- Direction: Neutral
- Upside Target: $100
- Downside Target: $80.9
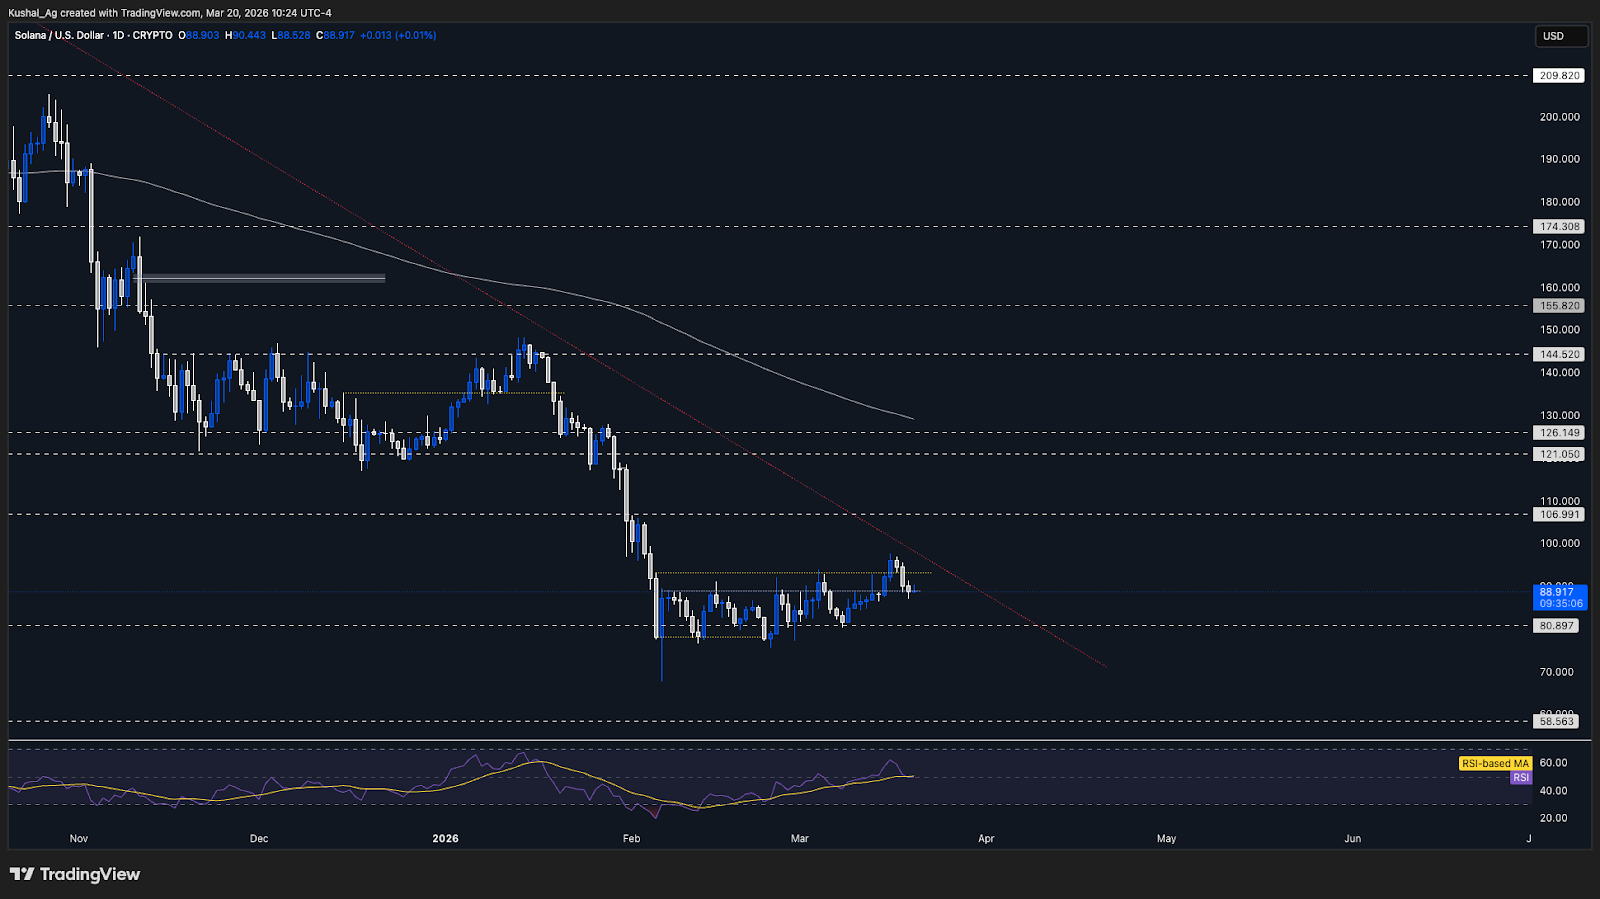
Cryptonary’s Take:
Solana is currently sitting at a decision point, with price holding at a key support zone after a clean breakdown from higher levels. The reaction around $89 will be critical in determining whether this becomes a base for consolidation or a continuation lower.For now, the structure does not justify directional conviction. A hold above support keeps the market range-bound, while a break below would likely accelerate downside toward the low $80s. Until that confirmation appears, a neutral stance remains the most appropriate approach.
An important thing to note is that Solana’s RSI is in a similar position to Bitcoin, currently sitting right at its uptrend line. This makes it a key level to watch, as long as the RSI holds this trend, the price can remain stable or consolidate. However, a break below the RSI uptrend would likely signal weakening momentum and could lead to further downside in price, aligning with a potential continuation lower.
Hyperliquid
TAIn the previous analysis, we were looking for Hyperliquid to hold the $39.97 support and move toward the $43.29 resistance, with a potential breakout opening upside toward $49.8. Since then, HYPE took support at $39.97 and moved into the $43.29 resistance zone.
However, at $43.29, price failed to break through and instead showed sharp rejection, indicating exhaustion at higher levels. This rejection marked the first sign of weakness after the prior rally.
Following this, Hyperliquid also broke below the $39.97 support, confirming a shift in structure. With both rejection from resistance and loss of support, we now pivot from neutral-bullish to neutral-bearish.
On the downside, the next key level to watch is $35.37, which acts as immediate support. A break below this would open up further downside toward $33, aligning with the next major liquidity zone.
The 200 EMA sits around $32.8, close to the downside targets, reinforcing the probability of a deeper retracement. RSI has cooled from 73 to 62 with an average at 64, suggesting momentum is fading and allowing room for further downside.
Key Levels:
- Support: $35.37
- Resistance: $39.97
- Direction: Neutral-Bearish
- Upside Target: $43.29
- Downside Target: $33
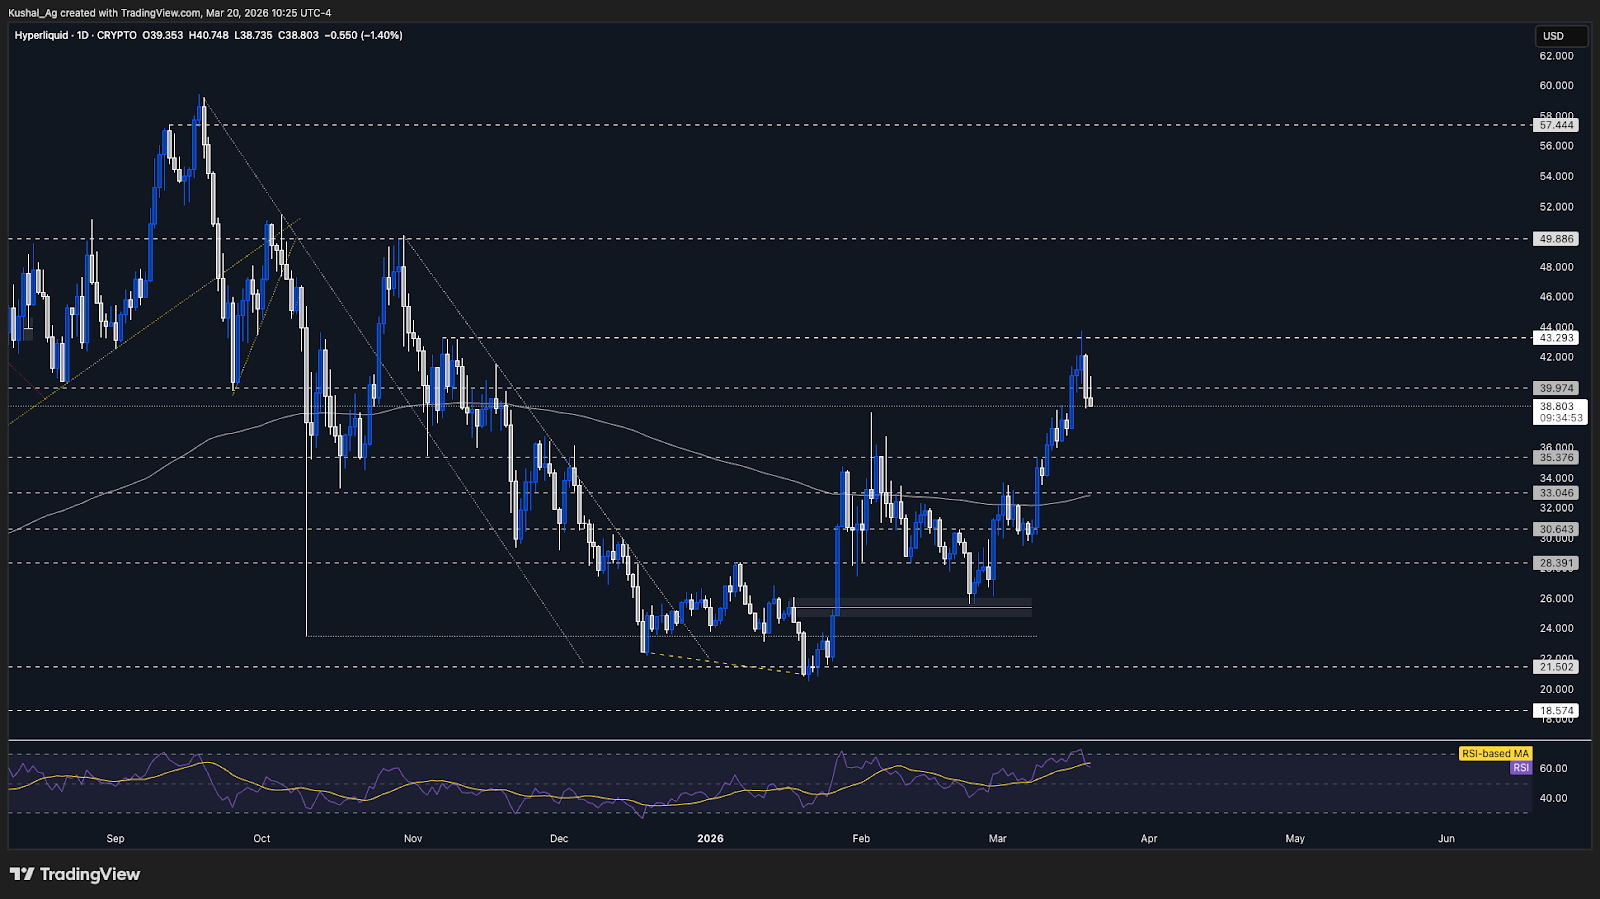
Cryptonary’s Take:
Hyperliquid has transitioned into a corrective phase after completing its prior move. The rejection from $43.29, combined with the loss of $39.97, confirms that the short-term structure has weakened.As long as the price remains below $40, the bias remains tilted toward further downside, with $35.37 and $33 acting as key zones to watch. The reaction near these levels, especially around the 200 EMA, will determine whether this is a controlled pullback or the start of a deeper correction.
AURA
TAPrice action has seen a few volatile sessions with wide swings, but the overall range structure remains unchanged, indicating no clear directional breakout yet.
With Solana shifting from a neutral-bullish stance back to neutral, AURA is also expected to remain range-bound, with a bias toward sideways, choppy price action in the near term.
The bullish divergence structure remains intact, but momentum has cooled off recently, with RSI pulling back to around 39 with an average at 41, reflecting a loss of strength as price consolidates.
The 200 EMA on the daily timeframe is hovering near 0.038, acting as a key dynamic level. For any meaningful continuation, we would need to see renewed strength led by Solana, which would likely drive higher beta assets like AURA.
AURA Chart:
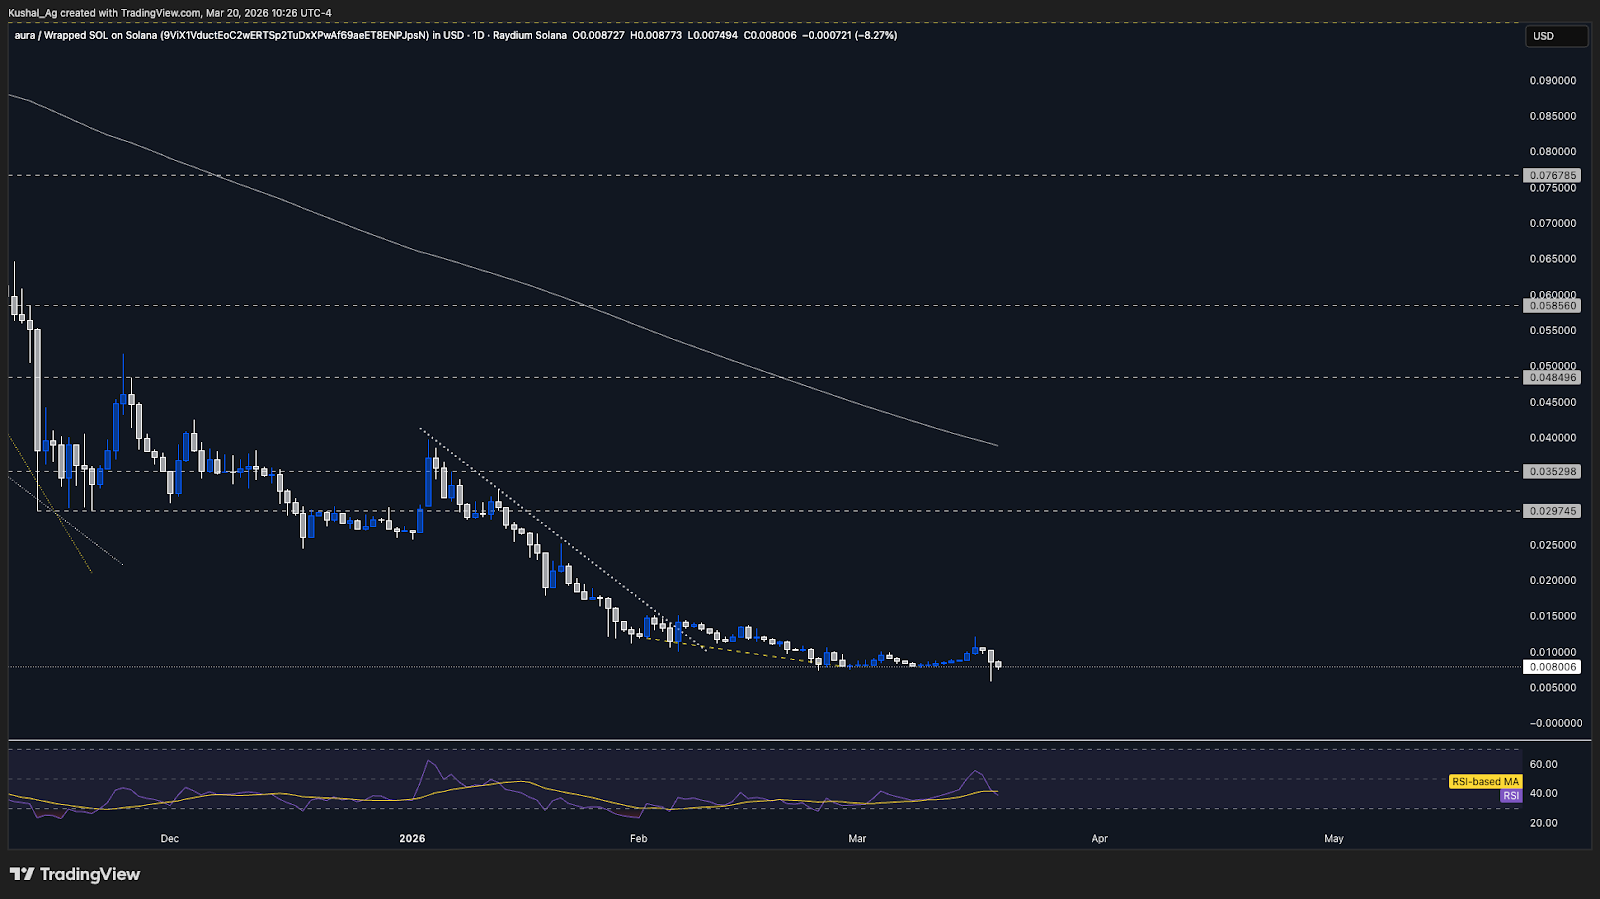
Cryptonary’s Take:
AURA continues to trade within a consolidation phase, with no structural shift despite recent volatility. Momentum has softened, and without clear strength from Solana, the asset is likely to remain range-bound in the short term. A breakout in SOL remains the key trigger for any sustained upside continuation in AURA, making it important to track relative strength across the ecosystem.USDT.D + USDC.D (Stablecoin Dominance)
TAStablecoin dominance previously reacted from the key 10.39% level, which we identified as a critical inflection point, and that move played out cleanly, marking a local top in crypto markets with Bitcoin topping around the $75K-$76K region.
Following that, dominance has seen a strong continuation to the upside with consecutive green candles, confirming a shift toward risk-off positioning, with capital rotating into stablecoins.
Currently, dominance is holding above the 11% region, and as long as this level sustains over the next few sessions, the structure supports further upside toward 11.69%, followed by 12%-12.57% in the short to medium term.
This continued strength in dominance implies persistent downside pressure across crypto assets, given the inverse relationship between stablecoin dominance and crypto price action.
The only invalidation to this view would be a clean breakdown below 10.39%, which would signal a structural shift back toward risk-on conditions and potentially mark the start of a broader recovery in crypto markets.
Stablecoin Dominance Chart:
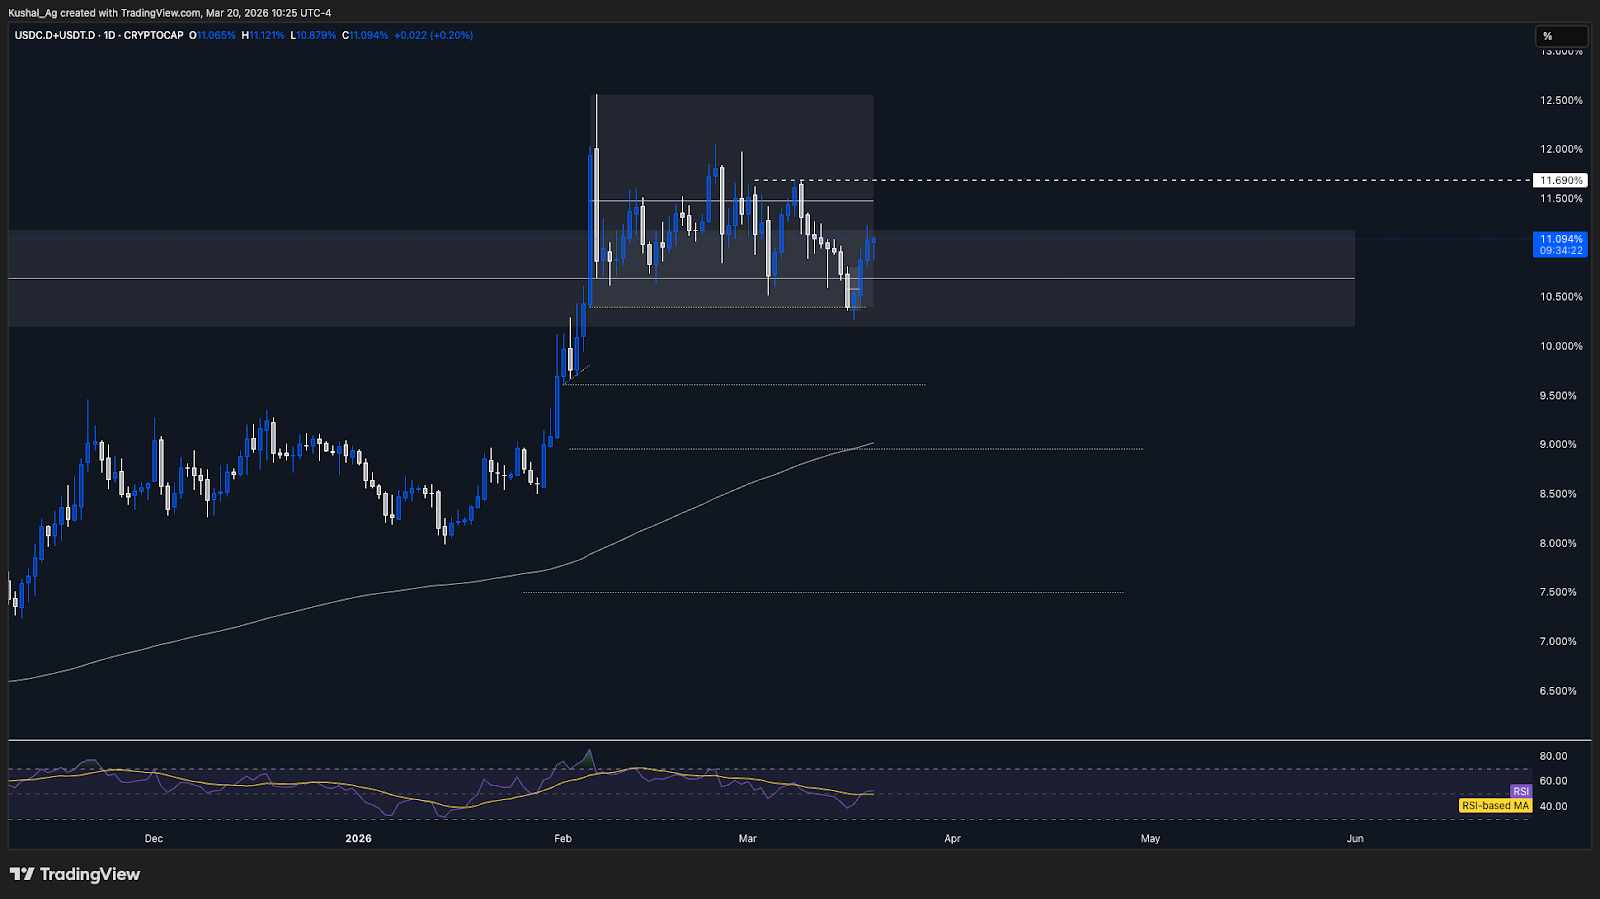
Cryptonary’s Take:
Stablecoin dominance is once again acting as a leading indicator for market direction, and its current strength suggests that the broader crypto market is still in a corrective or risk-off phase. As long as dominance holds above 11%, the probability favors continued pressure on crypto prices in the near term.A sustained move higher toward 11.69% and beyond would likely coincide with further downside across majors, while only a break below 10.39% would signal a meaningful shift in structure. Until that happens, the broader bias remains cautious, with dominance continuing to dictate market tone.
Closing Thoughts
We have pivoted our stance across most of the majors, with Bitcoin now shifting to a neutral-bearish stance after confirming breakdowns below key levels. The focus now moves to $65,650 as the next downside level, as long as the price continues to trade below $70,500. Ethereum, on the other hand, remains neutral, holding at the $2,116 support, but a breakdown below this level would trigger a shift toward a more bearish outlook, targeting $1,957 next.For Solana, the structure remains similar to Ethereum, neutral as long as $88-89 support holds, with the market remaining range-bound in the short term. A confirmed loss of this level would shift the stance to neutral-bearish, opening downside toward $80.9. Hyperliquid has already seen a structural shift, where we’ve pivoted from neutral-bullish to neutral-bearish/bearish, with the focus now on $35.37 as the next key downside level following rejection and support loss.
Stablecoin dominance has played out exactly as expected from the prior analysis and continues to trend higher, reinforcing a risk-off environment. As long as dominance continues to hold strength and push higher, the expectation remains for continued pressure across crypto markets. This remains a key index to track, and we’ll continue to update on it as it provides a clear directional signal for the broader market.
Continue reading by joining Cryptonary Pro
$1,548 $1,197/year
Get everything you need to actively manage your portfolio and stay ahead. Ideal for investors seeking regular guidance and access to tools that help make informed decisions.
For your security, all orders are processed on a secured server.
As a Cryptonary Pro subscriber, you also get:
3X Value Guarantee - If cumulative documented upside does not reach 300% during your 12-month membership, you can request a full refund. Terms
24/7 access to experts with 50+ years’ experience
All of our top token picks for 2025
On hand technical analysis on any token of your choice
Weekly livestreams & ask us anything with the team
Daily insights on Macro, Mechanics, and On-chain
Curated list of top upcoming airdrops (free money)
3X Value Guarantee
If cumulative documented upside does not reach 300% during your 12-month membership, you can request a full refund.
Our track record speaks for itself
With over 2.4M tokens and widespread misinformation in crypto, we cut through the noise and consistently find winning assets.
Our track record speaks for itself
With over 2.4M tokens and widespread misinformation in crypto, we cut
through the noise and consistently find winning assets.


Frequently Asked Questions
Can I trust Cryptonary's calls?
Yes. We've consistently identified winners across multiple cycles. Bitcoin under $1,000, Ethereum under $70, Solana under $10, WIF from $0.003 to $5, PopCat from $0.004 to $2, SPX blasting past $1.70, and our latest pick has already 200X'd since June 2025. Everything is timestamped and public record.
Do I need to be an experienced trader or investor to benefit?
No. When we founded Cryptonary in 2017 the market was new to everyone. We intentionally created content that was easy to understand and actionable. That foundational principle is the crux of Cryptonary. Taking complex ideas and opportunities and presenting them in a way a 10 year old could understand.
What makes Cryptonary different from free crypto content on YouTube or Twitter?
Signal vs noise. We filter out 99.9% of garbage projects, provide data backed analysis, and have a proven track record of finding winners. Not to mention since Cryptonary's inception in 2017 we have never taken investment, sponsorship or partnership. Compare this to pretty much everyone else, no track record, and a long list of partnerships that cloud judgements.
Why is there no trial or refund policy?
We share highly sensitive, time-critical research. Once it's out, it can't be "returned." That's why membership is annual only. Crypto success takes time and commitment. If someone is not willing to invest 12 months into their future, there is no place for them at Cryptonary.
Do I get direct access to the Cryptonary team?
Yes. You will have 24/7 to the team that bought you BTC at $1,000, ETH at $70, and SOL at $10. Through our community chats, live Q&As, and member only channels, you can ask questions and interact directly with the team. Our team has over 50 years of combined experience which you can tap into every single day.
How often is content updated?
Daily. We provide real-time updates, weekly reports, emergency alerts, and live Q&As when the markets move fast. In crypto, the market moves fast, in Cryptonary, we move faster.
How does the 3X Value Guarantee work?
We stand behind the value of our research. If the documented upside from our published research during your 12-month membership does not exceed three times (3X) the annual subscription cost, you can request a full refund. Historical context: In every completed market cycle since 2017, cumulative documented upside has exceeded 10X this threshold.
TermsRecommended from Cryptonary


