Save 23% ($351) & Get a Free 1-1 Call with our Team ⏰ : 0d 2h 59m 43s
BTC, ETH and More: Technical Overview of Key Levels
Ahead of the Fed meeting, the market has compressed into a series of critical support and resistance zones. Last week’s levels held almost perfectly, creating a tighter structure and setting up an important inflection point. This update breaks down the key areas that will guide the next major move.

Disclaimer: This is not financial or investment advice. You are responsible for any capital-related decisions you make, and only you are accountable for the results.
Quick bridge from last week…
Last week, we highlighted that ETH had reclaimed the $3,055 level, BTC was holding the $90,200 region, while SOL and HYPE were leaning toward the downside. Since then, the market has largely respected the broader structure, with each asset reacting cleanly to the levels we mapped out.ETH did sweep below $2,980 but immediately reclaimed $3,055, forming a solid base and confirming that buyers were active below support. SOL moved toward the lower end of its range, tapped the $127 region, and then bounced back to the mid range band. HYPE hit the $28 downside target we have been monitoring for weeks and is now attempting to stabilise at this zone.
Overall, most levels were tested exactly as anticipated, with downside targets for HYPE being hit and ETH validating the reclaim. Today’s analysis will focus on whether these supports can continue to hold and whether momentum can shift back toward the upper ranges.
TLDR
- BTC: BTC is holding above $90,200 and remains capped below $93,150. A breakout reopens $97K-$100K, holding $90.2K keeps structure stable.
- ETH: ETH reclaimed $3,055 and is forming a clean base. As long as it holds this level, bias stays neutral-bullish with eyes on $3,436.
- SOL: SOL remains inside the $126-$144.5 range. $132-$133 midrange support is holding well, needs a reclaim of $144.5 to open $155.8.
- HYPE: HYPE tapped the $28 downside target and is stabilising at the $27-$28.3 support zone. A base here could fuel a bounce, losing it risks $23.5.
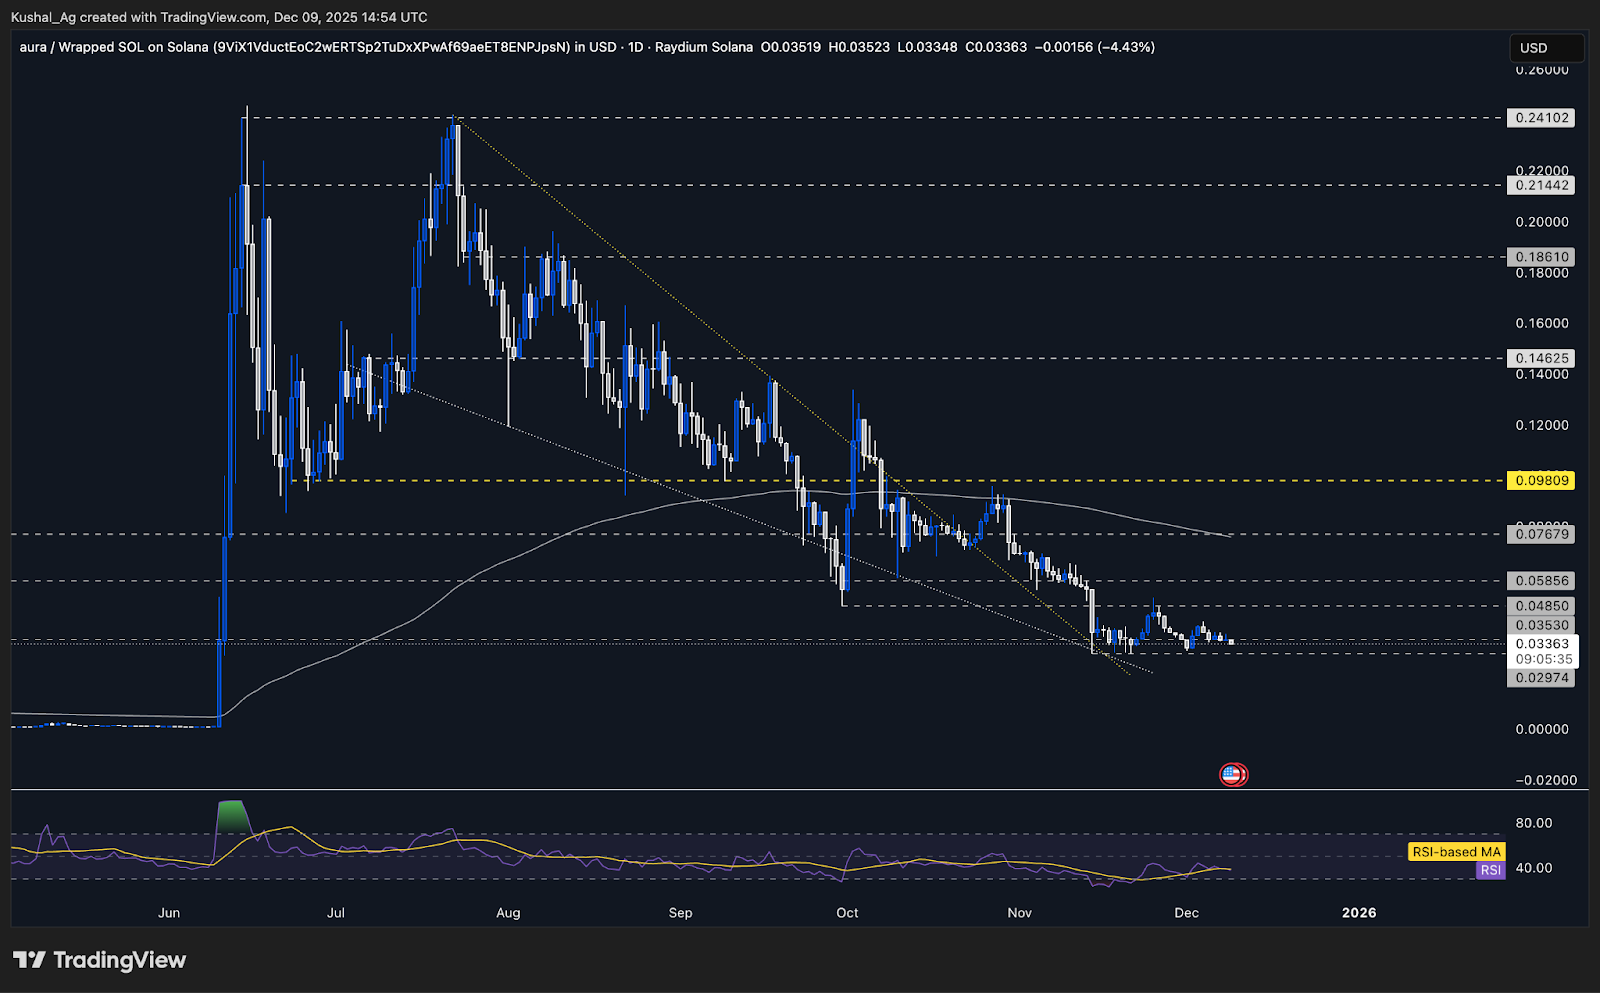
- AURA: AURA continues to base around $0.035-$0.04. Structure unchanged but stable, upside opens only above $0.0485.
BTC
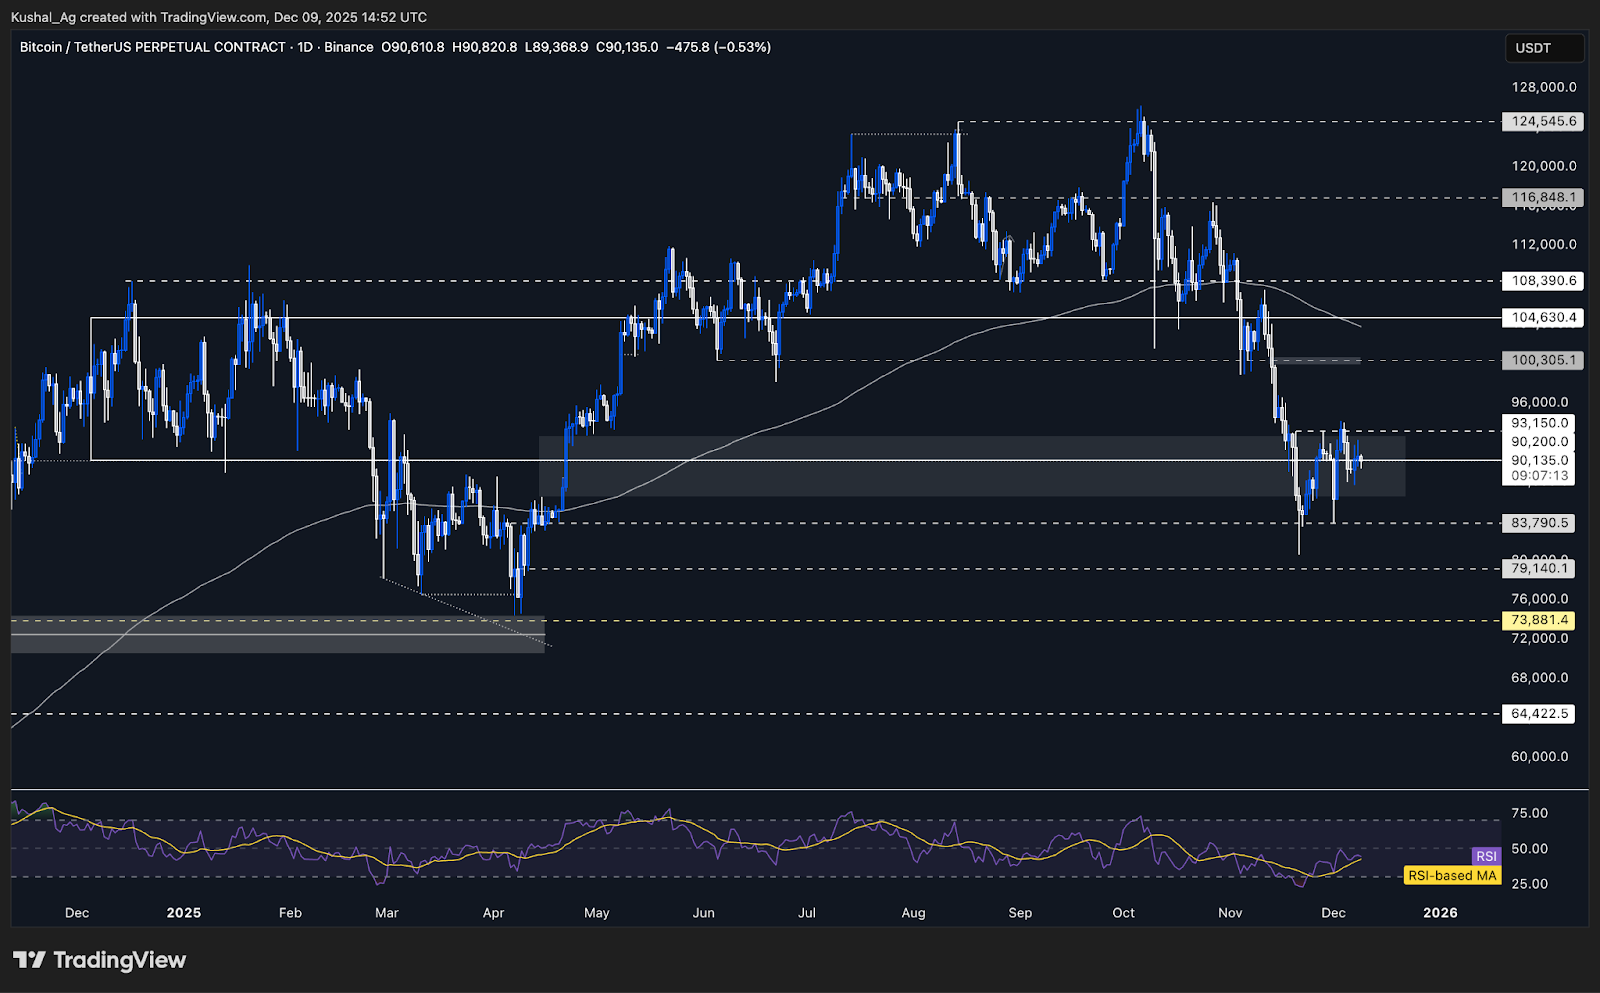
TA:Since the last update, BTC briefly slipped below $90,200, ranged under it, and even took resistance from it, but eventually reclaimed $90,200 as support once again.
BTC is still trading inside the same weekly FVG we highlighted a couple of weeks ago. The top and bottom of this weekly FVG have acted as the wider boundaries of BTC’s structure over the past several days, keeping prices contained within this broader range.
The key resistance remains $93,150, a level that has now been tapped multiple times. Each attempt reduces supply, so the next revisit should face lighter selling pressure compared to before.
A decisive breakout above $93,150 opens the move toward $97,000, followed by the main upside target at $100,300.
The next support remains $86,450. RSI is stabilising around 44 with average at 42, recovering gradually from oversold conditions. The 200 EMA sits near $103,600, still well above price and reflecting a broad reset phase.
Key Levels:
- Next Support: $90,200
- Next Resistance: $93,150
- Direction: Neutral
- Upside Target: $100,300
- Downside Target: $86,450
Cryptonary’s Take:
BTC continues to defend $90,200 and remains inside the weekly FVG range, keeping the broader structure intact. Multiple taps at $93,150 have thinned out sellers at the level, and a clean daily close above it would confirm a shift in momentum and open the way toward $97,000-$100,300.Until that reclaim happens, BTC stays neutral and range bound. Losing $90,200 would expose $86,450 again, but for now the chart remains stable, and BTC continues to hold its higher-timeframe range.
ETH
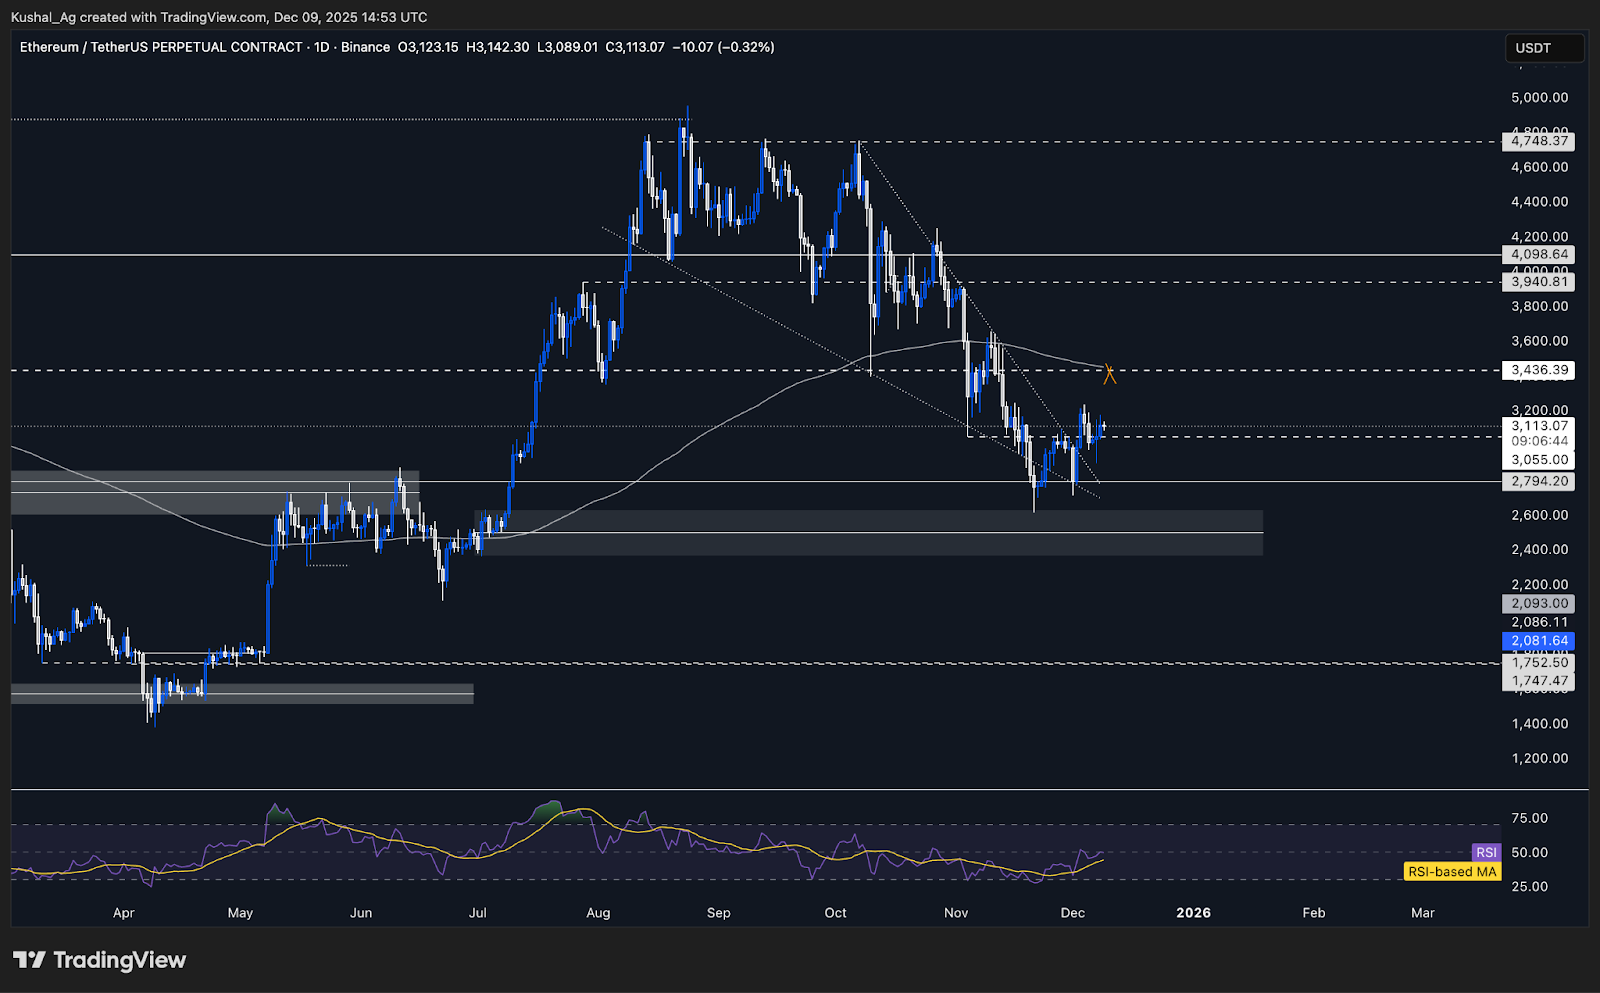
TA:ETH completed the expected retest of $3,055 since the last update, briefly sweeping below $2,980 before reclaiming the level and stabilising above it.
After dipping below $3,055, ETH even took resistance from the level for an entire day, showing active sellers before finally reclaiming it with strength.
ETH has now formed a clean base above $3,055, confirming a solid support flip and keeping price inside the wider range toward $3,436.
The key resistance remains $3,436, aligning tightly with the 200EMA at $3,454, creating a major supply cluster that ETH must break for bullish continuation.
RSI is flattening around 50 with avg around 44, signalling stabilised momentum, any push toward range highs should lift RSI above 50, supporting a healthier upside swing.
Key Levels:
- Next Support: $3,055
- Next Resistance: $3,436
- Direction: Neutral-Bullish
- Upside Target: $3,940
- Downside Target: $2,794
Cryptonary’s Take:
ETH has shown impressive strength after sweeping below $2,980 and reclaiming $3,055 with a clean base. Structure has improved notably, and this is the first convincing support flip ETH has shown in weeks, giving it one of the stronger setups among majors right now.The next major test sits at $3,436-$3,454, where the range high meets the 200EMA. A decisive break and base above this cluster would confirm a broader bullish trend shift and open the path toward $3,900+. As long as $3,055 holds, ETH carries a neutral-bullish bias with decent momentum building underneath.
SOL
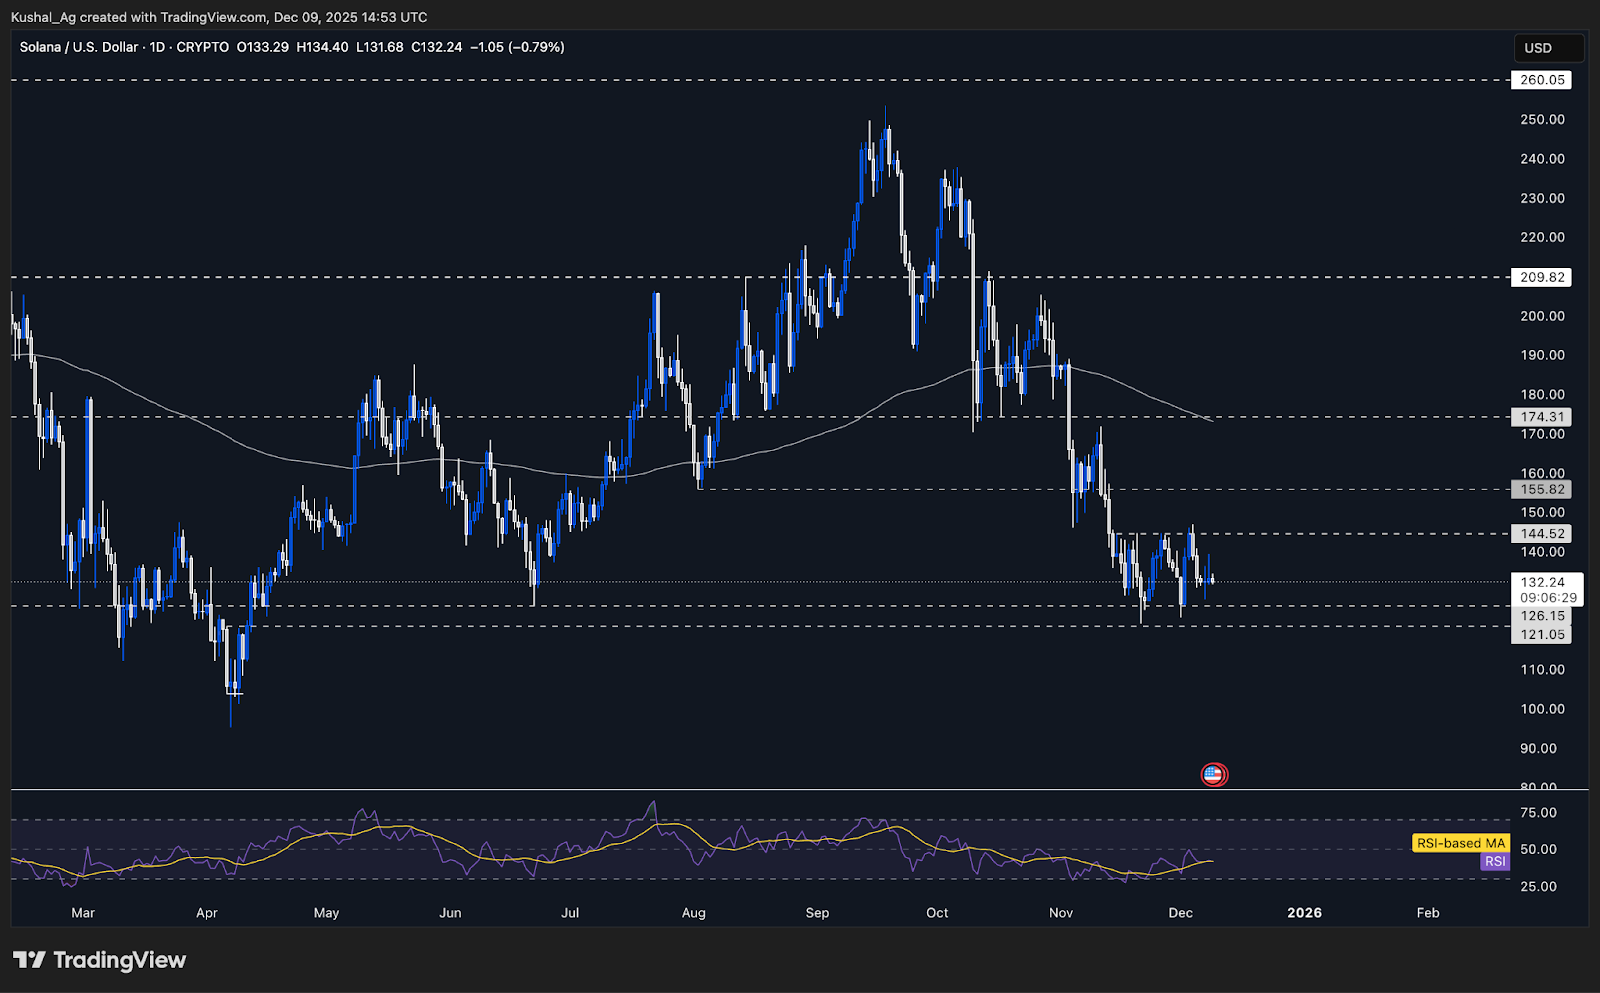
TA:Since the last update, SOL has remained inside the same wider range it has held for nearly 25 days, bounded by $144.5 on the upside and $126.15 on the downside. Price continues to range within the band, with no meaningful breakout attempts in either direction.
In last week’s analysis, we highlighted an intermediate support zone around $132-$133, and SOL has respected this level cleanly. For the last four to five days, SOL has not closed below this region, signalling steady buying interest despite broader market volatility.
Price has consistently closed near $132, showing how compressed the structure has become. This tight clustering of candles reflects a market waiting for a catalyst rather than showing any directional intent.
Momentum remains muted. RSI is flattened around 42 with avg at 42, confirming the lack of trend and the ongoing stabilization between buyers and sellers.
The 200EMA sits near $173, still well above price and overlapping with a major supply cluster. SOL will need multiple structural shifts, including reclaiming $144.5, before the higher-timeframe trend can turn better again.
Key Levels:
- Next Support: $126.15
- Next Resistance: $144.50
- Direction: Neutral
- Upside Target: $155.80
- Downside Target: $121.05
Cryptonary’s Take:
SOL continues to move inside a tight range with no structural advancement since last week. The one notable development is the firmness of the $132-$133 intermediate support, which has held every daily close for multiple sessions. This confirms active buyers in the region, aligning with what we highlighted previously.A reclaim and base above $144.5 remains the trigger for shifting structure toward $155.8. Until then the trend stays neutral, and SOL will likely continue to range within this compression zone.
If ETH continues showing relative strength, SOL may attempt a push toward the range high, but without a confirmed close above $144.5, the broader trend remains unchanged.
HYPE
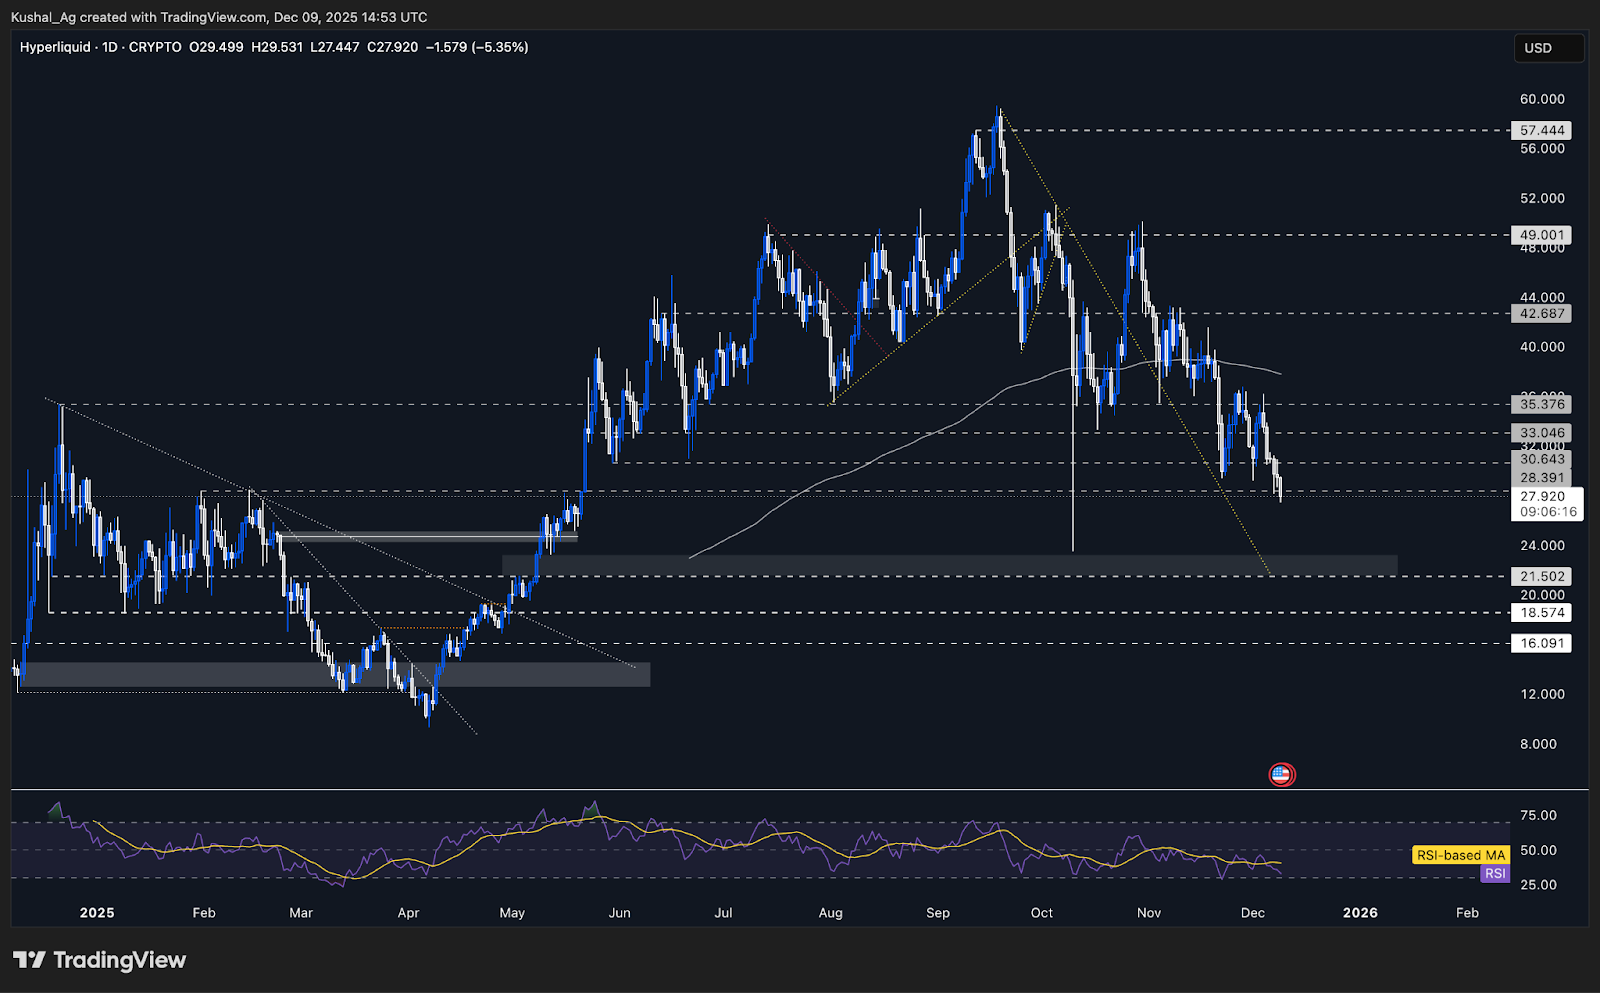
TA:Since the last update, HYPE followed the expected downside path, first tapping the $30.64 support we highlighted, holding it briefly, and then breaking below it to reach the next support at $28.39.
After touching $28.39, price bounced straight back to $30.64, but this time the level acted as resistance, confirming a support to resistance flip. Sellers stepped in cleanly, pushing price back toward the lower end of the range.
HYPE is now hovering around the $28.3 region, with price starting to slip below it during today’s session. The broader support zone stretches from $27 to $28.3, and price is currently sitting at the very bottom of this band.
If this zone fails decisively, the next meaningful level is the 10th October wick fill at $23.5, which becomes the primary downside target on a breakdown.
RSI has pulled back to 32 with avg around 40, leaning into oversold territory, while the 200EMA remains flat near $37.8, reflecting a lack of trend and ongoing supply pressure.
Key Levels:
- Next Support: $27.00-$28.30
- Next Resistance: $30.64
- Direction: Neutral
- Upside Target: $33.00
- Downside Target: $23.50
Cryptonary’s Take:
HYPE is sitting right at its key make or break support zone between $27 and $28.3. This region has held multiple times in the past, and the current price action suggests buyers are still attempting to stabilise it, but the reaction is weak, and structure remains fragile.If HYPE can defend this zone and form a base, it may put in a local low and attempt a move back toward $30.6 and $33. But a clean breakdown below $27 would expose the $23.5 wick fill, which becomes the next major liquidity area.
Our stance remains neutral, with a cautious eye on whether this support can hold. A reclaim of $30.64 would be the first sign of strength, until then, the chart remains vulnerable and reactive to broader market flows.
AURA
TA:AURA continues to trade inside the same accumulative range as last week, holding steady around the $0.035 region.
It has not broken structure and continues to build a base inside this zone. This remains one of the most important areas for medium-term accumulation.
The 200EMA sits much higher, reflecting how extended the retracement has been. A reclaim of the mid range levels will be required before momentum can reconnect with higher timeframe trend structures.
RSI is hovering around 38 with avg around 39, slightly on the weaker side but showing signs of early stabilisation, consistent with a market forming a higher timeframe floor.
- Direction: Neutral/Bullish
- Action Plan: DCA and Raid
Cryptonary’s Take:
AURA remains in a steady accumulation zone, with price action unchanged since last week, which is constructive at these levels. The $0.035 region continues to act as a reliable floor, and as long as this holds, the neutral-bullish outlook remains intact.A break above $0.0485 would be the first meaningful trigger for upward momentum, opening the door toward $0.0585 and eventually the mid range cluster beneath the 200EMA. Until then, the focus remains simple, accumulation, patience, and monitoring for early signs of a structural shift.
Closing Thoughts
BTC continues to defend its weekly FVG, keeping the higher-timeframe structure intact. At the same time, ETH is beginning to set up for potential upside, with the $3,055 reclaim giving it one of the strongest structures in the market right now. If ETH continues to hold this level and push toward the $3,436 region, broader altcoins are likely to pick up momentum alongside it.The FOMC meeting concludes tomorrow, with markets pricing an 87% probability of a 25bp rate cut. A dovish outcome could provide tailwinds for the levels we've outlined, while any hawkish surprise may trigger short term volatility around key support zones.
We are not yet in a bullish confirmation phase, that requires ETH reclaiming $3,500+, but charts across majors now look materially better than they did a week ago. As long as ETH maintains its base above $3,055, a move toward $3,436 remains the base case, and that strength could spill over into the rest of the market.
Continue reading by joining Cryptonary Pro
$1,548 $1,197/year
Get everything you need to actively manage your portfolio and stay ahead. Ideal for investors seeking regular guidance and access to tools that help make informed decisions.
For your security, all orders are processed on a secured server.
As a Cryptonary Pro subscriber, you also get:
3X Value Guarantee - If cumulative documented upside does not reach 300% during your 12-month membership, you can request a full refund. Terms
24/7 access to experts with 50+ years’ experience
All of our top token picks for 2025
On hand technical analysis on any token of your choice
Weekly livestreams & ask us anything with the team
Daily insights on Macro, Mechanics, and On-chain
Curated list of top upcoming airdrops (free money)
3X Value Guarantee
If cumulative documented upside does not reach 300% during your 12-month membership, you can request a full refund.
Our track record speaks for itself
With over 2.4M tokens and widespread misinformation in crypto, we cut through the noise and consistently find winning assets.
Our track record speaks for itself
With over 2.4M tokens and widespread misinformation in crypto, we cut
through the noise and consistently find winning assets.


Frequently Asked Questions
Can I trust Cryptonary's calls?
Yes. We've consistently identified winners across multiple cycles. Bitcoin under $1,000, Ethereum under $70, Solana under $10, WIF from $0.003 to $5, PopCat from $0.004 to $2, SPX blasting past $1.70, and our latest pick has already 200X'd since June 2025. Everything is timestamped and public record.
Do I need to be an experienced trader or investor to benefit?
No. When we founded Cryptonary in 2017 the market was new to everyone. We intentionally created content that was easy to understand and actionable. That foundational principle is the crux of Cryptonary. Taking complex ideas and opportunities and presenting them in a way a 10 year old could understand.
What makes Cryptonary different from free crypto content on YouTube or Twitter?
Signal vs noise. We filter out 99.9% of garbage projects, provide data backed analysis, and have a proven track record of finding winners. Not to mention since Cryptonary's inception in 2017 we have never taken investment, sponsorship or partnership. Compare this to pretty much everyone else, no track record, and a long list of partnerships that cloud judgements.
Why is there no trial or refund policy?
We share highly sensitive, time-critical research. Once it's out, it can't be "returned." That's why membership is annual only. Crypto success takes time and commitment. If someone is not willing to invest 12 months into their future, there is no place for them at Cryptonary.
Do I get direct access to the Cryptonary team?
Yes. You will have 24/7 to the team that bought you BTC at $1,000, ETH at $70, and SOL at $10. Through our community chats, live Q&As, and member only channels, you can ask questions and interact directly with the team. Our team has over 50 years of combined experience which you can tap into every single day.
How often is content updated?
Daily. We provide real-time updates, weekly reports, emergency alerts, and live Q&As when the markets move fast. In crypto, the market moves fast, in Cryptonary, we move faster.
How does the 3X Value Guarantee work?
We stand behind the value of our research. If the documented upside from our published research during your 12-month membership does not exceed three times (3X) the annual subscription cost, you can request a full refund. Historical context: In every completed market cycle since 2017, cumulative documented upside has exceeded 10X this threshold.
TermsRecommended from Cryptonary


