Save 23% ($351) & Get a Free 1-1 Call with our Team ⏰ : 0d 2h 59m 45s
BTC, ETH and More: Time for the Market to Decide
This week’s move brought Bitcoin into the exact zone we’ve been tracking, with ETH and SOL attempting to follow through. Now the focus shifts to weekly closing behavior and Bitcoin Dominance, because that will determine whether momentum expands into the wider market or compresses back into BTC. Let's dive in...
Disclaimer: This is not financial or investment advice. You are responsible for any capital-related decisions you make, and only you are accountable for the results.
Quick bridge from earlier this week…
Market structure had already shifted bullish earlier in the week, and that stance largely played out as expected. Bitcoin followed through once $93,150 was reclaimed, pushing directly into the $96K liquidity zone and printing a local high near $97,900 before pulling back a little eventually.Ethereum also showed strong follow through, reclaiming its uptrend trendline and breaking above the next resistance zone at $3,287, now attempting to flip it into support. Solana pushed into $144.5, the key breakout level, although it has yet to show sustained acceptance above it. HyperLiquid met its upside objective at $26.9, but failed to hold above support and has since rotated back into its prior range, keeping structural bias same as neutral-bullish for now.
In today’s Market Direction, focus expands beyond individual setups to broader market context with the addition of Bitcoin Dominances analysis. Dominance behavior at this stage will be key in determining whether strength continues to rotate into the wider market or compresses back toward BTC. So let's dive in!
TLDR
- Bitcoin (BTC): Broke above $93,150 resistance, consolidating around $96K, weekly close above $96K opens $100K-104K, rejection risks pullback to downside liquidity targets.
- Ethereum (ETH): Reclaimed uptrend and $3,287, holding above it, acceptance above $3,336-3,350 (200 EMA) targets $3,436 and $3,658, while $3,170-3,055 is downside support.
- Solana (SOL): Failed to hold above $144.5, hovering just below, weekly close above $143.5 keeps bullish structure alive, otherwise risk back to $135.
- Bitcoin Dominance (BTC.D): Retesting daily 200 EMA (59.9) after breakdown, rejection favors alts with downside targets 57.2% and 54.6% for dominance.
Bitcoin
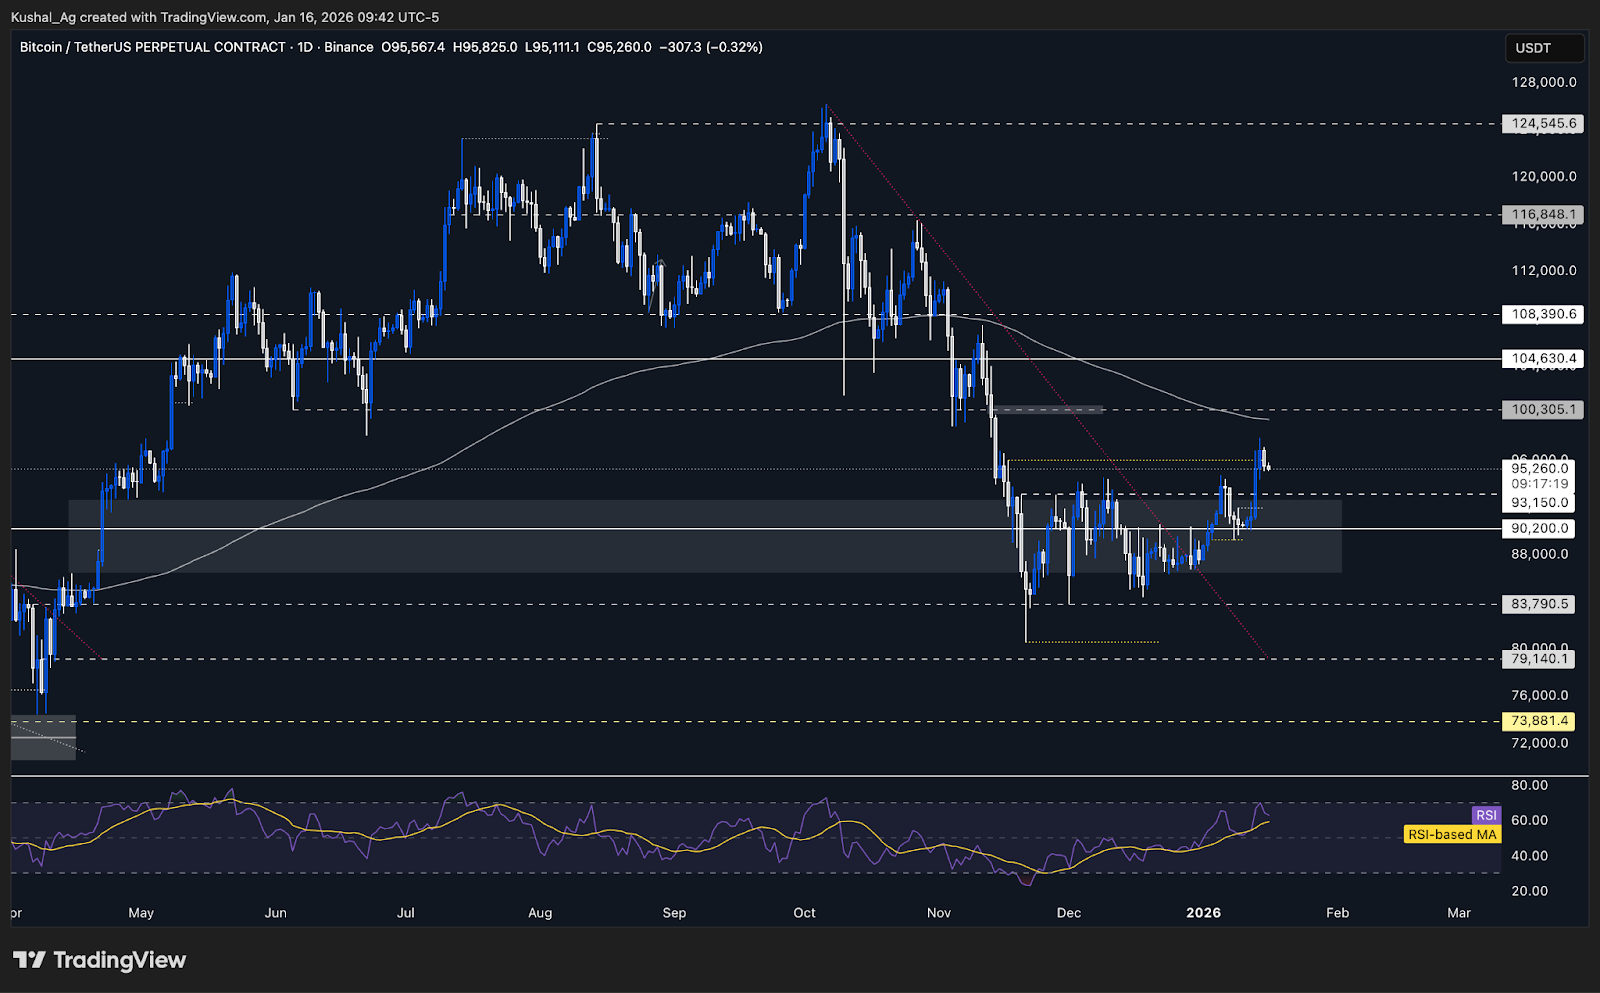
TA:Bitcoin followed through exactly as outlined in the prior analysis, breaking above $93,150 and moving straight into the $96,000 weekly liquidity zone, printing a local high near $97,900 before pulling back.
Price is now consolidating directly around $96,000, which we had flagged weeks ago as a key weekly liquidity target, making this level a critical decision zone.
The key development now shifts to the weekly timeframe, acceptance above $96,000 would confirm strength and open higher targets, while a wick and reject would signal a liquidity sweep and require reassessment as it would then open downside liquidity targets on the weekly timeframe.
If we see prices consolidate around $96,000, it would likely mean supply getting absorbed and potential upside continuation on the table.
Structurally, $93,150 has flipped cleanly into support after acting as resistance, making it the most important downside level to monitor for any healthy pullback or continuation setup.
RSI has cooled from the 70 region and is now hovering around 63 with average at 58, still firmly constructive. The daily 200 EMA near $99,500 is flattening, signalling that downside pressure has eased and trend conditions are stabilising.
Key Levels
- Next Support: $93,150
- Next Resistance: $96,000
- Direction: Neutral-Bullish
- Upside Target: $100,300
- Downside Target: $90,200
Cryptonary’s Take
Bitcoin has now reached the exact weekly liquidity zone we were tracking, and how price behaves around $96,000 will dictate the next phase. A weekly close above $96,000 would be a strong confirmation signal and materially improve the probability of continuation toward six figures.However, if price fails to hold this level on a weekly basis and leaves a rejection wick, the move into $96K would classify as a liquidity sweep, reopening the door for a pullback toward $93,150 and potentially lower before any further upside attempts.
For now, the stance remains neutral-bullish, with structure constructive as long as $93,150 holds. The next weekly close will be decisive in determining whether Bitcoin transitions into trend continuation or enters a consolidation/pullback phase.
Ethereum
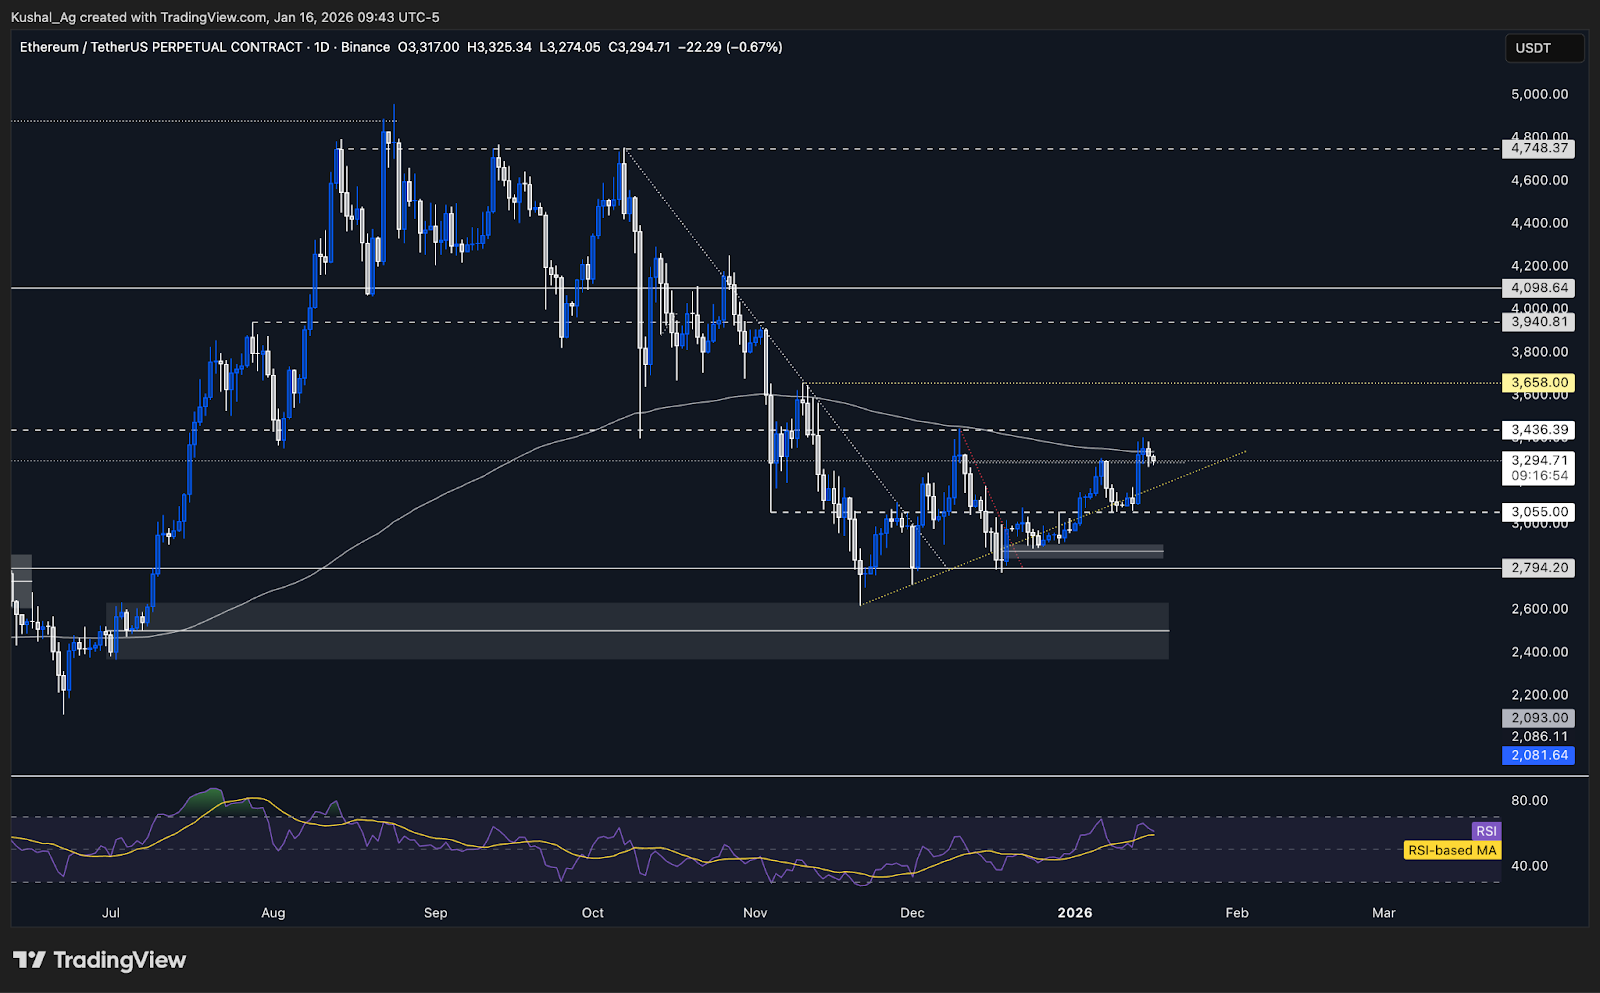
TA:Ethereum followed through cleanly after forming a base above $3,055, reclaiming the lost uptrend trendline and printing a strong bullish expansion candle that broke through the $3,287 resistance zone.
That resistance has now flipped into support, with price holding above it for the past few sessions.
Price is currently compressing between reclaimed support at $3,287 and the daily 200 EMA zone overhead, creating a short-term squeeze.
A pullback toward the uptrend trendline around the $3,170-$3,200 region would still be considered healthy, as Ethereum has not yet retested the reclaimed trendline yet.
RSI is holding around 62 with average at 58, signalling healthy upside momentum without being overextended. The daily 200 EMA near $3,336 is flattening, indicating that prior bearish pressure has dissipated and trend conditions are stabilising.
Key Levels
- Next Support: $3,287
- Next Resistance: $3,436
- Direction: Neutral-Bullish
- Upside Target: $3,658
- Downside Target: $3,170
Cryptonary’s Take
Ethereum has executed a clean structural recovery, reclaiming both the uptrend trendline and the $3,287 resistance zone, which materially improves the higher timeframe setup. Holding above this level keeps the market in a constructive posture.The next inflection comes at the daily 200 EMA. Acceptance above this region would likely trigger a stronger continuation leg toward $3,436 and potentially $3,658, while a controlled pullback into the trendline would still preserve the bullish structure.
For now, ETH remains neutral-bullish, with buyers in control as long as $3,287 holds. Directional confirmation strengthens meaningfully on acceptance above the 200 EMA, while failure below $3,170 would be the first signal that momentum is stalling.
Solana
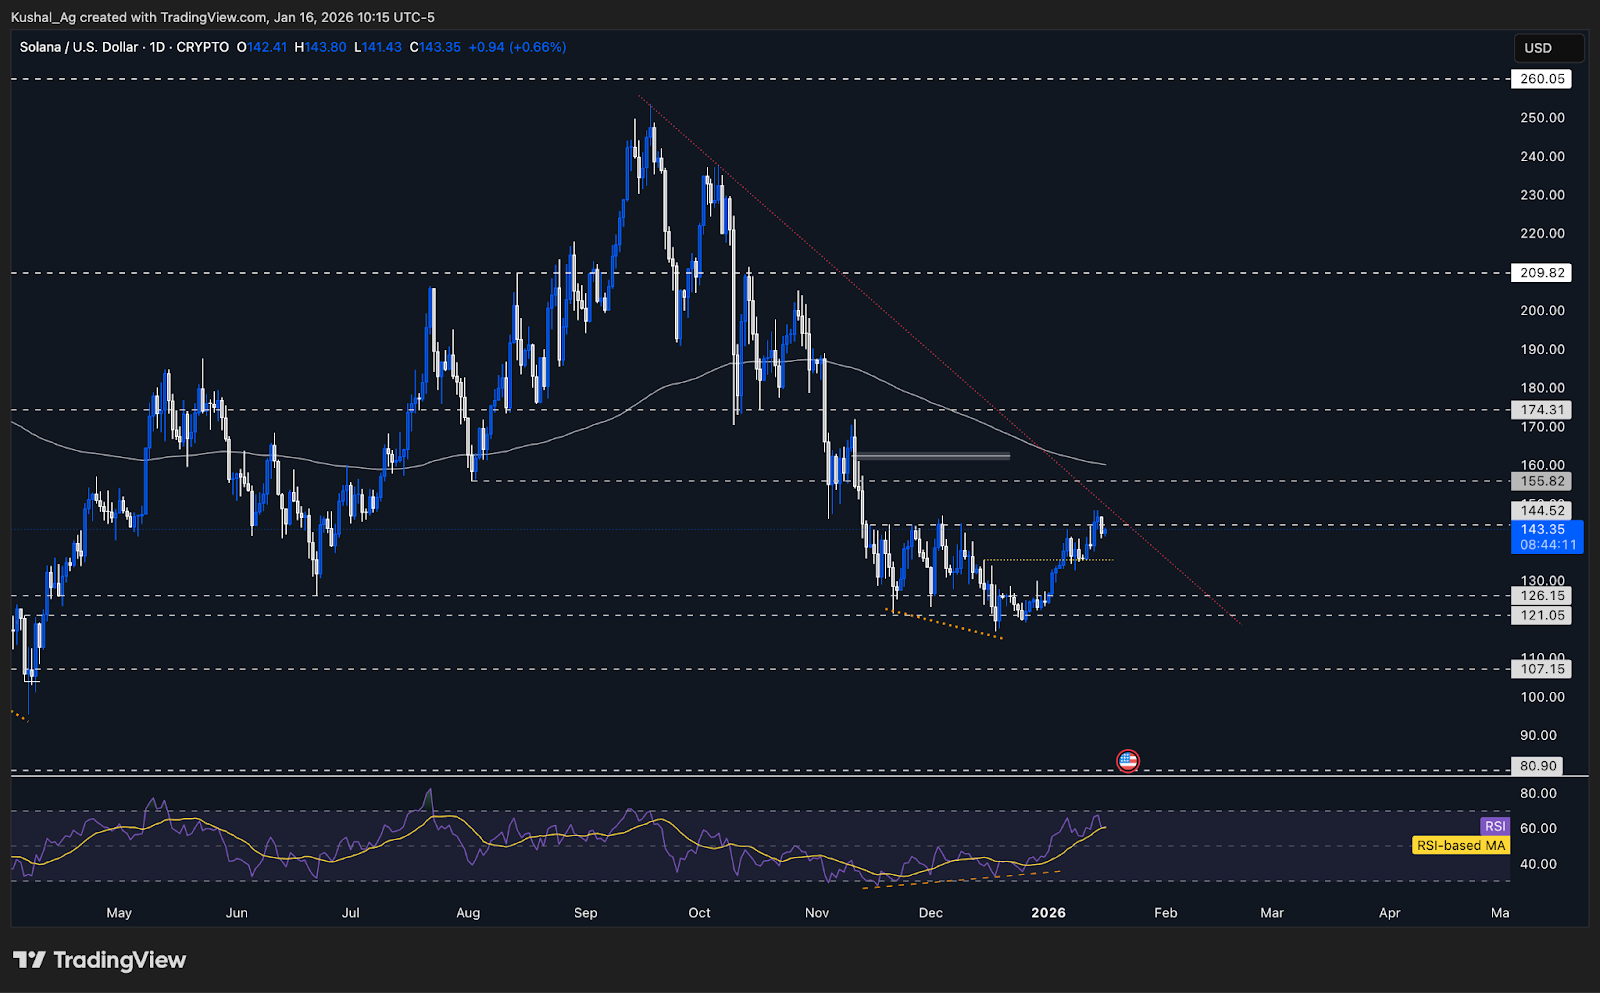
TA:Solana attempted a breakout above $144.52, briefly trading above the level for a few sessions, but failed to sustain acceptance and has since pulled back below it. Price is now hovering just under resistance, consolidating, which keeps the structure intact for now.
Solana has also wicked into higher weekly liquidity, specifically the 1st December weekly high near $147 and the previous week’s high around $143.5. These wicks signal liquidity getting swept, and without weekly acceptance/closings above these levels, they do not confirm continuation for upside.
From a structural perspective, a weekly close above $143.5 is the bare minimum requirement to maintain bullish continuation. A weekly close above $147 would be the stronger confirmation, opening the door for expansion toward higher targets. Wicks above these levels without closes would weaken the bullish case and increase the probability of downside liquidity being explored.
Solana is also nearing a larger downtrend trendline from September 2025, price is likely to interact with it around $145-$148. A rejection here could open a pullback toward $135, while a clean breakout would be bullish for continuation.
On the downside, $135.4 remains the key support that defines the bullish structure. As long as this level holds, Solana remains in a good place. A loss of $135.4 would reopen the prior range, with $126 acting as the next higher timeframe demand zone and prior breakout base.
RSI is hovering around 60 with its average near the same level, indicating healthy but cooling momentum. The daily 200 EMA near $160 is flattening, which supports trend stability, but continuation now depends on higher-timeframe acceptance
Key Levels
- Next Support: $135.4
- Next Resistance: $144.52
- Direction: Bullish
- Upside Target: $155.82
- Downside Target: $127
Cryptonary’s Take
Solana remains one of the stronger majors structurally, but it is now at a validation phase. The failure to hold above $144.52 does not invalidate the trend, but it shifts focus toward how price behaves around weekly closing.The key takeaway is simple, weekly acceptance matters more than intraday wicks. A weekly close above $143.5 keeps the bullish thesis intact, while acceptance above $147 would materially strengthen continuation toward $155 and beyond. Without that, further consolidation or a controlled pullback remains possible.
As long as $135.4 holds, Solana’s structure remains bullish. Strength is still present, but confirmation is required. This is a level driven market here, patience around weekly closes will be important to define the next directional move.
Hyperliquid
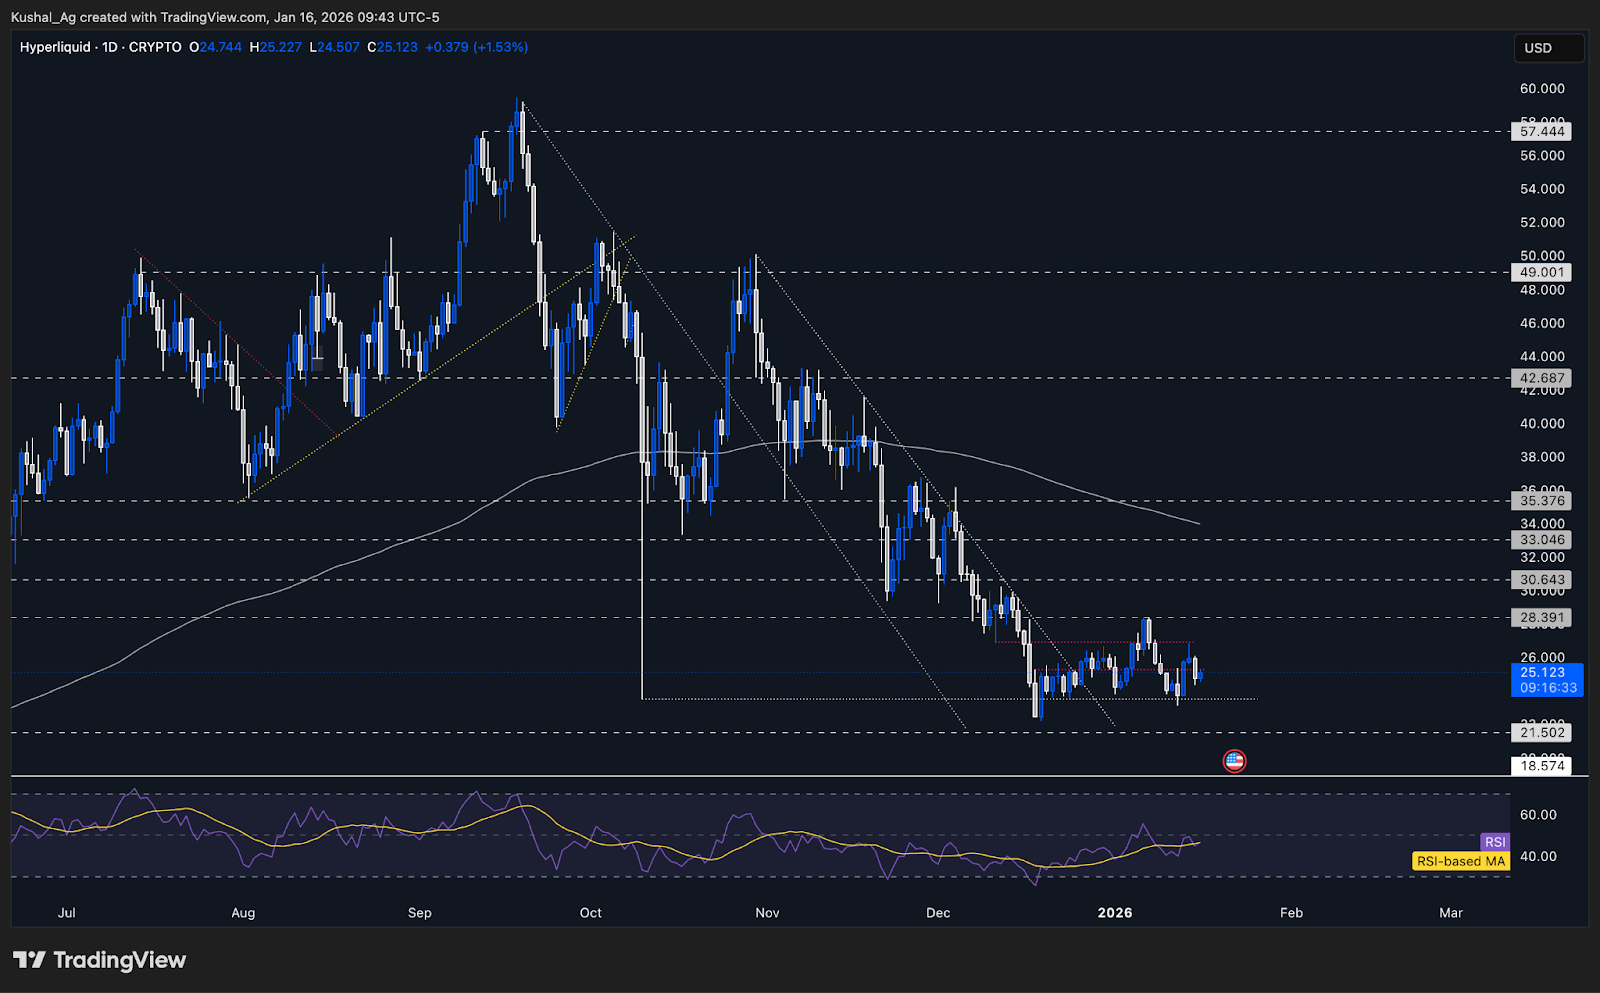
TA:HyperLiquid previously tagged the $23.5 support, which aligned with the 10th October liquidity low, an area we highlighted as a high probability zone for base formation. Price reacted cleanly from this level.
Following that reaction, HYPE reclaimed $25.2-$25.5 on a daily closing basis, which was the key condition we outlined for continuation. That reclaim led to a direct expansion toward the $26.9 resistance, where price topped just shy of the level before reversing.
After rejecting from $26.9, HyperLiquid was unable to sustain acceptance above $25.2, and price has since rotated back below that level. As a result, HYPE is now trading back inside its prior range.
Structurally, the setup remains constructive as long as $23.5 holds. That level continues to define the base building thesis. Acceptance above $25.2 would be required again to reopen upside continuation, while failure to hold $23.5 would invalidate this setup.
RSI is hovering around 46, in the neutral zone. The 200 EMA $34 remains downward sloping, indicating lingering higher timeframe pressure, which reinforces the need for cleaner reclaim levels before shifting bullish.
Key Levels
- Next Support: $23.5
- Next Resistance: $25.2-$25.5
- Direction: Neutral-Bullish
- Upside Target: $26.9
- Downside Target: $21.5
Cryptonary’s Take
HyperLiquid is back in its old range it was trading in before it had broken on the upside. The rejection from $26.9 and loss of $25.2 resets momentum, but does not invalidate the broader base forming around $23.5.As long as $23.5 continues to hold, this remains a constructive setup where accumulation can occur. A clean reclaim and acceptance above $25.2-$25.5 would be the trigger to shift bias more bullish again and reopen upside toward $26.9 and beyond.
In case prices wick below $23.5 and trades into the $20-$22 region, that would likely form a bullish divergence setup (which we had mentioned in the previous Market Direction), creating a higher quality risk reward opportunity. Keeping dry powder and staggered bids in the $20-$22 zone would ideally be a good play, as a sharp sweep and reversal from there would be a strong bullish signal.
Aura
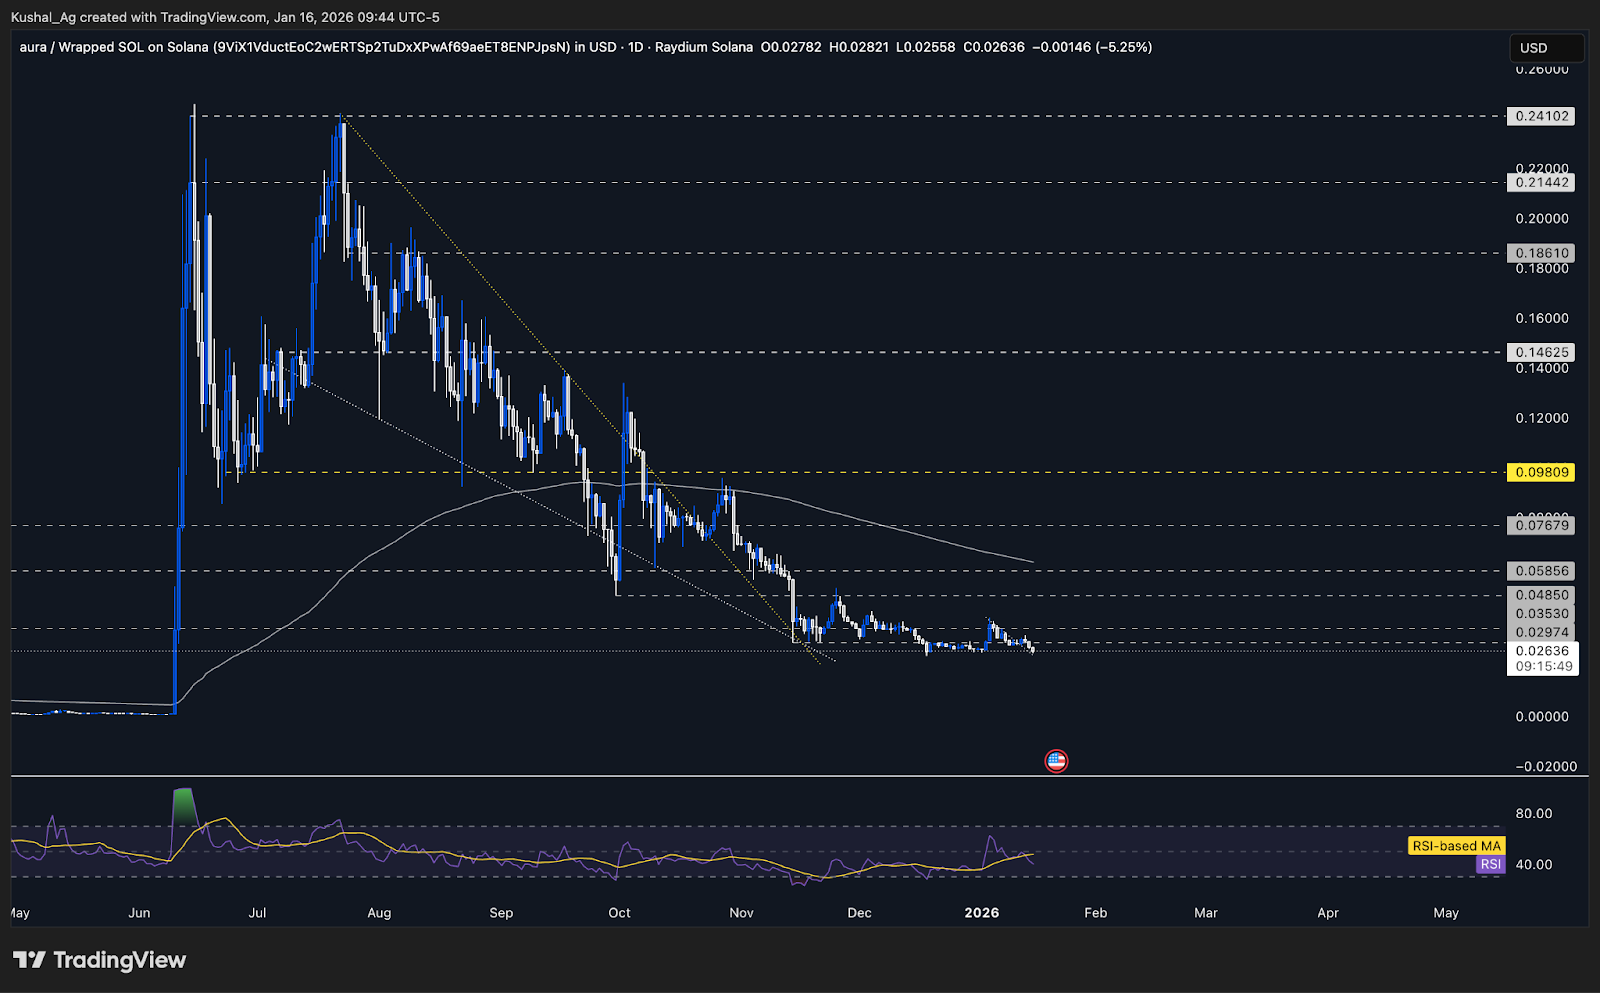
TA:Aura continues to trade inside its broader accumulation range, which has been intact for over a month now. The recent dip slightly below 0.03 does not change structure and still sits well within the same consolidation band.
Price action remains compressed and range bound, consistent with a base building phase. No structural breakdown has occurred, and volatility remains contained.
RSI is currently around 40, with the average near 48, reflecting short term cooling after the recent pullback. This reset in momentum is typical during accumulation and does not signal trend damage.
The 200 EMA on the daily timeframe at 0.062 continues to slope gently lower but has stabilized relative to prior weeks. Any sustained push higher would likely force this EMA to flatten, which would be an early structural improvement signal.
- Direction: Bullish
- Action Plan: DCA and Raid
Cryptonary’s Take
Aura remains in a base building phase, with price consolidating. The brief dip below 0.03 looks more like a liquidity sweep within the range. As long as the broader range holds, pullbacks continue to be viewed as discounted zones. Reclaiming 0.035 would be the first step toward renewed upside momentum.Bitcoin Dominance (BTC.D)
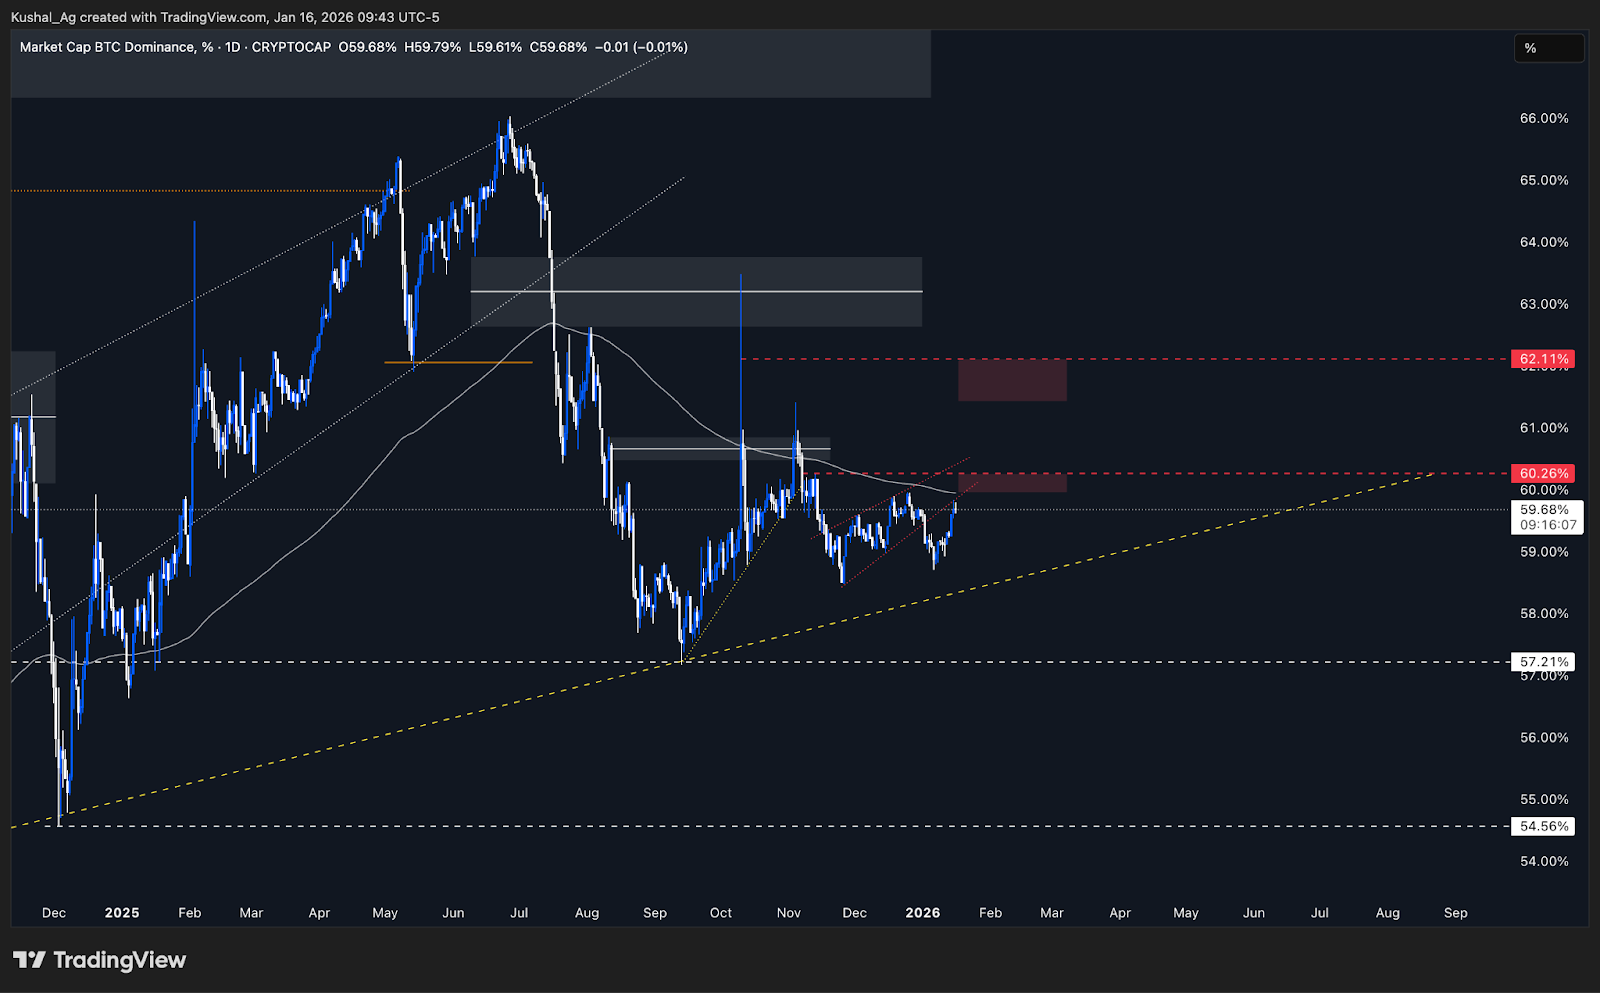
TA:Bitcoin dominance has been in a broader corrective phase since breaking below the daily 200 EMA in July 2025, ending the multi year uptrend that had been in place since 2022. Since that breakdown, dominance has repeatedly failed below the 200 EMA, with price consistently rejecting from underneath it, a structurally bearish setup that historically favors relative strength in altcoins.
Most recently, BTC.D broke down from a small bear flag in early January and is now in the process of retesting that breakdown. Price is currently trading into the first key rejection zone between 59.9% and 60.2%, where the daily 200 EMA (59.9%) overlaps with a clear liquidity pocket near 60.2%. This area is the first region where a rejection would confirm continuation of the dominance downtrend.
If this initial zone fails to cap price, the next area to watch sits higher between 61.4% and 62.1%, which represents the next major liquidity cluster. Acceptance above this zone would weaken the bearish dominance thesis, but until that happens, this remains a secondary rejection zone and not the base case.
On the downside, a confirmed rejection followed by a break below the yellow uptrend trendline would open the path toward 57.21% initially, followed by 54.56%. A decisive breakdown below this trendline would materially strengthen the case for broader altcoin outperformance relative to Bitcoin.
Bitcoin Dominance Chart:
Cryptonary’s Take
Bitcoin dominance remains structurally bearish as long as it continues to reject below the daily 200 EMA. The current retest into the 59.9%-60.2% zone is critical, a clean rejection from here would reinforce the idea that dominance is rolling over again after the January bear flag breakdown, keeping the environment favorable for alt rotation.From a market wide perspective, declining dominance is exactly what supports sustained strength in Ethereum, Solana, and higher beta altcoins. As long as BTC.D fails to reclaim and accept above the 200 EMA, the path of least resistance remains lower, with downside targets at 57.21% and 54.56%.
Closing Thoughts
Price action is starting to show clearer development, and the focus now shifts firmly toward weekly closings. For Bitcoin, the key question is whether price can secure a weekly close above $96K, that will largely determine whether momentum extends toward higher levels or pauses for pullbacks. For Solana, two levels matter, a weekly close above the previous week’s high at $143.5 as a minimum, and ideally acceptance above the weekly liquidity high near $147, which would confirm continuation.Ethereum continues to look good on the daily timeframe. Holding and building above the 200 EMA would be an important signal, and if that base forms cleanly, it strengthens the case for a more firm bullish stance going forward. HyperLiquid, on the other hand, remains choppy, rejecting from resistance and struggling to hold higher levels. As long as $23.5 holds, the neutral-bullish bias stays intact, but structure still needs improvement.
We’ve also added Bitcoin Dominance into the analysis to better track broader market dynamics. Continued rejection and breakdown in dominance would signal increasing relative strength in altcoins, which is something we’ll try to monitor weekly/biweekly. These weekly closes should offer much clearer directional cues for the next phase of market direction.
Cryptonary, OUT!
Continue reading by joining Cryptonary Pro
$1,548 $1,197/year
Get everything you need to actively manage your portfolio and stay ahead. Ideal for investors seeking regular guidance and access to tools that help make informed decisions.
For your security, all orders are processed on a secured server.
As a Cryptonary Pro subscriber, you also get:
3X Value Guarantee - If cumulative documented upside does not reach 300% during your 12-month membership, you can request a full refund. Terms
24/7 access to experts with 50+ years’ experience
All of our top token picks for 2025
On hand technical analysis on any token of your choice
Weekly livestreams & ask us anything with the team
Daily insights on Macro, Mechanics, and On-chain
Curated list of top upcoming airdrops (free money)
3X Value Guarantee
If cumulative documented upside does not reach 300% during your 12-month membership, you can request a full refund.
Our track record speaks for itself
With over 2.4M tokens and widespread misinformation in crypto, we cut through the noise and consistently find winning assets.
Our track record speaks for itself
With over 2.4M tokens and widespread misinformation in crypto, we cut
through the noise and consistently find winning assets.


Frequently Asked Questions
Can I trust Cryptonary's calls?
Yes. We've consistently identified winners across multiple cycles. Bitcoin under $1,000, Ethereum under $70, Solana under $10, WIF from $0.003 to $5, PopCat from $0.004 to $2, SPX blasting past $1.70, and our latest pick has already 200X'd since June 2025. Everything is timestamped and public record.
Do I need to be an experienced trader or investor to benefit?
No. When we founded Cryptonary in 2017 the market was new to everyone. We intentionally created content that was easy to understand and actionable. That foundational principle is the crux of Cryptonary. Taking complex ideas and opportunities and presenting them in a way a 10 year old could understand.
What makes Cryptonary different from free crypto content on YouTube or Twitter?
Signal vs noise. We filter out 99.9% of garbage projects, provide data backed analysis, and have a proven track record of finding winners. Not to mention since Cryptonary's inception in 2017 we have never taken investment, sponsorship or partnership. Compare this to pretty much everyone else, no track record, and a long list of partnerships that cloud judgements.
Why is there no trial or refund policy?
We share highly sensitive, time-critical research. Once it's out, it can't be "returned." That's why membership is annual only. Crypto success takes time and commitment. If someone is not willing to invest 12 months into their future, there is no place for them at Cryptonary.
Do I get direct access to the Cryptonary team?
Yes. You will have 24/7 to the team that bought you BTC at $1,000, ETH at $70, and SOL at $10. Through our community chats, live Q&As, and member only channels, you can ask questions and interact directly with the team. Our team has over 50 years of combined experience which you can tap into every single day.
How often is content updated?
Daily. We provide real-time updates, weekly reports, emergency alerts, and live Q&As when the markets move fast. In crypto, the market moves fast, in Cryptonary, we move faster.
How does the 3X Value Guarantee work?
We stand behind the value of our research. If the documented upside from our published research during your 12-month membership does not exceed three times (3X) the annual subscription cost, you can request a full refund. Historical context: In every completed market cycle since 2017, cumulative documented upside has exceeded 10X this threshold.
TermsRecommended from Cryptonary


