Save 23% ($351) & Get a Free 1-1 Call with our Team ⏰ : 0d 2h 59m 43s
BTC, ETH and More: Weak Labour Data Adds Uncertainty
Markets attempted to move, but conviction remains limited. Bitcoin delivered the upside liquidity sweep toward $73,800 before rotating back lower, while Ethereum and Solana both failed to sustain breakout attempts. At the same time, weaker labour market data has complicated the macro picture and added uncertainty to the path ahead. In this report, we break down what these developments mean for market structure and the key levels to watch next...

Disclaimer: This is not financial or investment advice. You are responsible for any capital-related decisions you make, and only you are accountable for the results.
Quick bridge from earlier this week…
In the previous Market direction earlier on Tuesday, we pivoted our stance on Bitcoin and Ethereum from neutral-bearish to neutral as the $65,650 support on BTC continued to hold despite broader market uncertainty. That pivot allowed for the possibility of a short-term liquidity sweep to the upside, which is exactly how price action unfolded. Bitcoin moved through the $70,500 resistance and extended into the $73,800 upside target that we had already outlined in the MD, before it faced rejection near that region and rotating back lower.Ethereum similarly rotated toward range highs but failed to sustain a breakout above $2,116, while Solana’s breakout attempt above $89 also lacked follow-through and quickly returned back inside the range. Hyperliquid meanwhile moved toward the $30.64 support level we had identified, with the neutral-bearish stance continuing to hold.
Today’s labour market data came in weaker than expected, with NFP at -92k vs 60k forecast and unemployment rising to 4.4%, adding uncertainty to the macro backdrop. We discussed the implications for the Fed and risk assets in today’s Market Pulse.
Disclaimer: This content is for informational and educational purposes only. It does not constitute financial advice, and should not be relied upon as a basis for making investment decisions. Virtual assets are volatile and may lose their value in full. Past performance does not indicate future results. Always do your own research.
TLDR
- Risk Posture: Neutral-Defensive
- BTC: Upside liquidity at $73.8K was swept as expected after holding $65,650, but price has rotated back into the broader range. Structure remains neutral unless we see a break above $73,800 or below $65,650.
- ETH: Range structure between $1,900 and $2,116 continues to hold. The recent push above resistance failed, keeping Ethereum neutral still.
- SOL: Attempted a breakout above $89 and pushed but failed ultimately and price has returned inside the $78-$89 range. Market structure remains neutral with no confirmed directional move yet.
- HYPE: Rejection from the $33 resistance and 200 EMA remains intact. The $30.64 level has now broken and flipped into resistance, opening continuation toward the $28.39 support, with further downside possible if selling pressure persists.
- AURA: Still moving sideways with the divergence setup intact. Awaiting broader market strength, particularly from Solana, before expecting any meaningful upside reaction.
Bitcoin
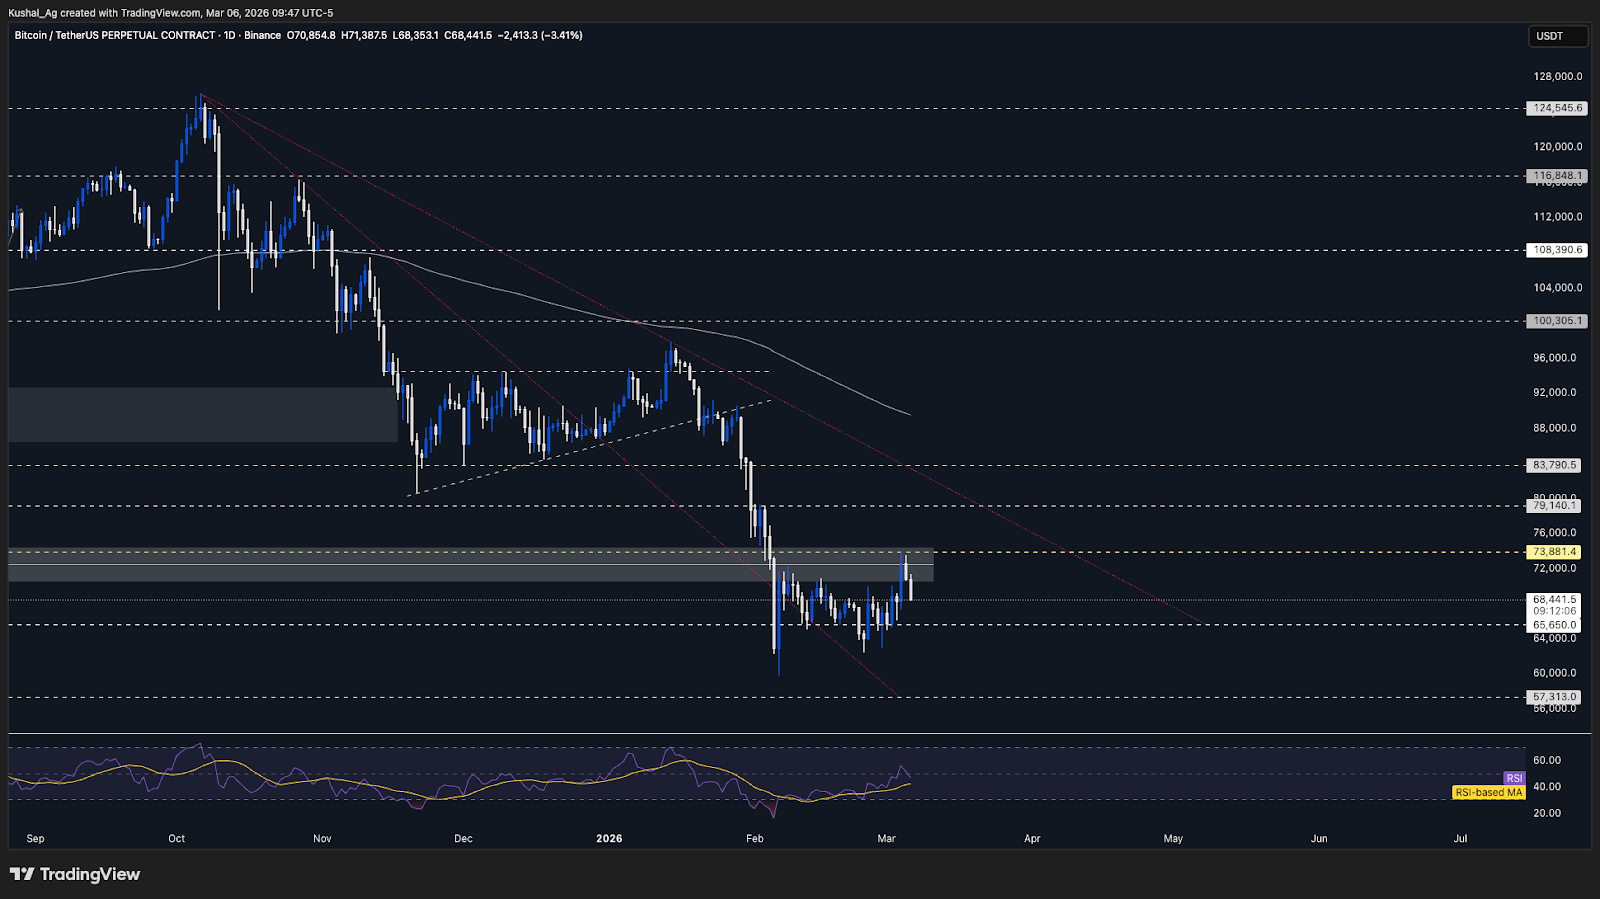
TABitcoin played out the thesis from the previous analysis. At the time, we pivoted from a neutral-bearish stance to neutral as the $65,650 level continued to hold despite broader market uncertainty. That support acted as the pivot we were watching for a reaction, and the expectation was that if it held, Bitcoin could move higher to sweep upside liquidity.
That scenario played out. Bitcoin respected $65,650 and pushed higher toward the first resistance at $70,500 before extending further exactly into the upside target at $73,800. Price printed a high near $74,100 before encountering resistance and beginning to rotate lower.
Following that rejection, Bitcoin has now slipped back below the $70,500 level. This confirms that the market remains in the same consolidation phase that has been developing for over a month.
Because of this, the broader stance remains neutral. The upside liquidity we were tracking has already been tapped, and further continuation higher would now require confirmation through sustained strength above $73,800. Until that happens, the market remains range-bound still.
If Bitcoin breaks below the $65,650 pivot this time, downside could accelerate fast. The recent move toward $73,800 would then likely be treated as an upside deviation from the range, and a confirmed breakdown below $65,650 could open a quicker move back toward the previous swing lows that Bitcoin printed a few weeks ago.
RSI has recovered significantly and now sits around the neutral region near 50 with average near 42, showing that momentum has reset after the recent move. Meanwhile, the 200 EMA continues to slope downward and sits near $89,500, indicating that the higher-timeframe structure still remains under pressure.
Key Levels:
- Support: $65,650
- Resistance: $70,500 & $73,800
- Direction: Neutral
- Upside Target: $79,100-$79,300
- Downside Target: $59,800
Cryptonary’s Take:
Bitcoin delivered the upside liquidity sweep we were expecting after holding the $65,650 pivot. However, the rejection from $73,800 and the move back into the range confirms that the broader market structure remains indecisive.For now, $65,650 remains the key level defining short-term direction. As long as that support continues to hold, Bitcoin may attempt another rotation higher within the range. But a confirmed break below it would reopen the path toward $62,800 and potentially $59,800, while a clean break above $73,800 would shift focus toward the $79,100-$79,300 region which is the weekly external range liquidity for BTC on the upside.
Ethereum
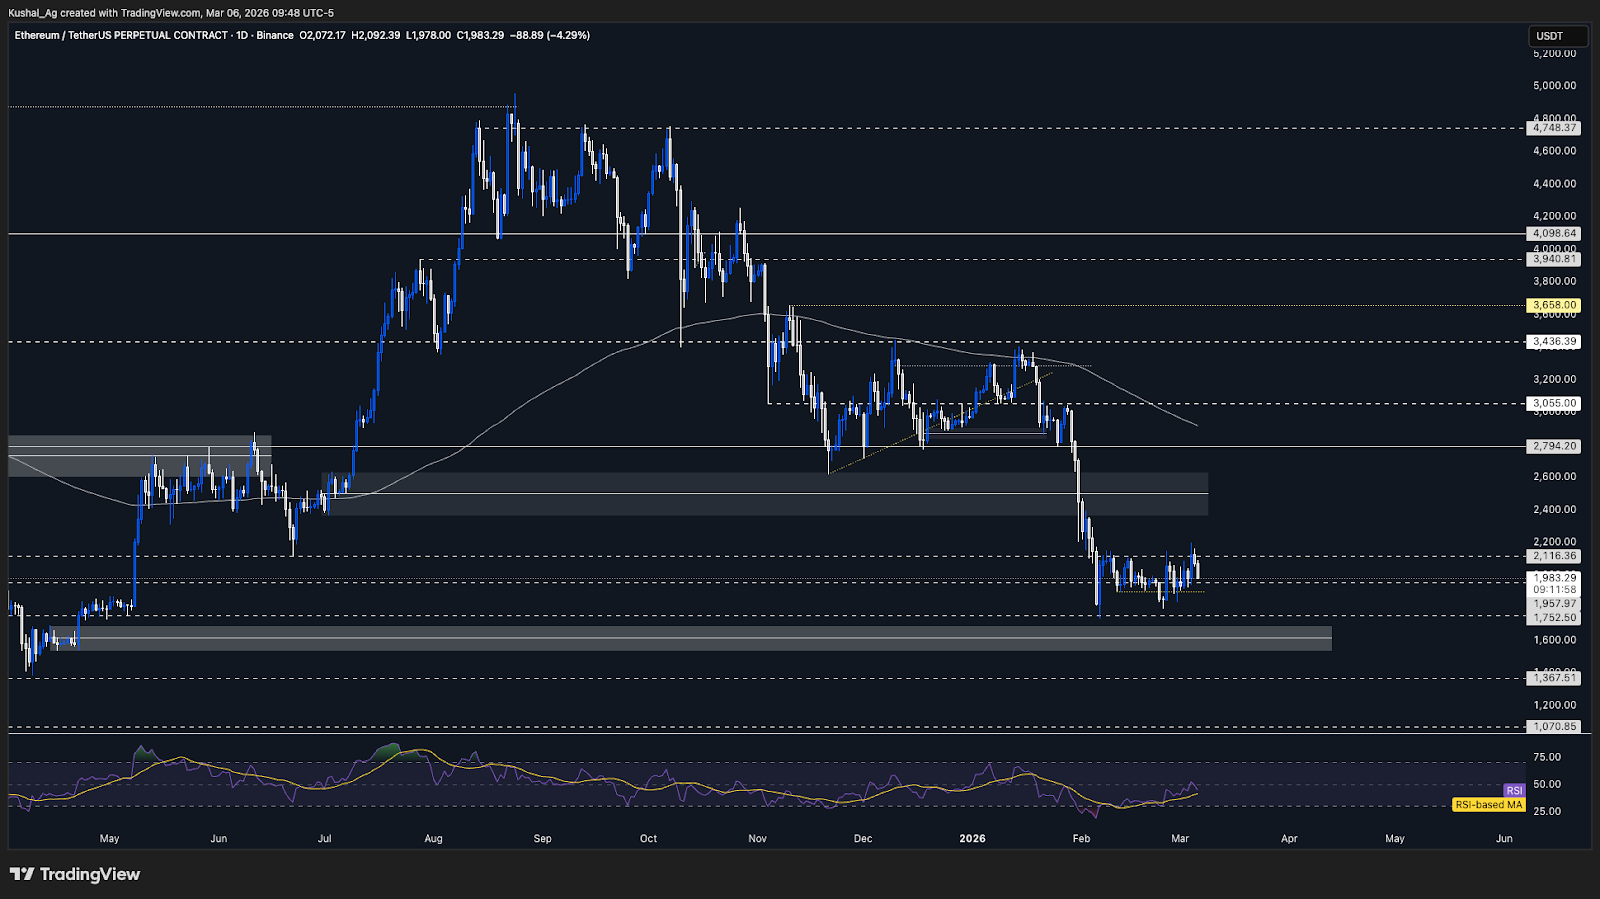
TAEthereum has majorly mirrored Bitcoin’s behavior, with the range-bound thesis continuing to play out. In the previous analysis, we highlighted the $1,957 region as a key support area, and price respected that level before moving higher toward the resistance zone.
Following the bounce, Ethereum pushed toward the $2,116 resistance and briefly traded above it, printing a local high near $2,200. However, the breakout attempt lacked follow-through. The entire push above resistance was quickly rejected and turned into an upper wick, indicating strong supply in that region.
In the following candle, Ethereum moved back below $2,116 and returned inside the broader range structure. This confirms that the market is still trading between $2,116 on the upside and the $1,900 support region on the downside, with neither side gaining clear control.
As a result, the broader stance remains neutral. A clean daily close with follow-through above $2,116 would open the path toward the $2,368 upside target. On the other hand, a confirmed break below the $1,900 region would expose the next downside objective toward $1,757.
RSI has recovered and now sits near 47 with an average around 42, suggesting momentum has reset toward neutral. Meanwhile, the 200EMA continues to slope downward and currently sits near $2,920, indicating the higher timeframe trend remains under pressure.
Key Levels:
- Support: $1,900
- Resistance: $2,116
- Direction: Neutral
- Upside Target: $2,368
- Downside Target: $1,757
Cryptonary’s Take:
Ethereum continues to trade within the same consolidation structure, with the recent rejection above $2,116 reinforcing the strength of that resistance zone. The failure to hold above that level keeps the asset locked inside the broader range.For now, $1,900 remains the key pivot on the downside. As long as that support continues to hold, Ethereum may keep rotating within the range. However, a break below it would open the door toward the $1,700 region, while a confirmed breakout above $2,116 would shift focus toward the $2,368 upside objective.
Another important element to monitor here is the ETH/BTC pair. The major support around 0.029 continues to hold and price has been ranging around this level for roughly a month now. A breakdown below 0.029 would likely lead to Ethereum underperforming Bitcoin further. On the other hand, if ETH/BTC manages to bounce and sustain upside from this level, we could see Ethereum decouple from BTC and begin to outperform it in the short to medium term.
Solana
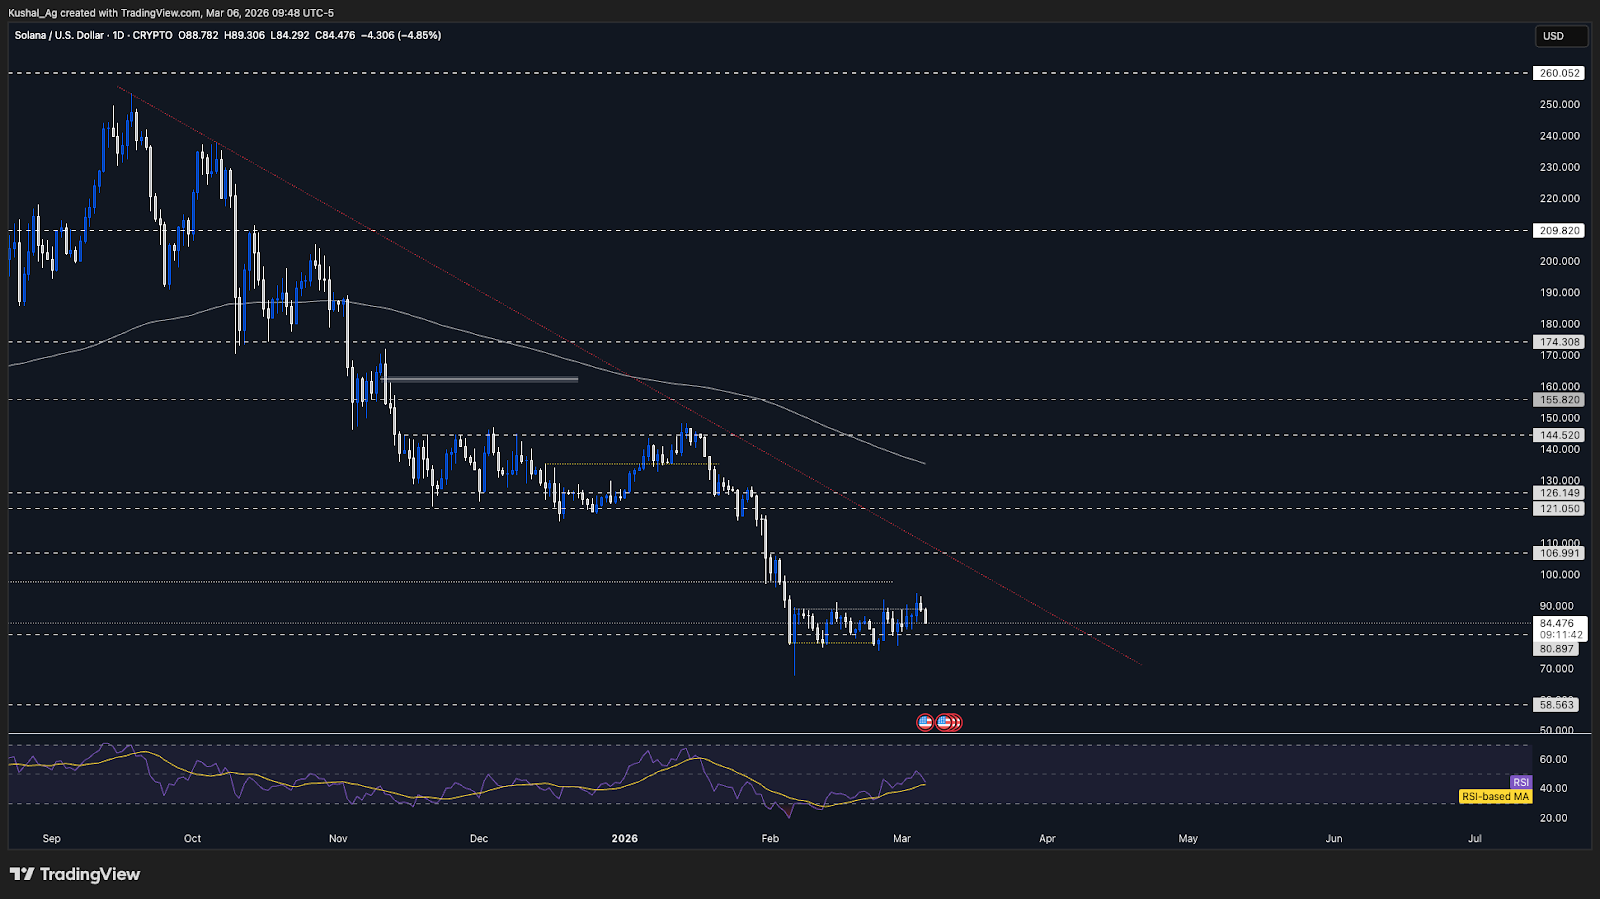
TASolana recently attempted to break out of its current range, price managed to close above the $89 resistance level and pushed higher, reaching a local high near $94. This move initially suggested that the range could be resolving to the upside.
However, shortly after the move higher, Solana faced strong rejection and the entire push above $89 was quickly reversed in alignment with the wider market facing rejection from important levels then. In the very next candle, price closed back below the resistance levels and reentered old ranges.
With Solana now back below $89, price has returned inside the broader consolidation range that has been in place for several weeks. This recent push was more likely a deviation than a confirmed breakout, and the range structure remains intact for now.
As long as the wider market continues to remain flat, Solana may gradually rotate back toward the lower end of the range near $80-$78. Only a sustained break and acceptance above $89 would reopen the path toward the upside target around $97.7 and potentially shift the stance toward a neutral-bullish outlook.
RSI has recovered and is currently sitting around 47 with an average near 43, showing that momentum has reset toward neutral. Meanwhile, the 200 EMA on the daily continues to slope downward and sits near $135.2, indicating that the higher-timeframe trend still remains under pressure.
Key Levels:
- Support: $78
- Resistance: $89
- Direction: Neutral
- Upside Target: $97.7
- Downside Target: $67.7
Cryptonary’s Take:
Solana attempted a breakout above the $89 resistance but failed to sustain momentum, quickly falling back inside the range. This reinforces the idea that the market is still stuck within the same consolidation structure and that the recent move was likely a deviation.For now, the range between $78 and $89 remains the key structure to monitor. If the wider market remains flat, Solana could drift back toward the lower boundary of the range.
Hyperliquid
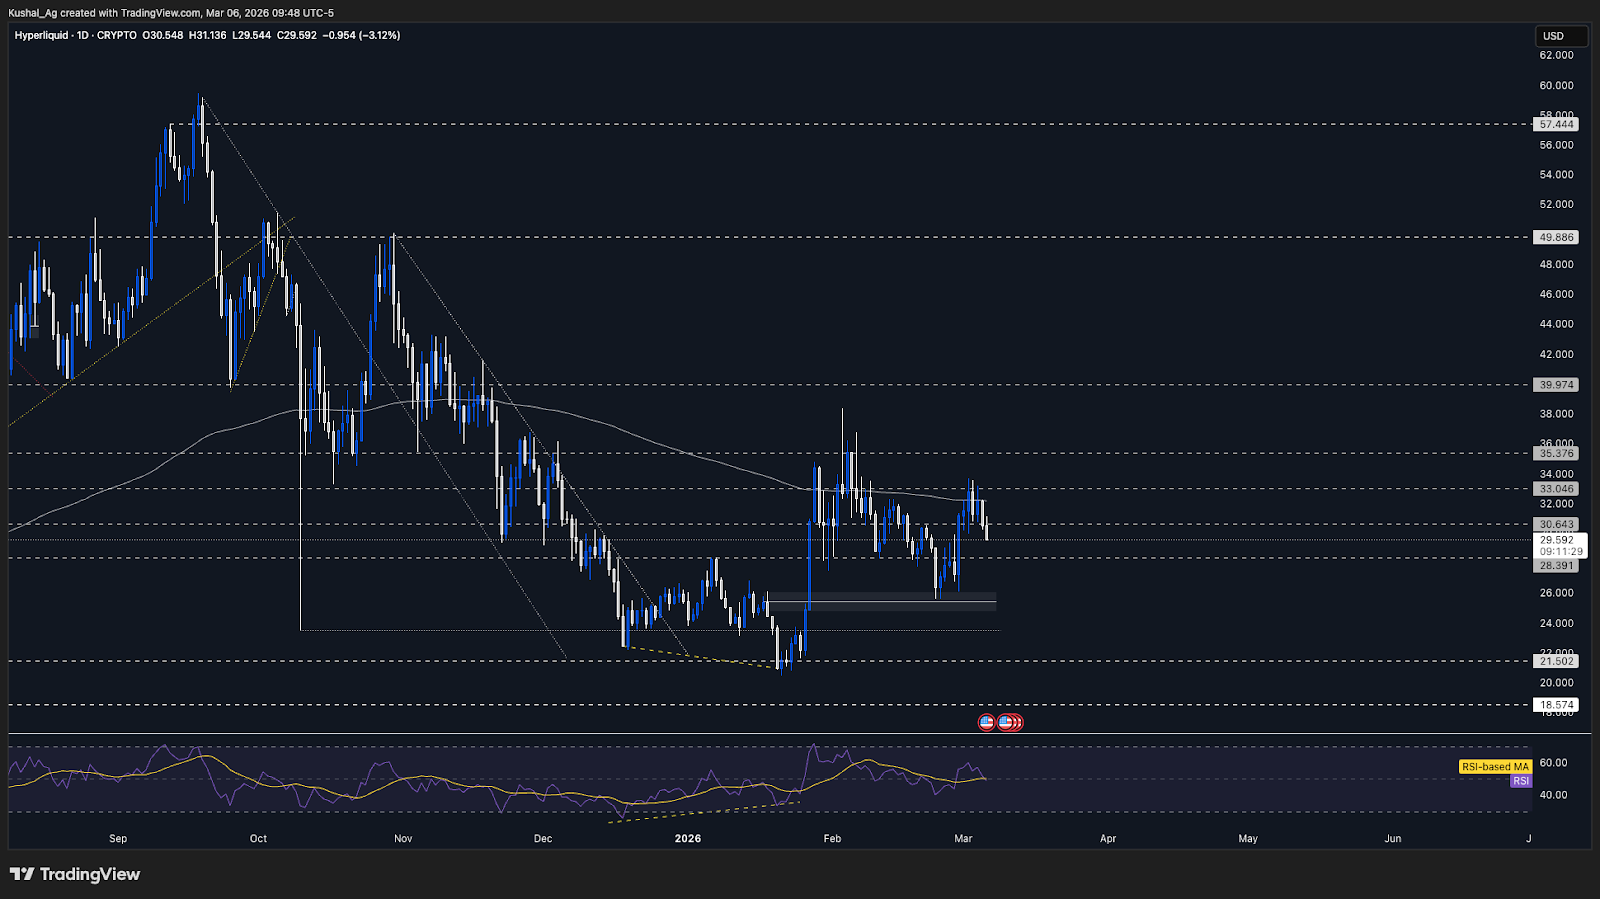
TAWhen we last analyzed Hyperliquid, price was facing rejection from the 200 EMA on the daily timeframe near the $33 region. That confluence between the 200 EMA and horizontal resistance was identified as a strong supply area, and we expected the price to move lower from there.
That scenario initially played out as Hyperliquid moved down toward the first support at $30.64. At the time, price briefly attempted to break below this level but quickly reversed, showing that buyers were defending the support in the short term.
However, at the time of writing this update, we can now see Hyperliquid has broken below the $30.64 level with a stronger move to the downside. This confirms the loss of the previous support and suggests the asset may continue rotating lower toward the next downside level.
With this breakdown now in place, $30.64 flips from support into resistance. As long as price remains below that region, the path of least resistance remains toward the $28.39 level. Only a reclaim of $30.64 followed by strength above $33 would invalidate the current downside pressure.
RSI remains relatively stable near the mid-zone, hovering around 53 with an average near 50. Meanwhile, the 200 EMA continues to sit around $32.2 and remains overhead resistance, reinforcing the broader bearish pressure on the asset.
Key Levels:
- Support: $28.39
- Resistance: $30.64
- Direction: Neutral-Bearish
- Upside Target: $33
- Downside Target: $25.4
Cryptonary’s Take:
The breakdown below $30.64 shifts the short-term structure slightly more bearish for Hyperliquid. With the former support now acting as resistance, the asset may continue rotating toward the next key level around $28.39 if sellers maintain control.Unless Hyperliquid manages to reclaim $30.64 and build strength back above the $33 region, the broader bias remains cautious. For now, the neutral-bearish stance continues to hold.
Aura
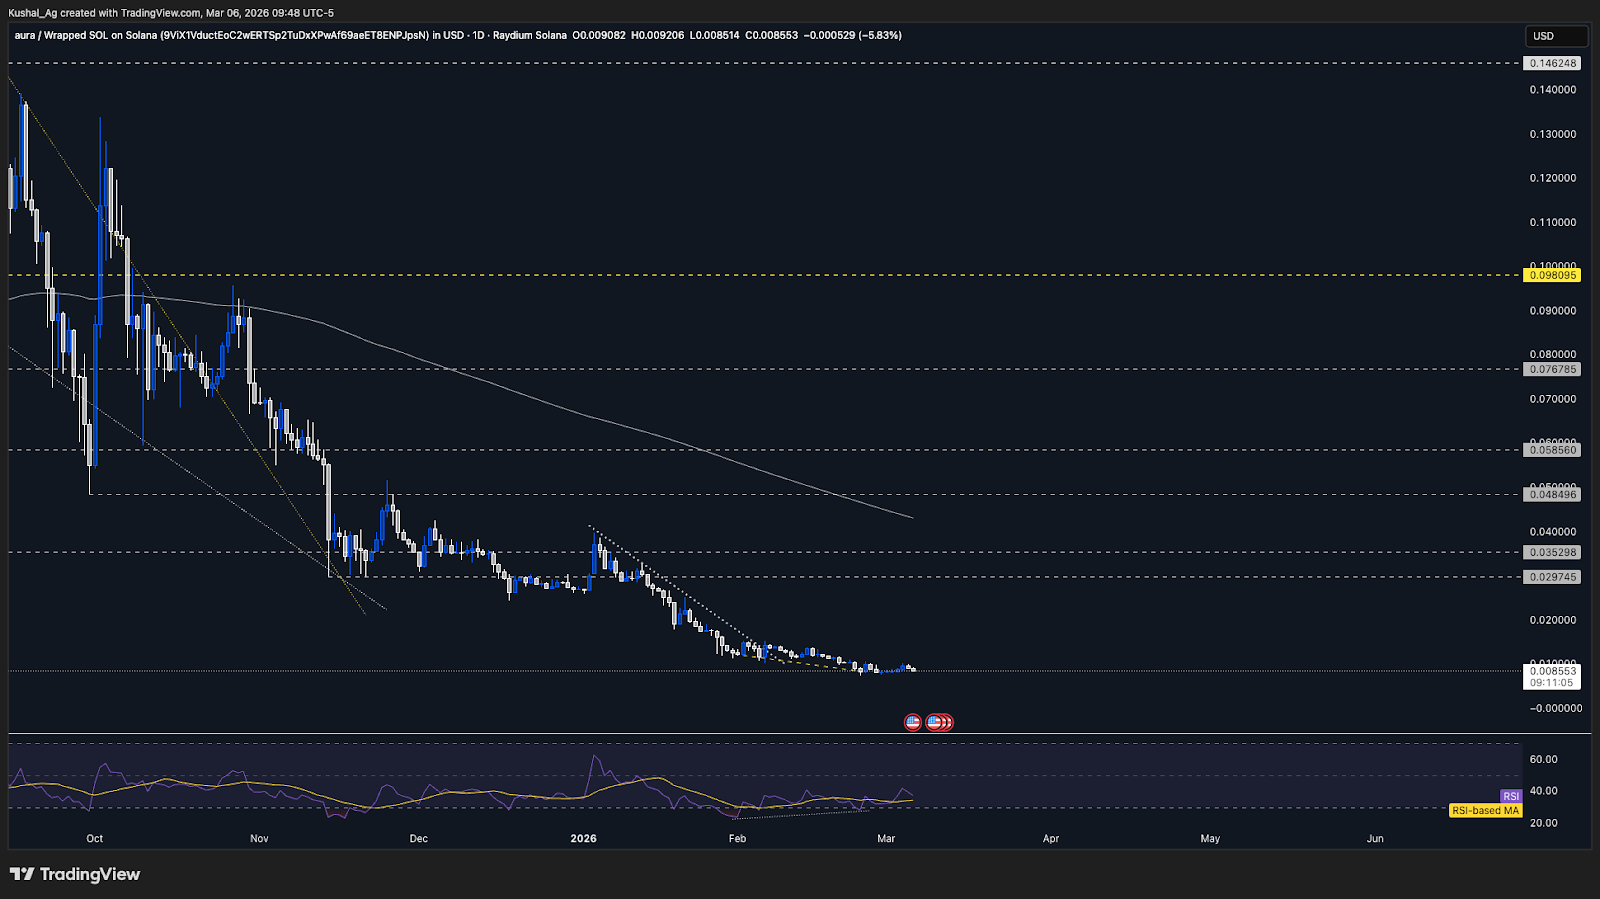
TAAura continues to trade with price showing very little structural, asset remains largely consolidating as broader market conditions continue to stay range-bound as well.
The potential bullish divergence setup we have been monitoring remains intact for now. However, the lack of strong price expansion means that the divergence has not yet translated into any meaningful upside momentum.
We briefly saw Solana attempt a breakout above its range recently, but that move failed and price returned back inside consolidation. Because Aura is a high-beta Solana play, the failed breakout also meant that we have not seen any significant capital rotation into these higher beta names yet.
On the daily timeframe, the 200 EMA continues to slope downward and is currently hovering around $0.043. RSI remains relatively weak near 39 with an average around 34, suggesting that momentum has not yet shifted strongly enough to support a reversal.
Aura Daily Chart:
Cryptonary’s Take:
The divergence setup still exists, but without broader market strength, particularly from Solana it is unlikely to trigger a sustained move. AUra continues to move sideways and we are primarily watching for wider market expansion before expecting any meaningful price reaction.Closing Thoughts
Our pivot from a neutral-bearish stance to neutral in the previous analysis proved timely, as the market reacted exactly around the levels we had outlined. Bitcoin held the $65,650 pivot and moved higher to sweep the upside liquidity toward the $73,800 region which we had mentioned in the previous MD before facing resistance and moving back into the broader range. That sequence largely validated the framework we had laid out for a short-term liquidity sweep on the upside.Ethereum and Solana showed similar behavior, with both assets attempting breakouts toward their respective range highs but failing to sustain follow-through. The quick rejections placed them back inside the same consolidation structures, keeping the neutral stance intact. Hyperliquid also respected the levels discussed previously, with price tapping the $30.64 support region which continues to hold for now (broken now). A confirmed break below that level would shift focus toward $28.39, keeping the neutral-bearish stance in play.
Overall, our stance remains unchanged from the previous analysis. The market continues to trade inside broader ranges with no confirmed directional breakout yet. Until we see a decisive move beyond these key levels, we will continue to treat this environment as range-bound and react to price action as it develops.
Continue reading by joining Cryptonary Pro
$1,548 $1,197/year
Get everything you need to actively manage your portfolio and stay ahead. Ideal for investors seeking regular guidance and access to tools that help make informed decisions.
For your security, all orders are processed on a secured server.
As a Cryptonary Pro subscriber, you also get:
3X Value Guarantee - If cumulative documented upside does not reach 300% during your 12-month membership, you can request a full refund. Terms
24/7 access to experts with 50+ years’ experience
All of our top token picks for 2025
On hand technical analysis on any token of your choice
Weekly livestreams & ask us anything with the team
Daily insights on Macro, Mechanics, and On-chain
Curated list of top upcoming airdrops (free money)
3X Value Guarantee
If cumulative documented upside does not reach 300% during your 12-month membership, you can request a full refund.
Our track record speaks for itself
With over 2.4M tokens and widespread misinformation in crypto, we cut through the noise and consistently find winning assets.
Our track record speaks for itself
With over 2.4M tokens and widespread misinformation in crypto, we cut
through the noise and consistently find winning assets.


Frequently Asked Questions
Can I trust Cryptonary's calls?
Yes. We've consistently identified winners across multiple cycles. Bitcoin under $1,000, Ethereum under $70, Solana under $10, WIF from $0.003 to $5, PopCat from $0.004 to $2, SPX blasting past $1.70, and our latest pick has already 200X'd since June 2025. Everything is timestamped and public record.
Do I need to be an experienced trader or investor to benefit?
No. When we founded Cryptonary in 2017 the market was new to everyone. We intentionally created content that was easy to understand and actionable. That foundational principle is the crux of Cryptonary. Taking complex ideas and opportunities and presenting them in a way a 10 year old could understand.
What makes Cryptonary different from free crypto content on YouTube or Twitter?
Signal vs noise. We filter out 99.9% of garbage projects, provide data backed analysis, and have a proven track record of finding winners. Not to mention since Cryptonary's inception in 2017 we have never taken investment, sponsorship or partnership. Compare this to pretty much everyone else, no track record, and a long list of partnerships that cloud judgements.
Why is there no trial or refund policy?
We share highly sensitive, time-critical research. Once it's out, it can't be "returned." That's why membership is annual only. Crypto success takes time and commitment. If someone is not willing to invest 12 months into their future, there is no place for them at Cryptonary.
Do I get direct access to the Cryptonary team?
Yes. You will have 24/7 to the team that bought you BTC at $1,000, ETH at $70, and SOL at $10. Through our community chats, live Q&As, and member only channels, you can ask questions and interact directly with the team. Our team has over 50 years of combined experience which you can tap into every single day.
How often is content updated?
Daily. We provide real-time updates, weekly reports, emergency alerts, and live Q&As when the markets move fast. In crypto, the market moves fast, in Cryptonary, we move faster.
How does the 3X Value Guarantee work?
We stand behind the value of our research. If the documented upside from our published research during your 12-month membership does not exceed three times (3X) the annual subscription cost, you can request a full refund. Historical context: In every completed market cycle since 2017, cumulative documented upside has exceeded 10X this threshold.
TermsRecommended from Cryptonary