Save 23% ($351) & Get a Free 1-1 Call with our Team ⏰ : 0d 2h 59m 45s
Disclaimer: This is not financial or investment advice. You are responsible for any capital-related decisions you make, and only you are accountable for the results.
BTC:
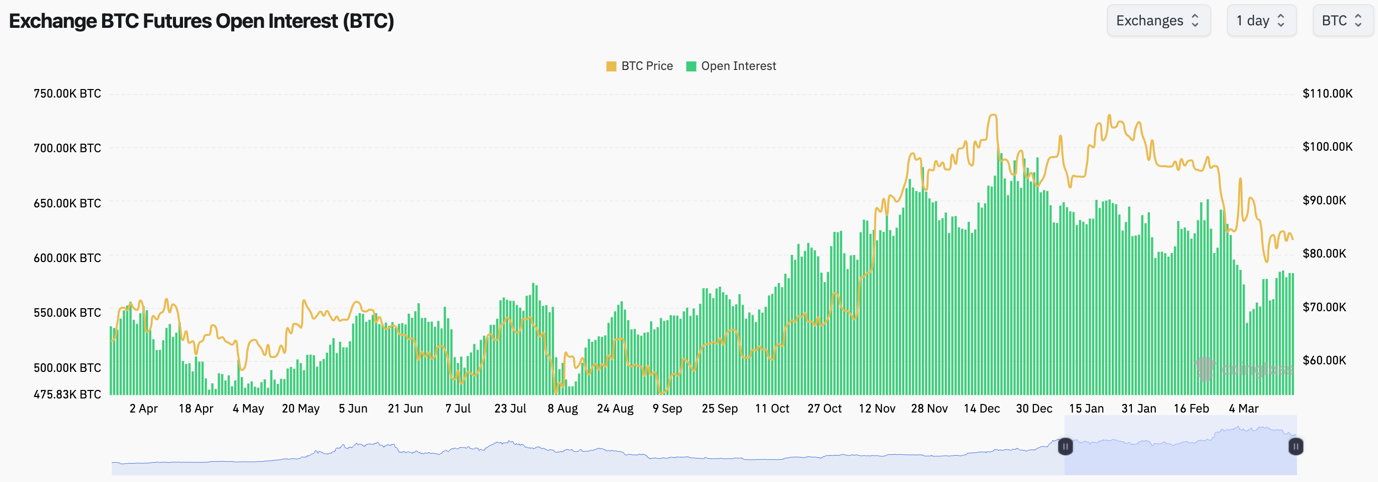
- BTC's Open Interest is up approximately 10% from the bottom, seen a few weeks ago. Although it still remains in a downtrend. This indicates that traders have less appetite to leverage trade BTC.
- Funding Rates are mostly flat, or fluctuating between slightly positive and negative. This suggests that there is indecision amongst traders.
Technical analysis:
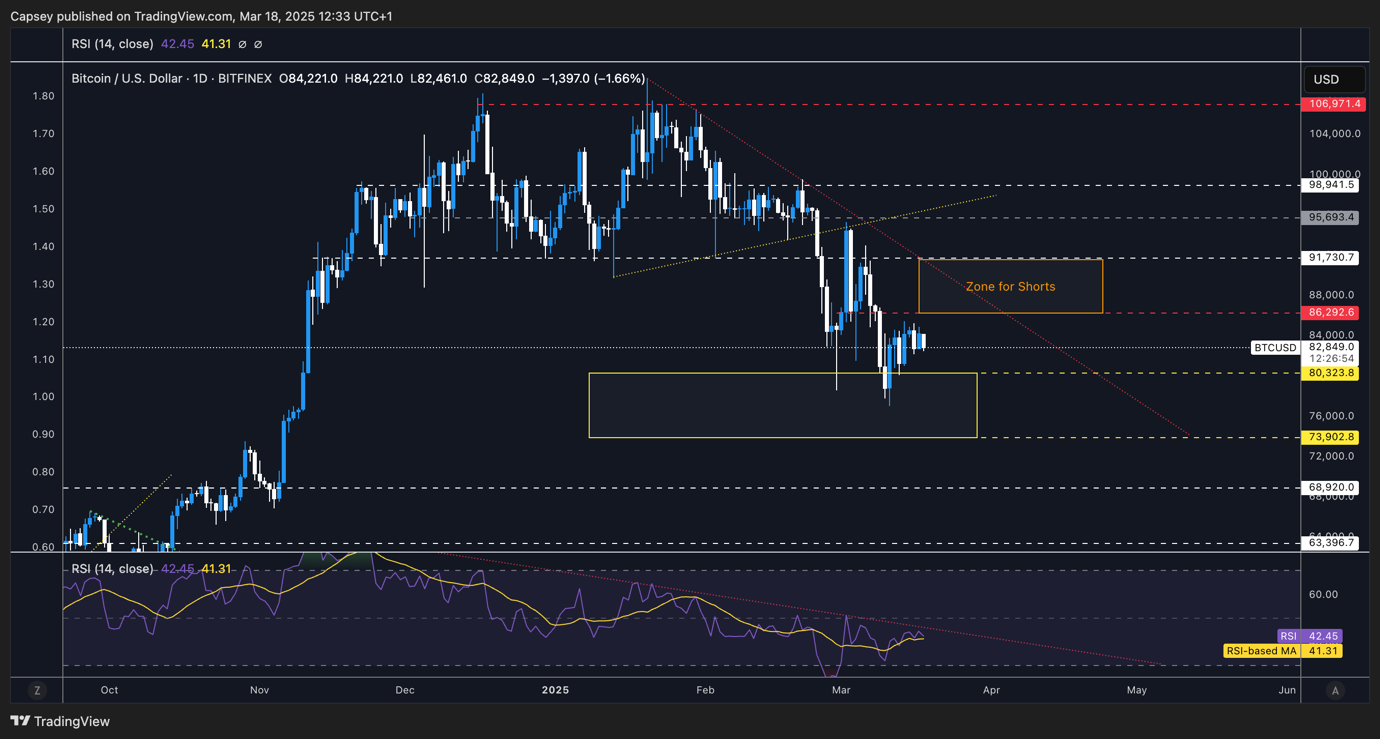
- Bitcoin has moved up from the lows, as we expected, following the bullish divergence that is being formed (lower low in price, higher low on the oscillator).
- Price has now bounced into the $85,000 to $86,300 range which is a resistance zone, and also a lower high.
- The zone of major resistance, and where we'd strongly consider Shorts, is between $86,300 and $91,700.
- The RSI remains in a downtrend, although it's not in oversold territory, whilst it's also sat on top of its moving average and potentially looking for a breakout in the short-term.
- On the downside, major support remains between $77,000 and $78,000. A loss of this zone and price likely dips into $72,000, the old horizontal resistance, now potentially new support.
- Next Support: $78,000
- Next Resistance: $86,300
- Direction: Neutral
- Upside Target: $86,300 to $89,000
- Downside Target: $78,000
Cryptonary's take:
Bitcoin has moved off of the local lows, having put in the bullish divergence. Price has now slowly moved up, and likely helped by the bounce in TradFi Index (SPX and NDX). In the short term (coming days), we do think the price can continue this slow grind higher.However, we still expect we're in a multi-month downtrend, and therefore, if the price were to move into the $86,300 to $91,700 zone, we'd look to layer Short orders in that range for a move back to $ 70k over the coming 2-4 weeks.
ETH:
- ETH's Open Interest has continued its grind higher, likely due to participants taking advantage of the 'carry' trade.
- ETH's Funding Rate is slightly positive, but it might be being compressed due to the 'carry' trade, so the fact it remains positive suggests there's likely more of a slight bias here amongst traders to be Long, at this moment in time.

Technical analysis:
- Key note; the chart below is ETH on the 3D timeframe, so much more zoomed out. And we'll look at it from that perspective to get a better gauge as to how to play it, and to help us identify key levels.
- ETH is essentially just above its major support at $1,745, with $1,530 the next key level.
- We don't expect $1,530 will be lost/broken to the downside.
- On the upside, ETH's horizontal resistance is at $2,160, and we think this can be retested at a major relief rally.
- ETH's RSI is very oversold, the most oversold it's been since mid 2022, yes, that's pre-FTX collapse.

- Next Support: $1,745
- Next Resistance: $2,160
- Direction: Neutral
- Upside Target: $1,960
- Downside Target: $1,545
Cryptonary's take:
In the short term, we expect ETH will be range-bound between $1,745 and $1,960. We expect a breakdown into the $1,500's is possible, but that might be a good long-term buying area.Over the coming weeks, and maybe months, we expect the price to be range-bound and then to put in a more meaningful bounce on the other side of Trump/administration uncertainty. That might take 1-3 months. But we're expecting a sideways grind before a move higher.
So, something similar to summer 2022. We'd look to bid into the $1,500's to then sell ETH at $2,160. That's the play we'd be looking at for ETH over the coming weeks/months. But, we do see $1,500's as a good long-term buying opportunity to then sell ETH later in the year or in early to mid 2026.
SOL:
- SOL's Open Interest has come down in USD terms but not so much in coin terms. This doesn't give us a clear trading signal.
- SOL's funding rate has been mostly negative over the last few days, showing traders are trying to Shorten these small bounces. This will likely set up a short squeeze at some point in the medium term. We wouldn't be looking for Shorts in SOL anytime soon - although that doesn't mean we're looking for Longs either.

Technical analysis:
- SOL is currently fighting at the main horizontal support of $120 which has been the major support for SOL throughout the last year.
- If the $120 horizontal support is lost, and we expect it will in the medium term, then the next key horizontal level is at $98.
- The RSI is out of oversold territory, and it put in a bullish divergence which is likely what has helped price move up very slightly.
- To the upside, the horizontal resistances are at $136 and $162, although we don't see $162 being retested anytime soon.

- Next Support: $120
- Next Resistance: $136
- Direction: Neutral/Bearish
- Upside Target: $136
- Downside Target: $98
Cryptonary's take:
SOL has moved into the mid-$130's and rejected there. It's currently battling at the $120 horizontal support, and the price will need to hold that level, or it risks moving down to $98. $98 is where we'd start looking to bid. If we're right, then this might take more time to play out, potentially weeks.However, $98 seems like it would be good, at least for a meaningful bounce play, if not long-term buys. For now, we'll remain patient, and we'll bid SOL if it moves down to $98. We expect in the short-term that the price just grinds between $120 and $136 before it breaks down to $98. This'll likely come on BTC's next big breakdown.
HYPE:
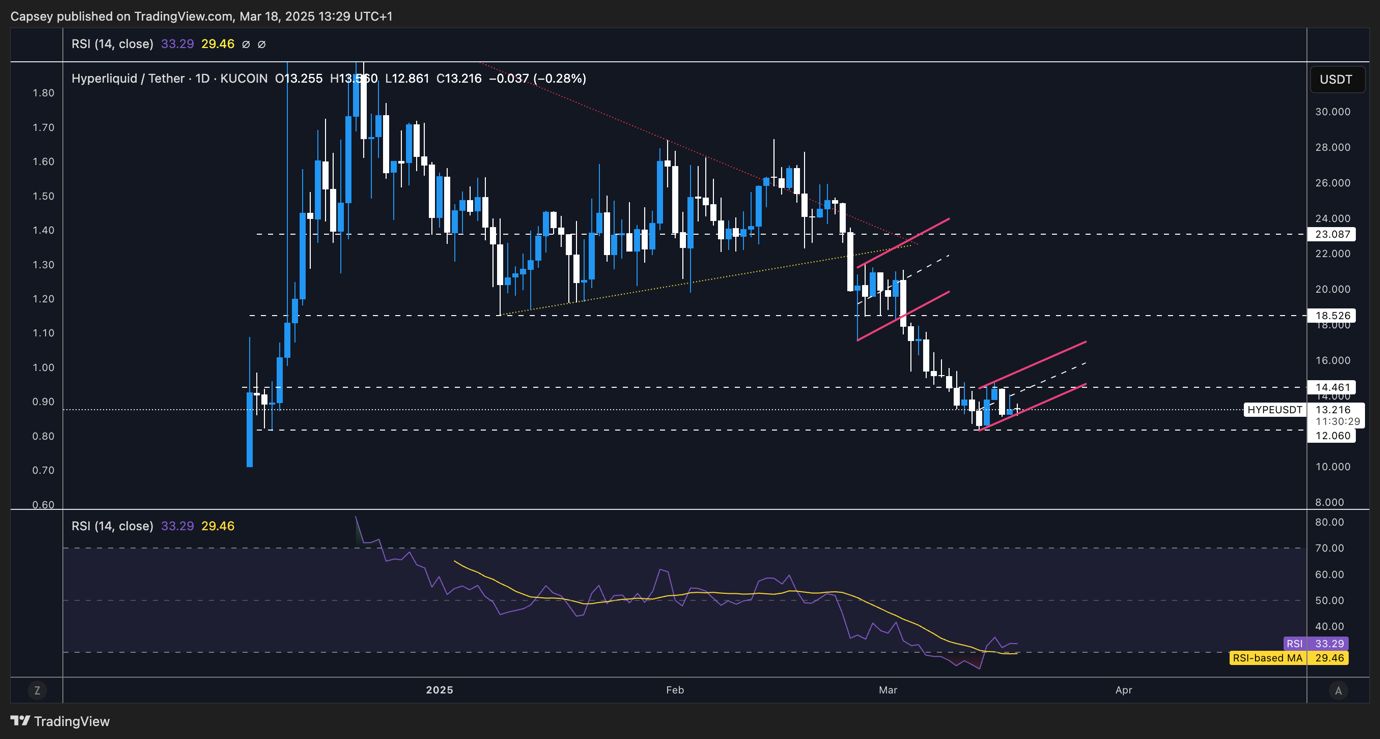
- Following the breakdown of the bear flag, HYPE has pulled back to the range between $12.00 and $14.50.
- Price has remained range bound in this now lower range, and price looks as if it's potentially now forming another bear flag. However, this is less definitive than the first one. Invalidation of this would be a break above $15.50.
- If the bear flag does break down, this would have a target of $9.00.
- One positive is that the RSI is climbing out of oversold territory, and it's now above its moving average. This might help to take the price back to the horizontal resistance of $14.50 in the immediate term.
- A breakout above $15.50 would invalidate our bearish stance in the short-term on HYPE, and a breakout target would be $17.00.
- Next Support: $12.00
- Next Resistance: $14.50
- Direction: Neutral/Bearish
- Upside Target: $15.50
- Downside Target: $9.00
Cryptonary's take:
In the immediate term, we expect HYPE to remain range-bound between $12.00 and $14.50. However, we do see, in the medium term, HYPE breaking down, below $12.00, and potentially testing $9.00.For now, we're not looking for shorts unless there is a breakout and the price pushes into $18.00. Longer-term buys will become more attractive upon a breakdown from $12.00, but we'll reassess that if we're right and this plays out.
Recommended from Cryptonary


