Save 23% ($351) & Get a Free 1-1 Call with our Team ⏰ : 0d 2h 59m 43s
Disclaimer: This is not financial or investment advice. You are responsible for any capital-related decisions you make, and only you are accountable for the results.
BTC:
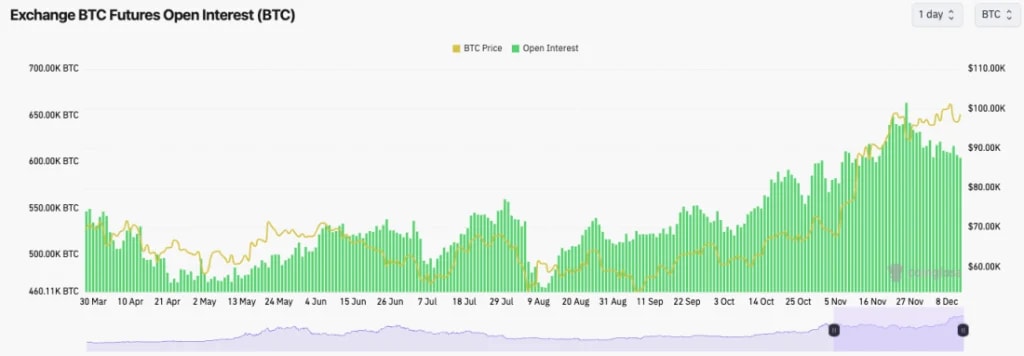
- BTC's Open Interest has pulled back by 10% over the last week. This reset was needed.
- Funding rates have also returned to normalised levels (around 0.01%), having been at extremely elevated levels a week or so ago.
Technical analysis
- Quite messy price action and technical analysis here, to be honest.
- We had the deleveraging event for BTC last week, and since then, the price has recovered, having tried a run back to the highs but ultimately rejected.
- Locally, we now see $94,100 to $95,700 as a new local support zone.
- The main horizontal resistance remains at an all-time high at $104,000. However, there is now also a local resistance at $101,500.
- The last week of price action has seen the RSI meaningfully reset, and it is now not very close to overbought territory.
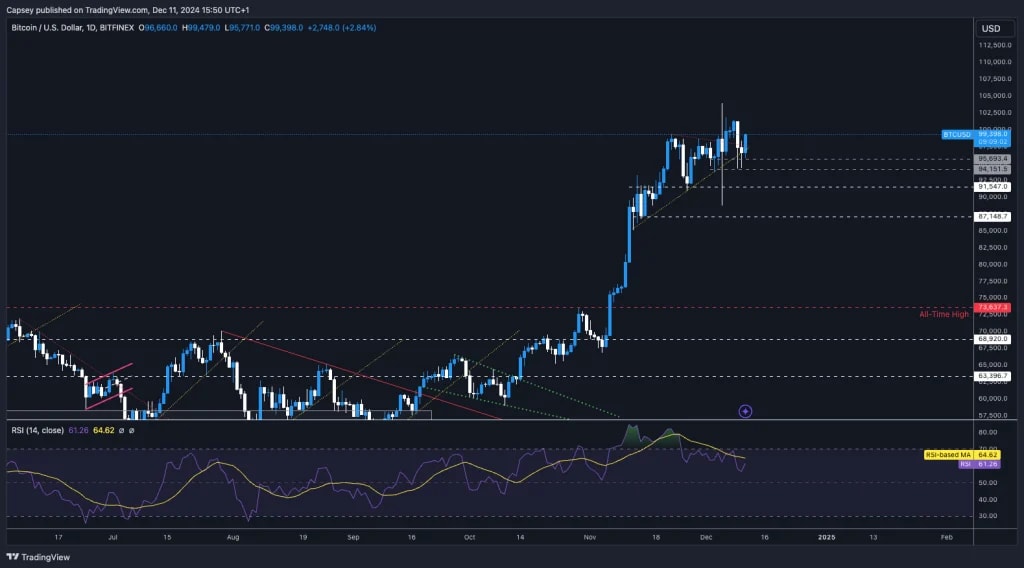
- Next Support: $94,150
- Next Resistance: $101,500
- Direction: Bullish
- Upside Target: $104,000
- Downside Target: $94,150
Cryptonary's take
After the deleveraging events we've seen recently, it may take more time for confidence to come back in. But, as a minimum, we're expecting the price to be range-bound here for more days/a week. Although, we do think the next major move will be higher and a breakout to the upside. If we do see a further period of consolidation, we wouldn't see this as a bad thing. We look at the current setup very positively.BTC is at $99,300 (a 5% move from all-time highs) and it is following a major leverage flushing out. This looks really healthy and clean to us here. We're expecting higher either this weekend or next week. The only thing to keep in mind with trading going forward is next week's FED Meeting on the 18th.
ETH:
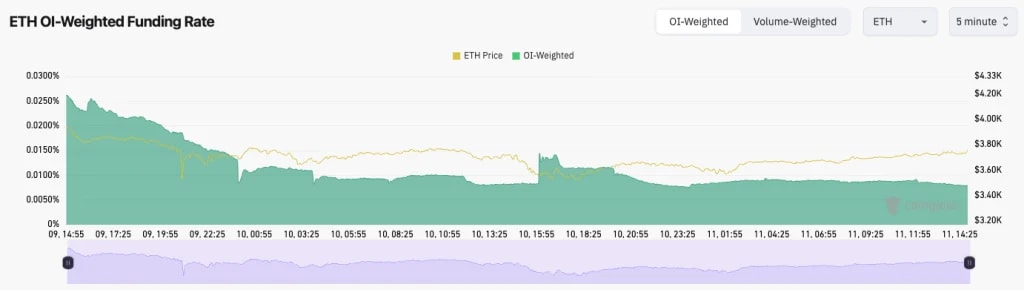
- ETH's Open Interest still remains high and hasn't seen as much of a flush out.
- ETH's Funding Rate has pulled back substantially from 0.03% to just 0.01% in the last 48 hours. So we've seen some flush out of excess Longs.
Technical analysis
- Really clean price action.
- Price was in a really clean uptrend and rejected at the main horizontal resistance at $4,000.
- The price then broke below the main uptrend line and swiftly revisited the main horizontal support at $3,480, where the price bounced perfectly.
- Price is now out of the main uptrend, so therefore, the underside of the uptrend line and the horizontal resistance of $4,000 will act as strong resistance.
- The RSI has also pulled back to 58, which is close to middle territory and nowhere near being overbought.
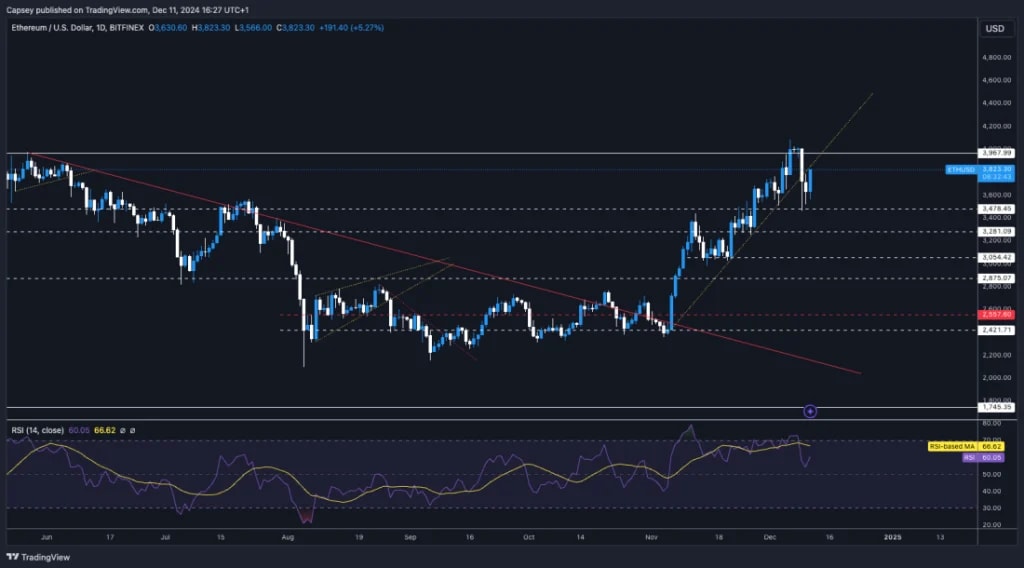
- Next Support: $3,480
- Next Resistance: $4,000
- Direction: Neutral/Bullish
- Upside Target: $4,000 (then $4,500)
- Downside Target: $3,480
Cryptonary's take
ETH is now out of its main uptrend, so it's possible we will see a further period of consolidation below $4,000. The bullish reversal will come upon a breakout of $4,000, so that's what we'd be waiting for. We expect this might take another week or so, and ETH might require patience here. For now, we continue to hold ETH, and we're not looking to make any changes.SOL:
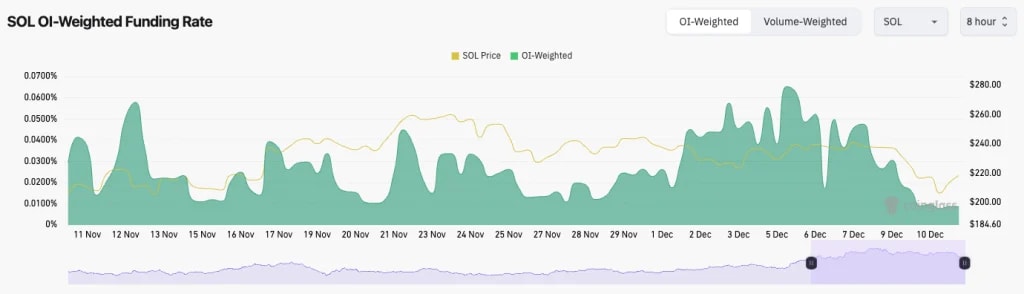
- SOL's Open Interest has pulled back by 12%, so we have seen a deleveraging here, which is good.
- SOL's funding rate has reset substantially, having been at 0.07% 5-6 days ago, and is now back to a healthy level of 0.01%. This indicates that over-levered Longs have been flushed or closed out.
Technical analysis
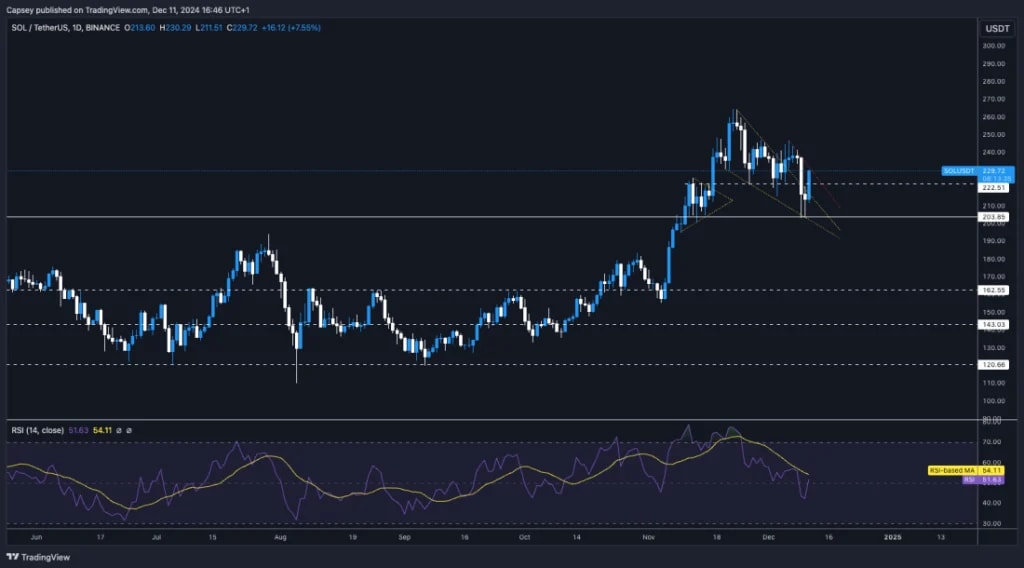
- SOL attempted a breakout of its descending wedge, and unfortunately, the leverage flush outcome and the price swiped down to the major support of $203.
- The price bounced at $203, and it is now trying to reclaim back above the local horizontal level of $222. However, it is also meeting the underside of a local downtrend line.
- The RSI has also pulled back substantially, and it's in the middle territory, but it does remain beneath its moving average. We'd be looking for it to flip that and turn the MA into support.
Stay updated on Solana price prediction—explore our full analysis for the latest market insights.
- Next Support: $200
- Next Resistance: $250 - $260
- Direction: Neutral
- Upside Target: $300 (then $330)
- Downside Target: $200
Cryptonary's take
It's possible that the price is rejected at these local levels here and retests the $210 to $220 area. But, if the price does retest this area, we'd expect it to be bid up quite heavily. We believe it's only a matter of time before SOL breaks out of these local downtrends, flips the $250-$260 level, and $300 to $330 is achieved relatively swiftly.We're not sure when that might be, and we're expecting more chop in the coming days/week. But, we're holding all SOL and we're looking to sell it at prices much higher than current prices.
WIF:
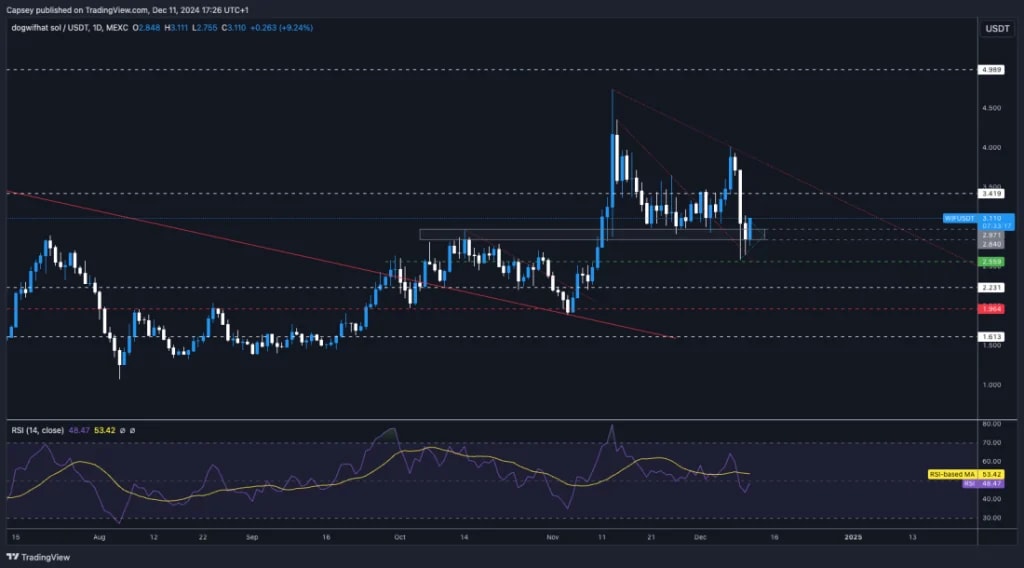
- Following the leverage flush out, WIF fell down to a major horizontal support of $2.55 and bounced from there.
- Price is now battling at the grey support between $2.84 to $2.97 and forming a pennant pattern. The bias of this breakout might be to the downside, but we'd expect the $2.80's to be swiftly bought up if the price revisits there. Although we're not super confident that the pennant will break down, we wouldn't be surprised if the positive market momentum can take the price higher.
- The main level to the upside for the price to overcome is $3.40. This may take more time to achieve, though.
- The RSI is back to middle territory, having tried to break out to the upside on the move to $4.00.
Don't miss the latest dogwifhat (WIF) price prediction. Explore our insights to stay ahead in the crypto market.
- Next Support: $2.80
- Next Resistance: $3.40
- Direction: Neutral
- Upside Target: $3.40 (then $4.00)
- Downside Target: $2.80
Cryptonary's take
We remain phenomenally positive on WIF, and whilst it might take more time (days/to a week) to establish a new range, potentially between $3.00 and $3.40, we do expect a major breakout in the coming weeks.In the medium and long term, we still expect WIF to break down to new all-time highs and test the $10 area, maybe in Q1 2025. We remain holding spot positions, and we're not looking to sell, so we may consider adding between $2.55 and $2.80 if the price revisits there.
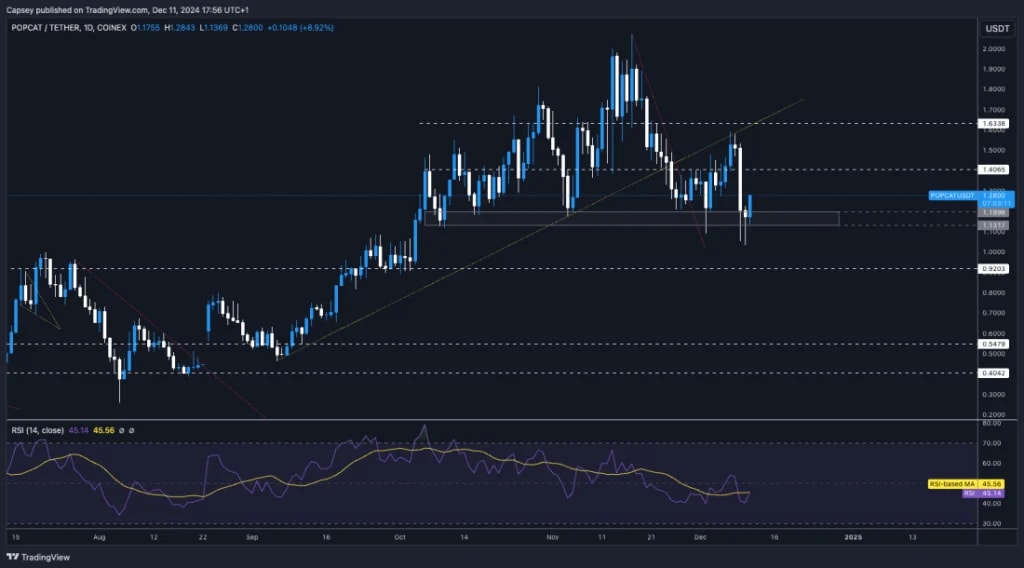
POPCAT:
- Unfortunately, the price rejected perfectly from the underside of the uptrend line, and the price declined by 35%.
- POPCAT is one that we have unfortunately got wrong recently, as we didn't expect the drawdown that was experienced.
- Price found liquidity between $1.00 and $1.10, which used to be a prior horizontal resistance back in late September.
- Price is now attempting a bounce with the next major horizontal resistance overhead at $1.40. Beyond $1.40, it's $1.60.
- We would expect new support going forward to be the grey box between $1.13 and $1.19.
- The RSI has been at low/mid levels for some time now, and we do have a new hidden bullish divergence despite the old one not playing out.
Looking for an accurate POPCAT price prediction? Read our analysis to know what's next for POPCAT!
- Next Support: $1.10
- Next Resistance: $1.40
- Direction: Neutral
- Upside Target: $1.40 (then $1.60)
- Downside Target: $1.10
Cryptonary's take
POPCAT is likely to take more time here before it starts performing well again. This is simply due to the chart structure now being broken, which takes time to repair and recover. However, price-wise, POP did look very attractive yesterday in comparison to other major memes, and that's the first thing that will get new buyers back in.Overall, this is likely to take more weeks (which is fine, and it's similar for other coins), but we still remain very constructive for POPCAT. We hold all Spot POPCAT, and we're not looking to sell anytime soon.
SPX:
- The SPX chart is playing out as we predicted and it now looks really positive.
- Price has cleanly broken out of the main downtrend line, but it is now butting into the main horizontal resistance zone between $0.72 and $0.75.
- We're expecting a breakout for SPX imminently with a swiftly achieved short-term target of $0.90.
- To the downside, from here and in the short-term, we'd expect $0.65 to $0.72 to hold as support for price.
- We also noticed in the last few days, volumes have picked up slightly, which is a positive development.

- Next Support: $0.65
- Next Resistance: $0.75
- Direction: Bullish
- Upside Target: $0.90 (then $1.00)
- Downside Target: $0.65
Cryptonary's take
Simply put, SPX looks set for higher here. It's a coin that we called perfectly on the mega move higher, then for the check back into the $0.45 to $0.50, and now for the breakout higher. We're expecting $0.90 to $1.00 to be achieved in the coming week.Recommended from Cryptonary


