Save 23% ($351) & Get a Free 1-1 Call with our Team ⏰ : 0d 2h 59m 44s
BTC, ETH, SOL, and memes are soaring!
Bitcoin ($BTC) remains resilient at nearly $90K, Solana ($SOL) sees explosive growth, and Ethereum ($ETH) resets. Meanwhile, meme coinsnWIF, POPCAT and SPX attract attention with key levels. Let’s analyze what’s driving the market.
Disclaimer: This is not financial or investment advice. You are responsible for any capital-related decisions you make, and only you are accountable for the results.
BTC:
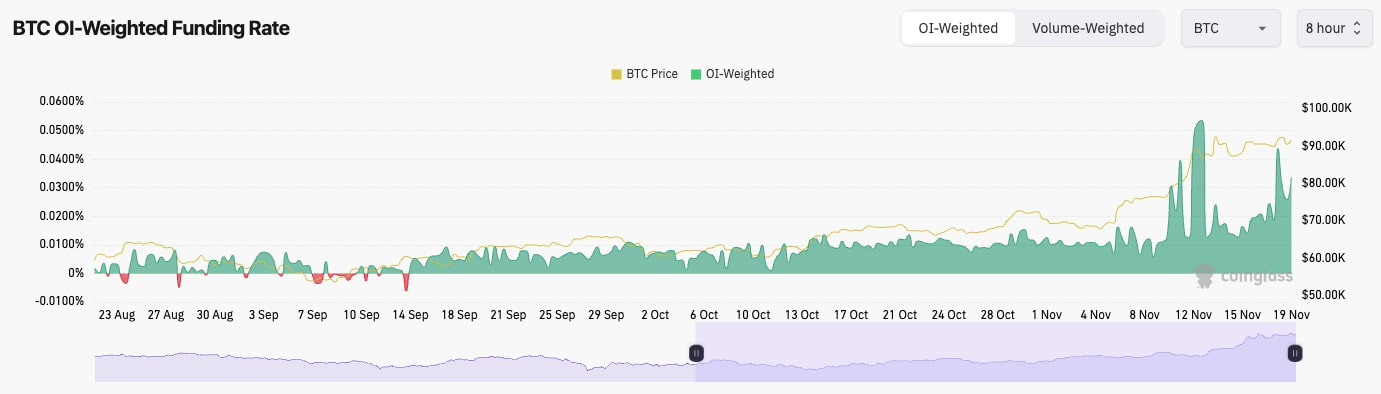
- BTC's Open Interest (in USD value) is massive. In the last three weeks, OI has increased by 43%. But, the BTC price has increased by 50% since one month ago.
- The Funding Rate is creeping higher again. For now, it's still ok. But, if it were to rise substantially further, then this may result in a leverage flush out with the price falling. When this happened a week ago, the price went from $92k down to $87k. So, not that bad, really.
Technical analysis
- BTC has managed to remain around its highs in the low $ 90k range, which is impressive considering the size of the rally from the late $ 60k.
- Price is holding its local uptrend line, but currently, it's finding the $93,000 level as a horizontal resistance.
- Price has used the $87,100 area as support, so that'll be the first area to watch on a possible price breakdown.
- Beneath $87,000, the levels are tricky to identify. But, if the price does fall below $87k, we'd expect $82k to be the support.
- The RSI has remained in overbought territory, and it is currently printing a bearish divergence (higher high in price, lower high on the oscillator). In the euphoria phases of the market, BTC can shake off bearish divergences, but we would be somewhat wary of this one.
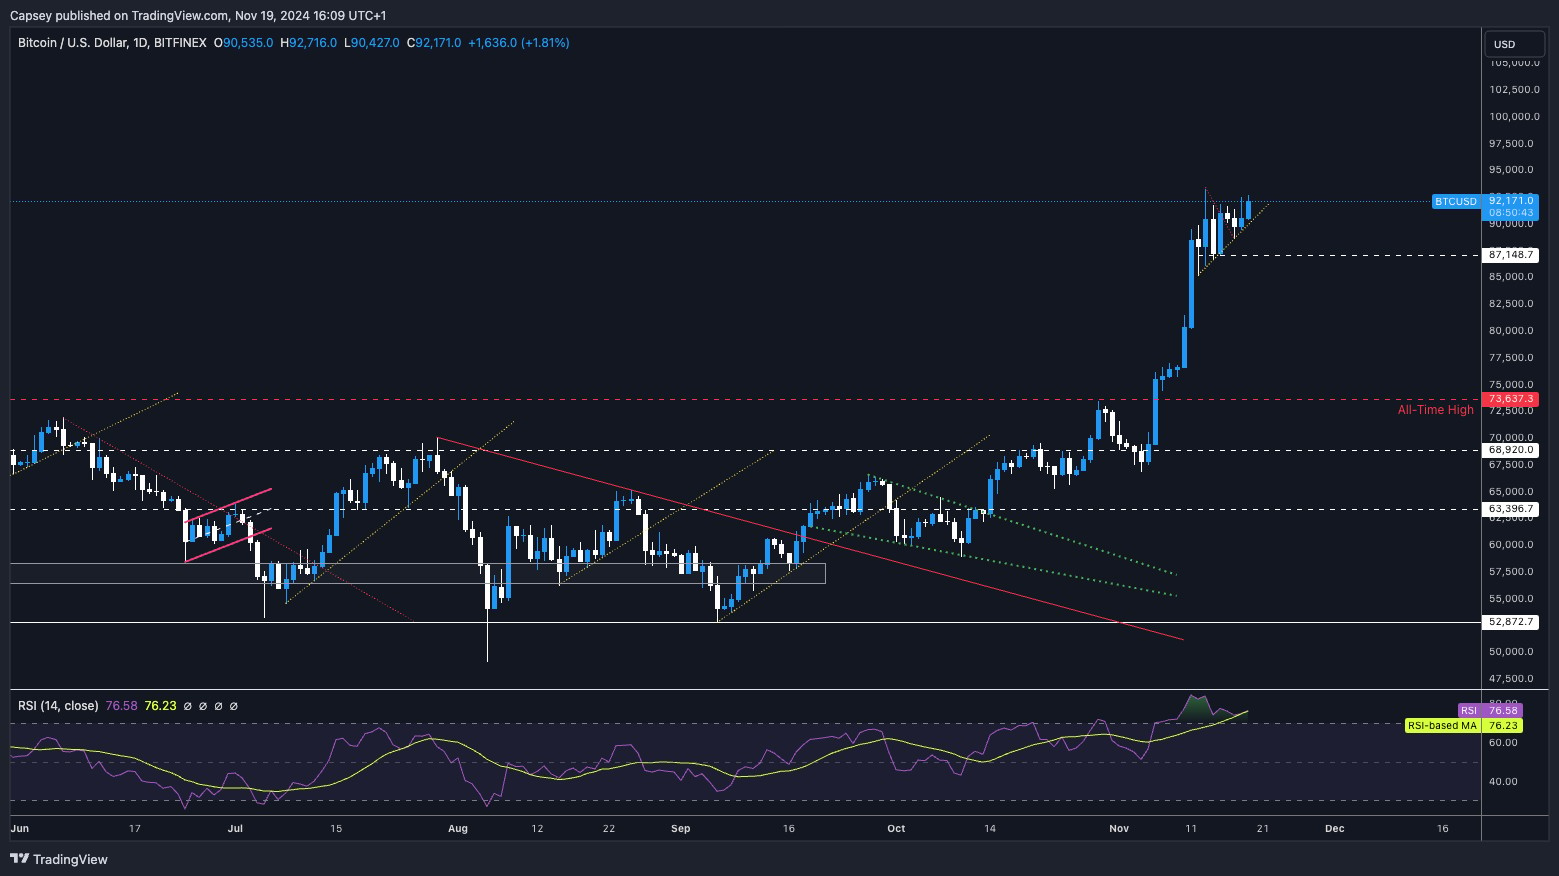
- Next Support: $87,000
- Next Resistance: $93,000
- Direction: Neutral
- Upside Target: $100,000
- Downside Target: $87,000
Cryptonary's take
Price has had a mega move up, and with Open Interest and Funding where it is, we wouldn't be surprised to get some sort of flush out to the downside. However, if we did, we'd expect it to be shallow. On the other hand, we do believe BTC is in the "euphoria phase" of the market, and these moves higher can just continue.Therefore, we remain bullish in the medium term, and we continue holding all spot positions. However, we're open to the idea that there may be a 5-10% pullback in the short term. But we're not super confident about this, and we wouldn't sell Spot bags with the aim of re-buying them at a lower price. Retail participants are beginning to come in, and that can just continue to push prices higher for now, so we wouldn't be surprised to see BTC continue to increase.
In short, we're in a bullish environment, but it's possible we're slightly over-extended in the very short term. We're super bullish on all other timeframes, and it's also possible that BTC will just continue to rip in the immediate term. No plans to sell anytime soon.
ETH:
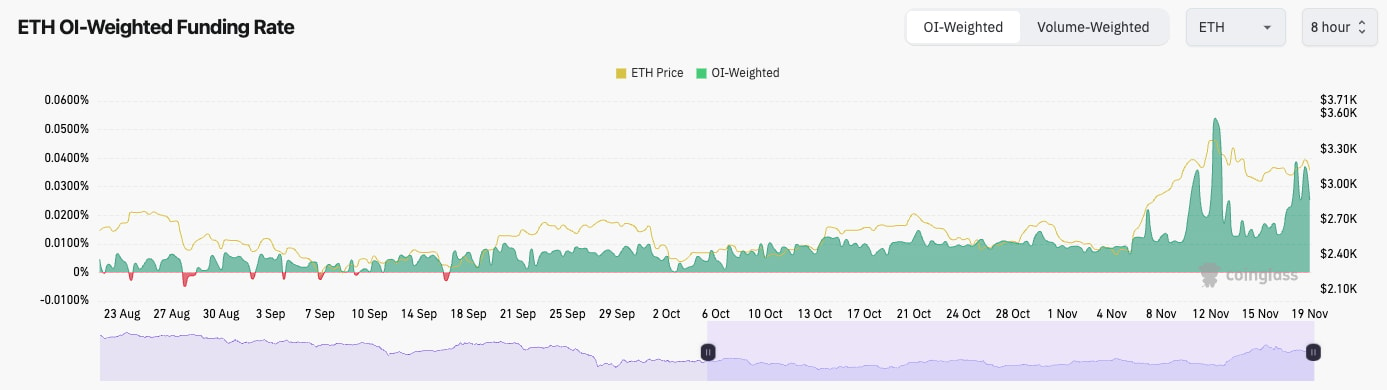
- ETH's Open Interest remains at very high levels.
- The funding rate has also increased more meaningfully.
- The leverage market as a whole is quite overheated here, and therefore, a flush out to the downside may be on the cards.
Technical analysis
- Since rejecting the $3,400 level, ETH has pulled back to the psychological level of $3,000, but it has managed to bounce from there.
- However, ETH is now forming a bear flag, which would have a breakdown target of somewhere between $2,875 and $3,000. It's possible that the $3,000 psychological level can be held as support if there is a breakdown for price.
- The RSI has pulled back meaningfully from overbought conditions, and it's now back to a more middle territory of 58. This is a healthy reset.
- To the upside, the key levels for the price to reclaim are $3,280 and then $3,480. A break above $3,480 and ETH will likely swiftly move on to $4,000.

- Next Support: $3,000
- Next Resistance: $3,280
- Direction: Neutral/Bearish
- Upside Target: $3,480
- Downside Target: $3,000
Cryptonary's take
Other than BTC, most of the market is seeing a slight pullback here, including ETH. Whilst ETH is set up bearishly in the immediate term, we're still very bullish in the medium and long term. Therefore, if ETH does move down to $3,000, this may be a good level to add buys, particularly if there is a move into the $2,875 area.Bearish to neutral in the immediate term. Bullish beyond that.
SOL:
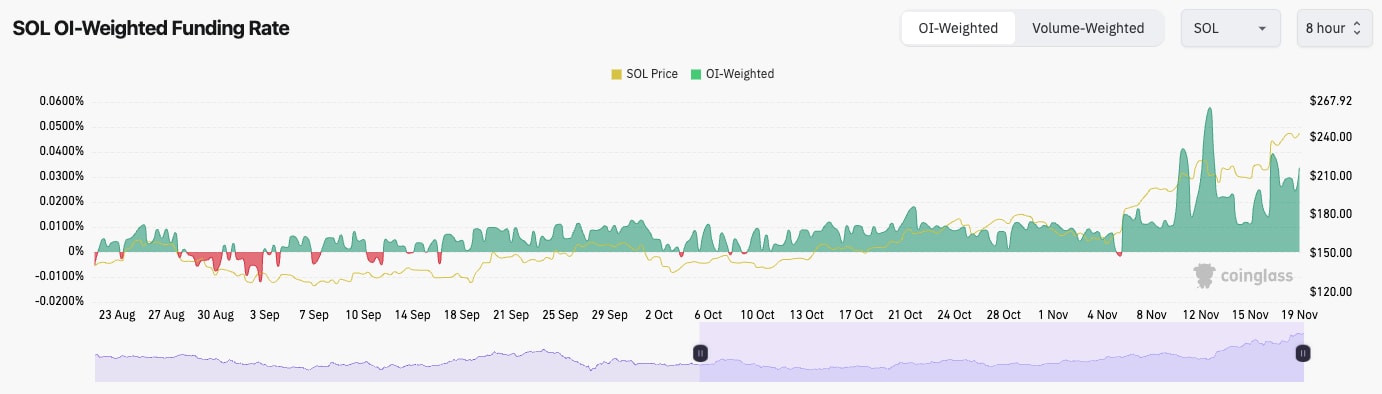
- SOL's Open Interest is also at record highs in USD value. This is mostly due to the rising price of SOL; however, open interest by the number of coins is also at highs.
- SOL's Funding Rate is also kicking higher. It's not quite as overheated as it was a week ago, but it's up, and it's moving in that direction. If this increases more substantially, then it's possible we will see a leverage flush out.
Technical analysis
- As we expected and called for the bullish pennant to use the horizontal support of $103 to bounce from, the price broke out of the pennant to the upside.
- Price has now increased by 52% in just less than 2 weeks. This is a large move in a short period of time.
- Price is currently quite overheated, and we can see this in the RSI, which has put in a bearish divergence (higher high in price, lower high on the oscillator) in overbought territory.
- The area between $245 and $260 is a resistance area for price.
- If there is a price pullback, we'd expect $203 to $220 to act as a major support zone.
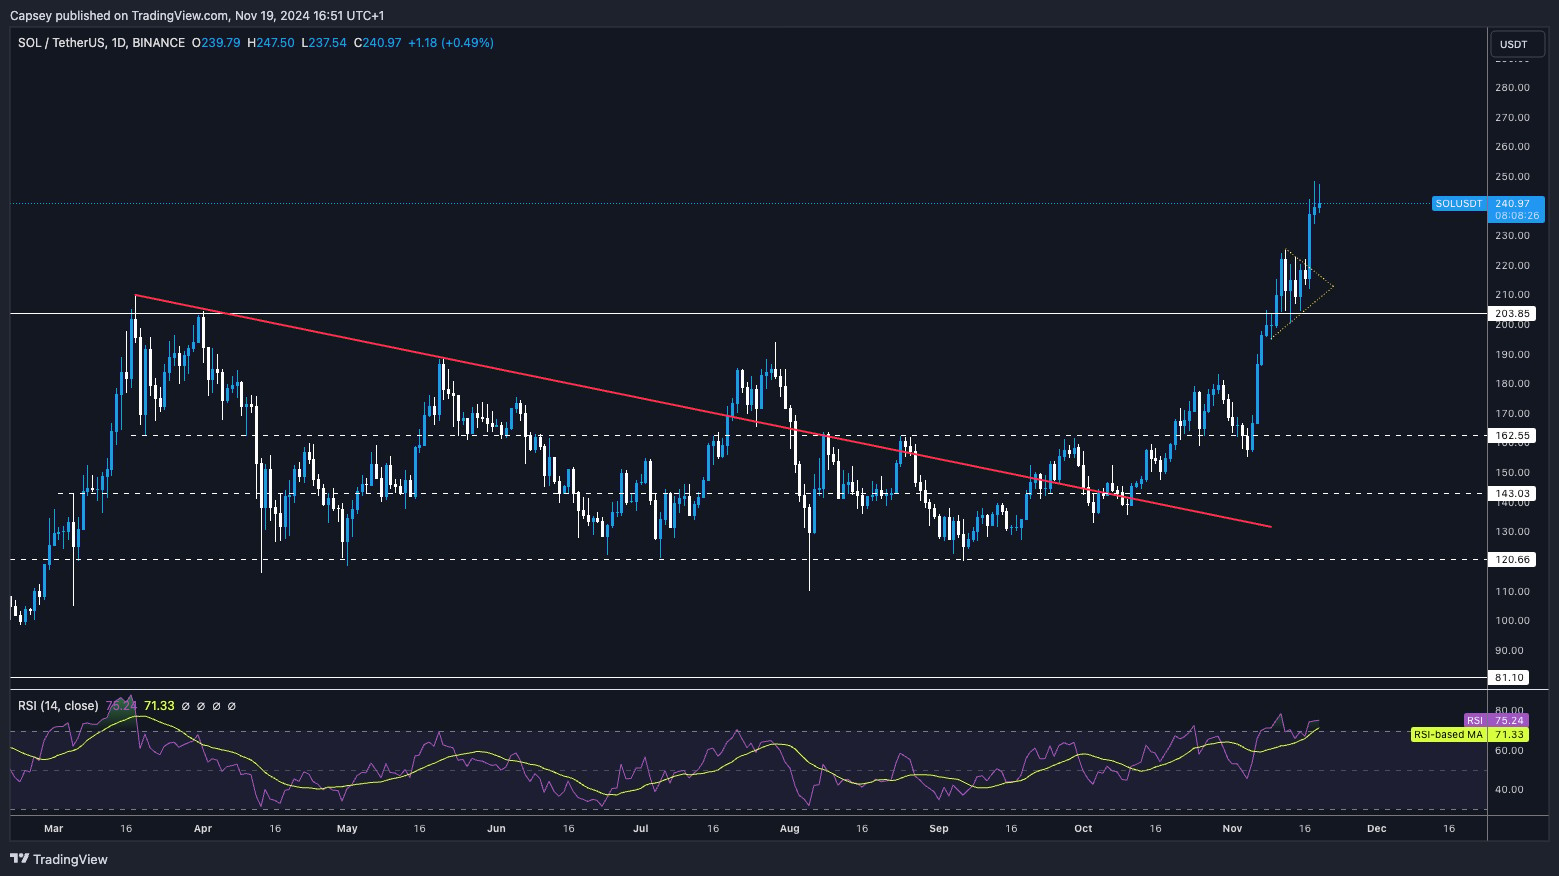
- Next Support: $220
- Next Resistance: $260
- Direction: Neutral/Bearish
- Upside Target: $260
- Downside Target: $220
Cryptonary's take
Price has made a mega move over recent weeks, and indicators are overheated here, so we wouldn't be surprised to see a pullback because of this. However, because the market is in a bull phase, we wouldn't look to sell our SOL here, even with the intention of buying back cheaper. It's very possible the market will continue to rip despite these overextended conditions. Therefore, we remain in all Spot positions.WIF:
- Price rejected the major horizontal resistance at $4.80 and has since pulled back and retested the horizontal support of $3.40 a number of times.
- The price is in a local downtrend, and it's now squeezing against the downtrend line while holding the horizontal support of $3.40. A breakout would see the price revisit $4.00.
- If the price does break down, $3.00 is likely to be the major support.
- The RSI was very overextended and in overbought territory upon the move up to $4.80. It has now reset back to middle territory at 61. This is positive, and WIF has now had some consolidation, which was needed following the move higher.
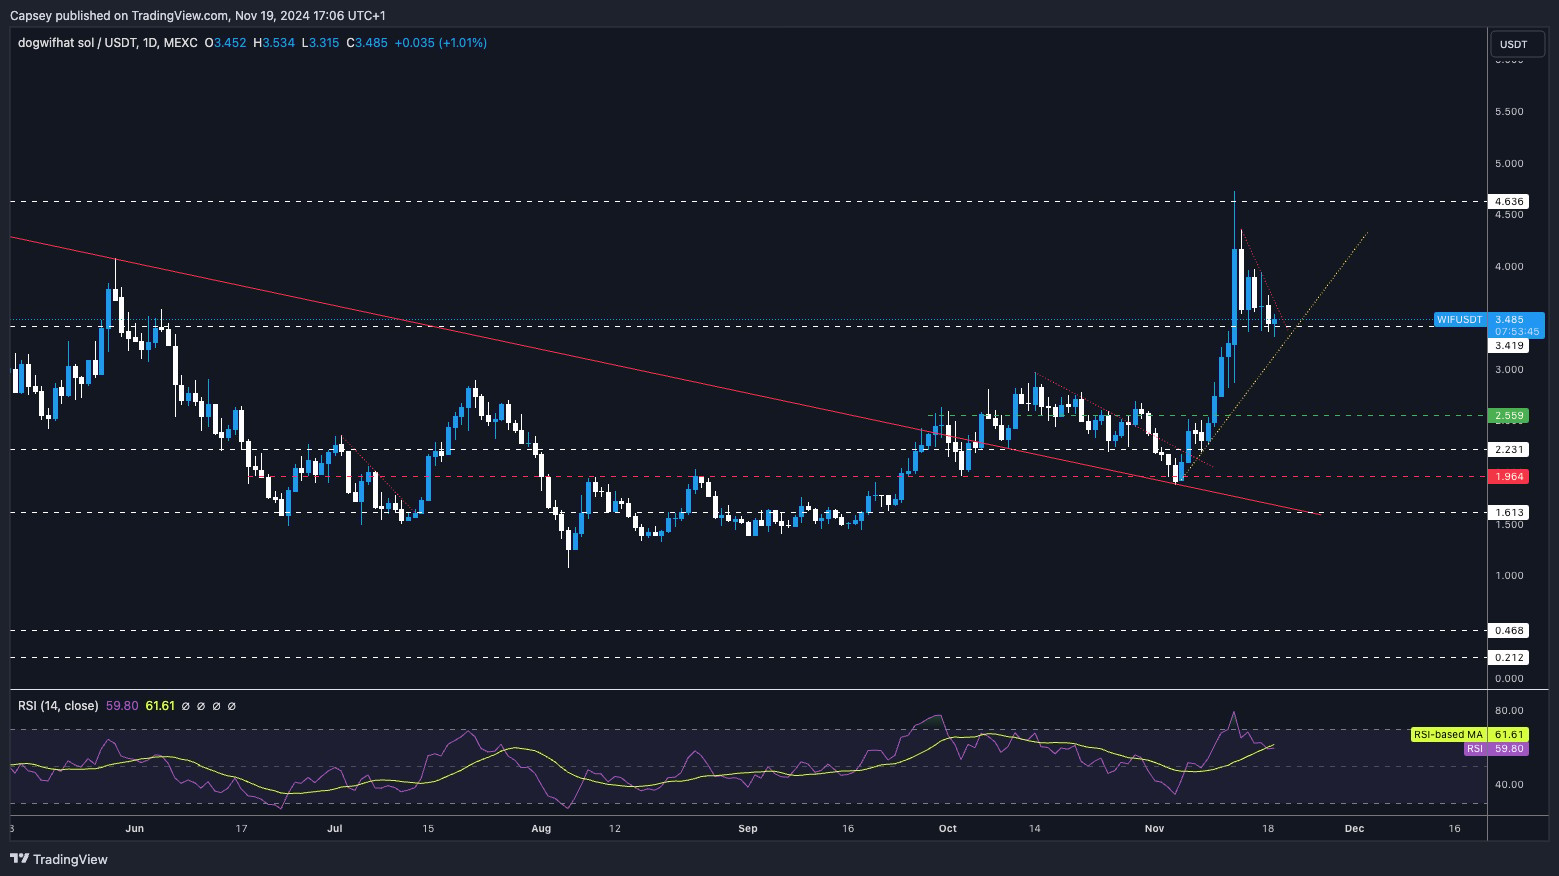
- Next Support: $3.40
- Next Resistance: $4.00
- Direction: Bullish
- Upside Target: $4.00
- Downside Target: $3.00
Cryptonary's take
WIF has pulled back and consolidated nicely after it's a major move higher. WIF has now found support at $3.40, and it's squeezing into its downtrend. This might be where WIF can get its breakout to the upside, and we see a more sustained move higher. Breakout targets would be $4.00 and then $4.80. We're looking to continue holding all Spot bags and not looking to sell anytime soon.POPCAT:
- POPCAT has now consolidated into a range just shy of its highs, between $1.63 and $2.00.
- If there is a breakout to the upside for POP, the target is likely in the mid $2's now following this longer consolidation period between $1.60 and $2.00.
- If we then look at the RSI, it's in the middle territory at 57, so nowhere near overbought. This is due to the fact we haven't had a parabolic move higher yet.
- Chart patterns/formations are messy. However, it does look as if POP is forming a bullish pennant. The breakout target would be $2.40.
- On the downside, we'd expect $1.60 to be the local support and $1.40 to be the major support if $1.60 is lost.
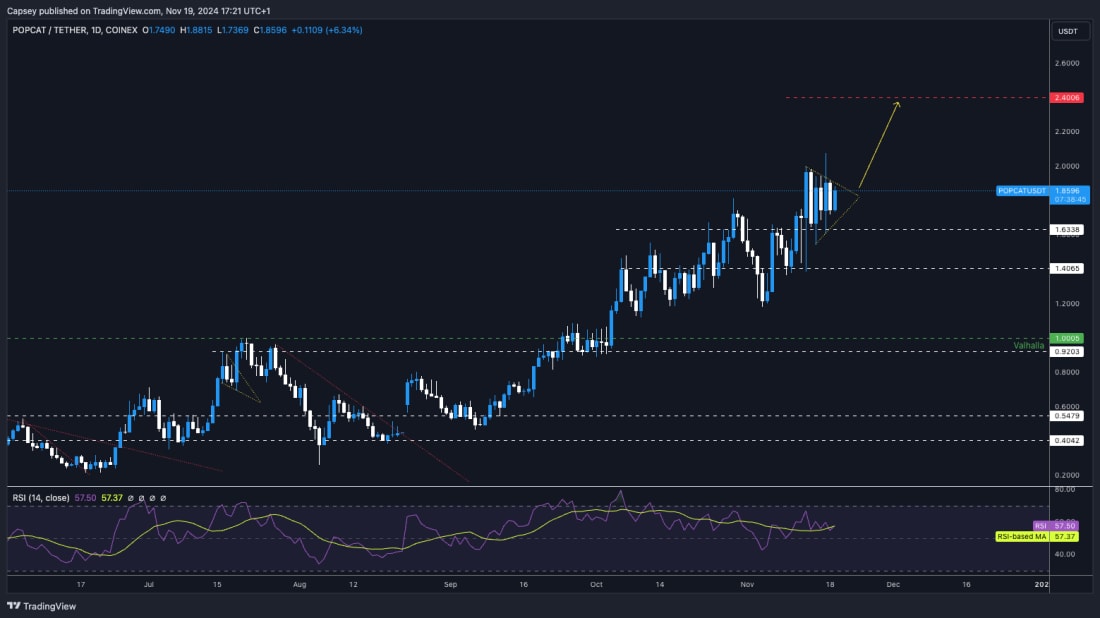
- Next Support: $1.60
- Next Resistance: $2.00
- Direction: Bullish
- Upside Target: $2.40
- Downside Target: $1.40
Cryptonary's take
SPX:
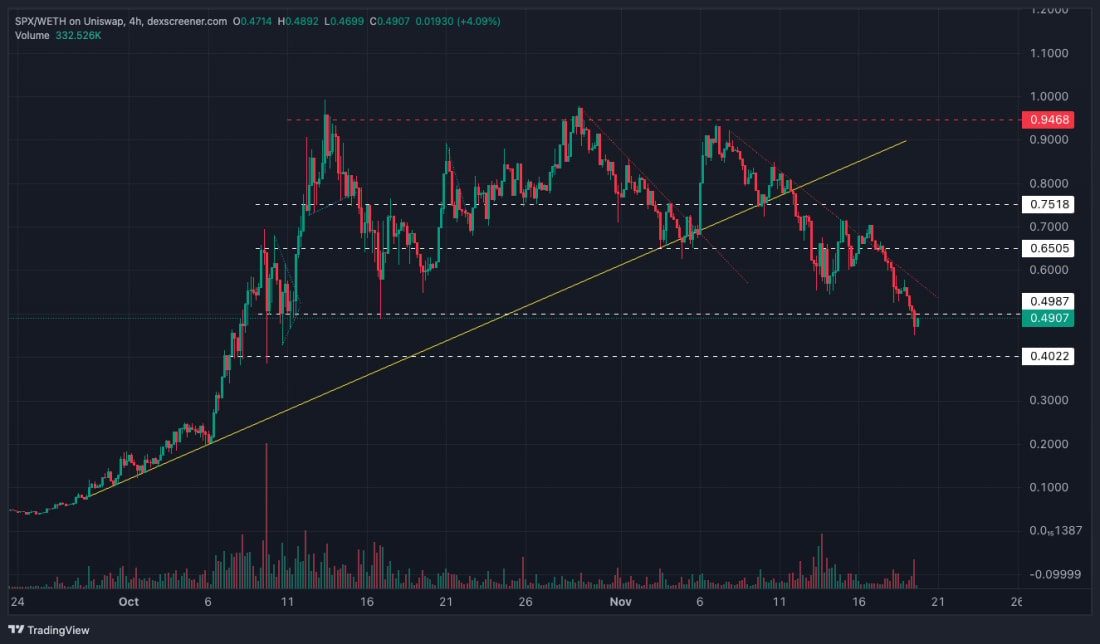
- Key horizontal levels were lost, and SPX has continued its downtrend.
- Price is now beneath the $0.49 horizontal support with the $0.40 support in sight.
- This downtrend has been quite strong, but this is becoming overextended to the downside here. We'd expect a bottom either here or close to $0.40, assuming this level gets tested. We're not ultra-confident. It does get tested.
- The key levels for the price to reclaim to the upside are $0.49 and then $0.65.
- Next Support: $0.40
- Next Resistance: $0.49
- Direction: Neutral/Bullish
- Upside Target: $0.65
- Downside Target: $0.40
Cryptonary's take
This move lower was to be expected. 6 weeks ago, we had max hype around this coin, having run 100x. Early buyers would have been making major profits, so there's always going to be that element of locking profits in. You then also need much larger capital to come in to keep prices high. However, the downtrend has been extreme, although it is typical of memes (WIF, POP included), so it's possible SPX may be reaching or potentially close to a bottom. We're thinking $0.40 to $0.49 is the bottoming area. For those looking to pick up a new position in SPX, between $0.40 and $0.49 is possibly a good area to do so.Recommended from Cryptonary


