Save 23% ($351) & Get a Free 1-1 Call with our Team ⏰ : 0d 2h 59m 44s

Disclaimer: This analysis is for informational purposes only and not financial advice.
TLDR:
- BTC: Rejected at $117k, now holding key support at $110k–$112k; structure remains bullish above this zone despite altcoin-led sell-off.
- ETH: Broke below its main uptrend line, hovering between $3,970–$4,770; reclaiming $4,340 or $4,500 is key for recovery.
- SOL: Pulled back from $250 to $212, defended $209 support; reclaiming $222 would reopen the path to $260.
- HYPE: Dropped below $49 but found support at $45.8; reclaiming $49 could fuel a move to $57.
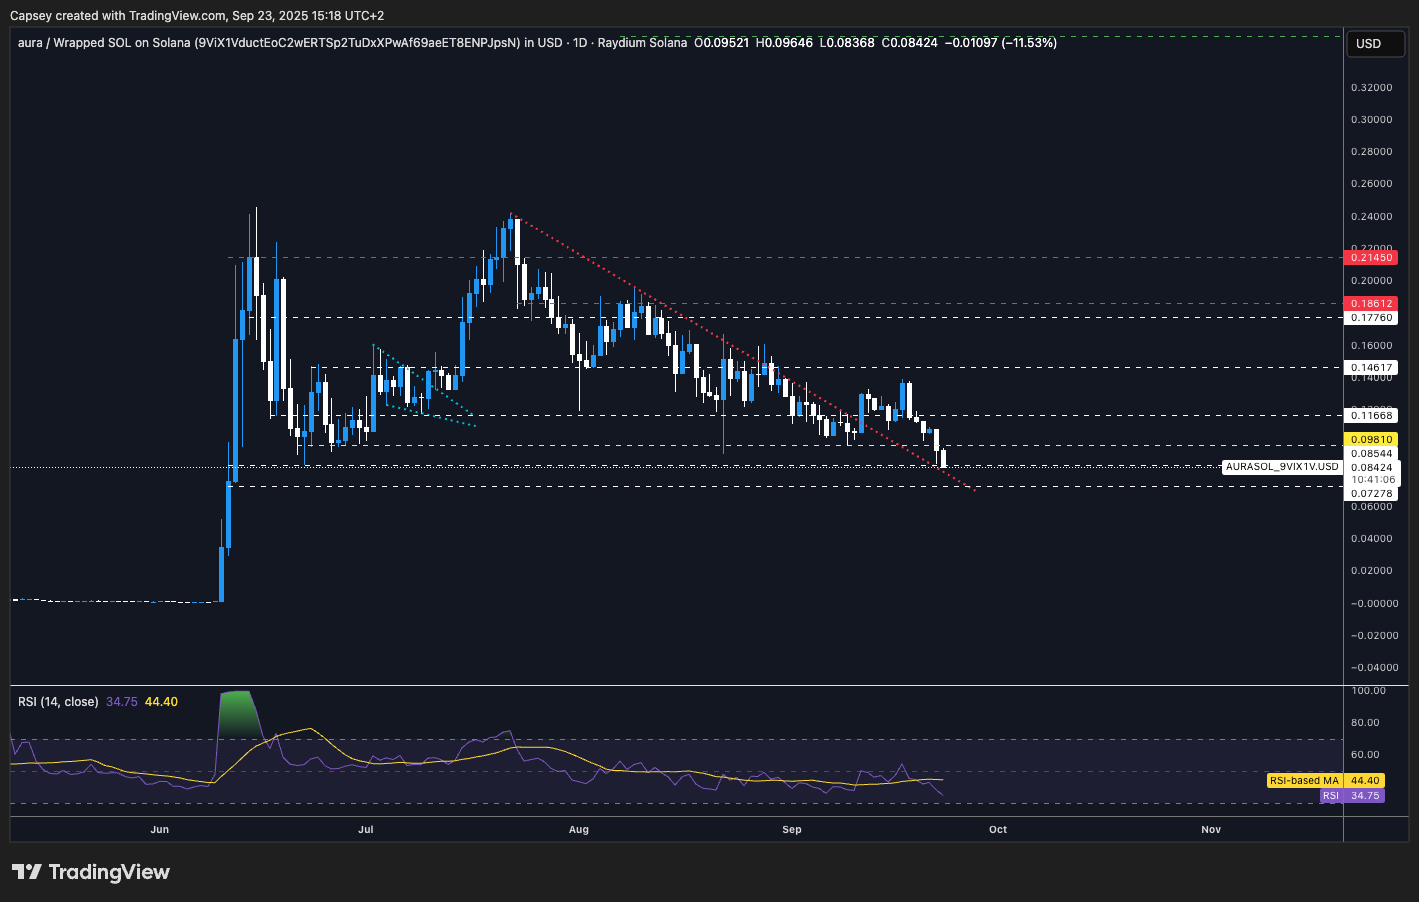
- AURA: Testing support at $0.085 after losing $0.098; expected to bounce with broader market, potential upside to $0.145.
BTC:
-
We've continued to see Open Interest pull back, but not by an alarming amount in BTC. Monday's leverage flush out came more in altcoins, and BTC's price pull back was more due to large spot sellers.
-
But with Open Interest pulling back, this has seen the Funding Rate also pull back, although still in neutral territory.
-
Monday's price movement down was driven mostly by Spot sellers than a leverage flush out.

Technical analysis
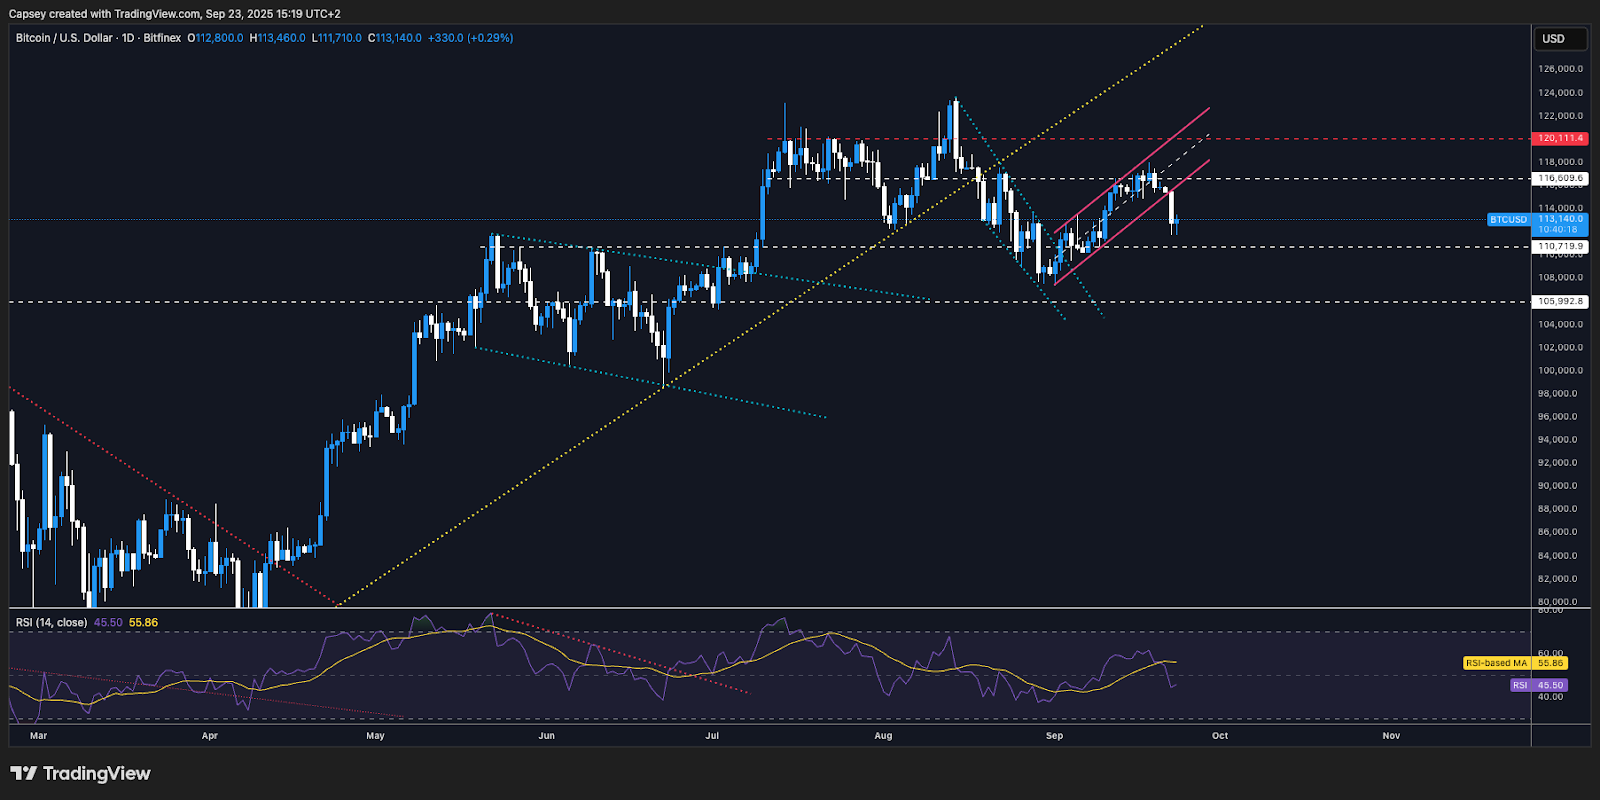
- BTC initially bounced from the $108k-$112k level, holding in its uptrend channel.
- Price moved into the horizontal resistance zone of $116,600-$117,000 and rejected from that level.
- Monday saw a big seller step in and push the price back down from $117k, with the price then breaking below its uptrend channel.
- Price then swiftly retested the main horizontal support of $112k.
- In the immediate term, price has seemingly found some support at $112k, with price putting in a small bounce so far.
- In the short-term, we expect that $110k-$112k should be a strong support zone.
- The RSI is in middle territory on the Daily timeframe, however, in Monday's session, the 4hr RSI pulled back to its lowest level since early April. This would suggest that at least a small bounce is possible.
- Should we see price put in a small bounce, we'd be looking at $115k as a key level for price to reclaim, with $117k the major horizontal resistance beyond that.
Cryptonary's take
Monday's price pull back was scary, more due to the bloodbath in altcoins rather than BTC. BTC has rejected from $117k, putting in a lower high and with price now pulling back to the $112k support. For now, this remains a pull back where price is still range bound and price is above the key support of $112k.If price continues to hold above the $110k-$112k zone, the structure remains bullish. For now, we're maintaining our positioning as we still see a positive macro environment that should be constructive for risk assets - we're seeing this in the TradFi Indexes, just not in Crypto currently. However, as we move out of September (which is a seasonally weak period), we may start to see the market pick back up. Again, for this reasoning along with the supportive macro backdrop, we're remaining positioned.
We'd have to reconsider should the odds for rate cuts meaningfully decrease, or if BTC lost the $108k level.
- Next Support: $112,000
- Next Resistance: $115,000
- Direction: Neutral
- Upside Target: $117,000
- Downside Target: $110,000
ETH:
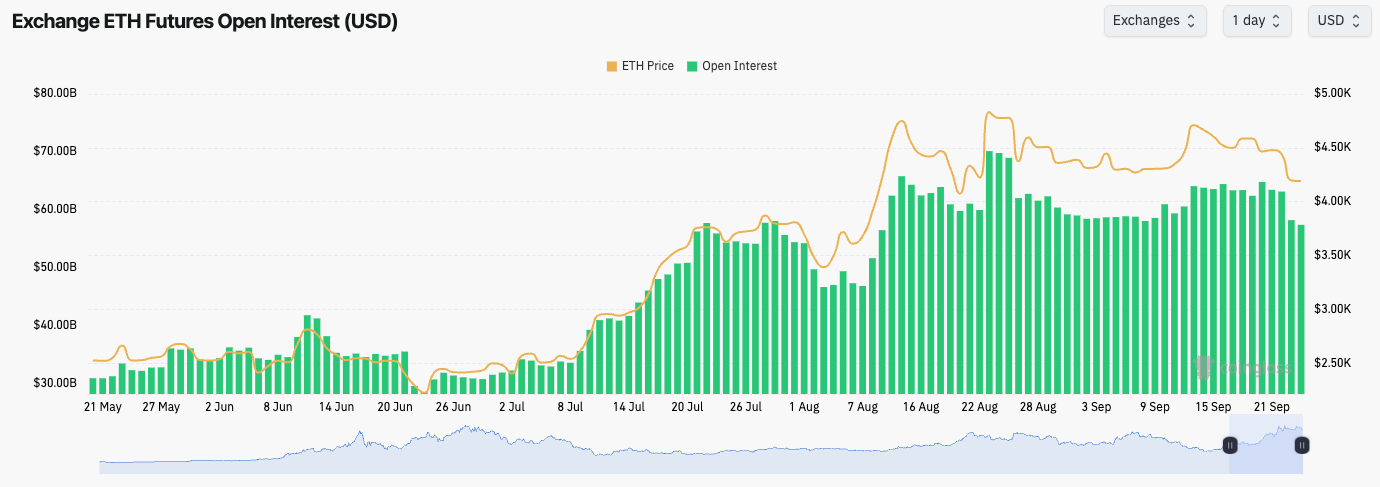
- ETH's Open Interest pulled back on Monday as price was driven down by Spot sellers. This resulted in a large amount of Longs being liquidated.
- ETH's Funding Rate is neutral to slightly negative, meaning there is now a small bias amongst traders to go Short.
- The pull back in Open Interest is healthy, but with Shorts now jumping in, it's possible we see a period of chop and then a small relief rally.
Technical analysis
- ETH rejected into the horizontal resistance of $4,770, with price then finding some support at $4,500.
- Price was unable to hold the $4,500 horizontal support and price swiftly moved into the $4,000 level, even breaking below the local support of $4,340.
- ETH does remain above its major horizontal support of $3,970, but below its local levels of $4,340 and $4,500.
- Should ETH reclaim $4,500, the major upside resistance is at $4,770 still.
- One cause for concern is that ETH has broken below its main uptrend line, which had remained intact since mid-June.
- ETH's RSI on the Daily timeframe is in low middle territory, and now well below its moving average.
- The last 3 times ETH's RSI on the 4hr timeframe went as oversold as it was in Monday's session, it marked a multi-month low for ETH's price.
Cryptonary's take
ETH has fallen below its main uptrend line, however price remains in the upper range between $3,970 and $4,770. It's possible that price lingers in this range until a value territory is reached that might more materially bring Spot buyers back in - this zone looks like the $3,800-$4,000 level. Should we see a deviation into that zone, and then a swift bid up, that can allow for price to recover $4,500. In our view, that is the key level for price to recover.Following a large liquidation event, positioning is usually reset, and the market can often be in a better position to go higher. In the short-term, it's possible that we see price deviate into $3,800-$4,000 before reclaiming $4,340, and then $4,500. But ultimately, we expect ETH to chop between $3,800 and $4,340 over the coming week.
A bullish signal to us would be a reclaim of $4,340, that would get us excited again for a move back up to $4,770. And should ETH dip into $3,800-$4,000, we'd be buyers of ETH in that zone again. Other than that, we're remaining patient.

- Next Support: $4,000
- Next Resistance: $4,340
- Direction: Neutral
- Upside Target: $4,500
- Downside Target: $3,800
SOL:
Technical analysis
- SOL rejected into the $250 psychological level and pulled back roughly 16% from $252 down to $212, in line with the wider market move.
- Price initially lost the $222 support but found buyers near the lower end of the support region around $209.
- The uptrend line was briefly broken intraday, but price has recovered into a wick, which is a constructive sign.
- The RSI has cooled significantly, resetting back to neutral territory at 48. This signals momentum is no longer overheated and leaves room for price to rebuild a base before attempting another move higher.
- A reclaim of $222 would shift the bias bullish again, while failure to reclaim it could see consolidation between $209 and $222. Key levels remain $209 as support, $222 as resistance, and $260 as the next major upside target.
Cryptonary's take
SOL’s rejection at $250 triggered a meaningful reset, but the defense of $209 has kept the structure intact. The recovery into a wick after briefly breaking the uptrend line highlights continued demand at these levels. Holding above $209 keeps the broader bullish case in play. The RSI reset is a constructive development, with momentum now fully neutralized. This allows SOL to stabilize and potentially build the base needed for its next push higher. The immediate hurdle remains $222, and reclaiming that level would quickly put $260 back into focus. Until then, SOL may trade in a tighter band between $209 and $222 as it regains strength. Our stance remains neutral-to-bullish as long as $209 holds. A clean break below would weaken the setup and risk a move toward $200, though this is not our base case. Instead, dips toward $209–$212 continue to look attractive, with $260 as the next meaningful upside target.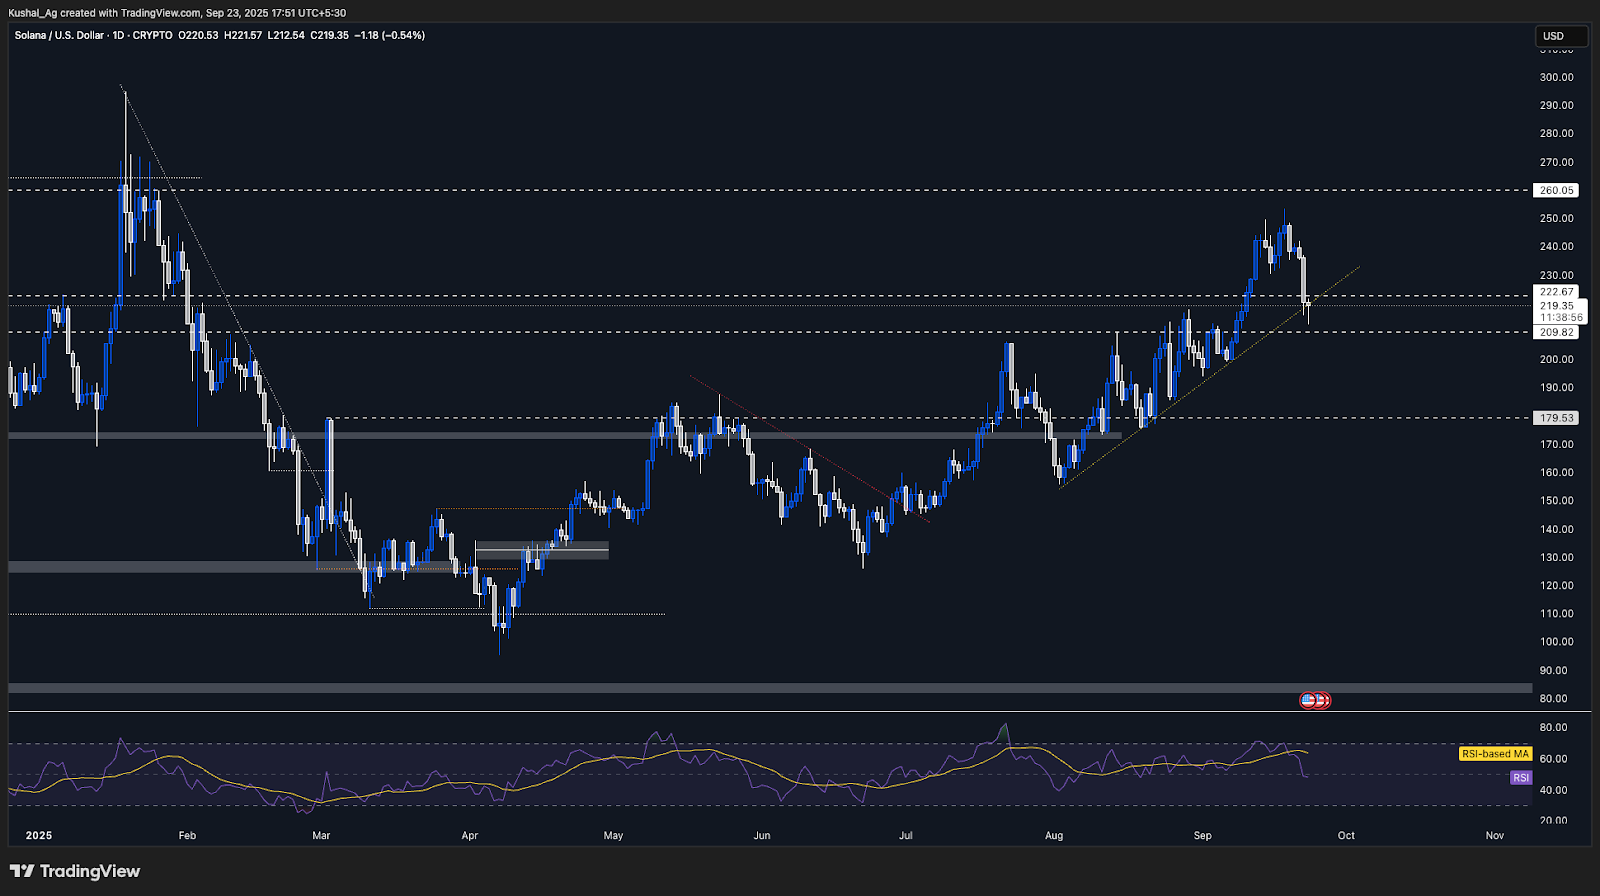
- Next Support: $209
- Next Resistance: $222
- Direction: Neutral/Bullish
- Upside Target: $260
- Downside Target: $209
HYPE:
Technical analysis
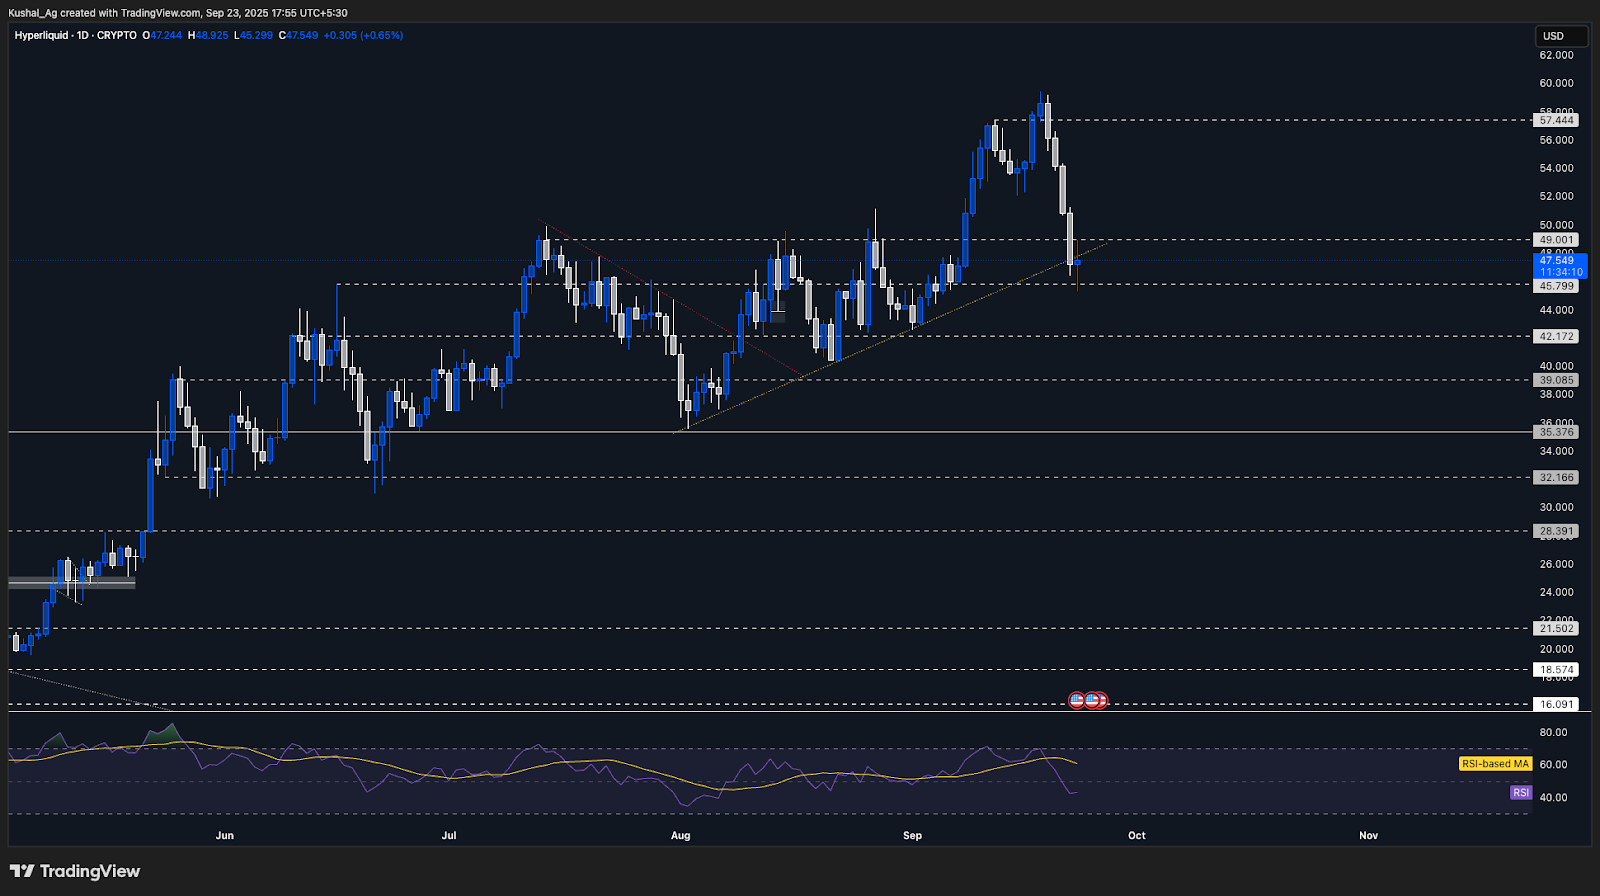
- HYPE followed the broader market pullback, losing the $49 level but finding support at $45.8.
- Price briefly slipped below its uptrend line, though much of the downside has been absorbed by a wick.
- $45.8 remains the key support to hold, with $42.17 as the next downside target if it fails.
- On the upside, reclaiming $49 would be the trigger for momentum to return, with $57 as the next upside target given the large gap left by the swift sell-off.
- The RSI has reset back to 44, below neutral, showing momentum has cooled substantially and leaving room for a recovery if price can stabilize.
Cryptonary's take
HYPE’s rejection of $49 created a sharp pullback, but the rebound off $45.8 has kept the structure from breaking down. The recovery wick and shift back toward green candles are constructive signs, suggesting this level may serve as a firm base.In the near term, we view $45.8–$49 as the key consolidation band. A decisive reclaim of $49 would flip momentum back in favor of the bulls and open up a clean path toward $57, where the chart left inefficiency on the way down. Until then, consolidation between these levels looks likely.
Our stance is neutral for now, leaning bullish if $49 is reclaimed. Should $45.8 fail, $42.17 would come into play as the next downside target. As long as $45.8 holds, we continue to treat dips as opportunities, with the upside structure intact.
- Next Support: $45.80
- Next Resistance: $49.00
- Direction: Neutral
- Upside Target: $57.00
- Downside Target: $42.17
AURA:
- AURA broke out of its downtrend line, but price was not able to reclaim above $0.145.
- Price retested its horizontal support of $0.116, but price broke below it which led to price retesting the $0.098 horizontal support.
- Price has continued to test below $0.098, with it finding support at $0.085 and swiftly bouncing.
- To the downside, the key levels are now $0.085 and $0.072.
- To the upside, the key levels for price to reclaim are at $0.098 and $0.116 being the most major level.
- The RSI on the Daily is close to oversold territory, whilst it’s in oversold territory on the 4hr. This would suggest that a bounce back to $0.098 is possible in the immediate term.
Cryptonary's take
AURA has pulled back to its horizontal support at $0.085 having lost the $0.098 level in the last day. It's possible that this move to $0.085 is a deviation below the $0.098 support and that price can reclaim that level should we see a bounce market wide.Up until now, AURA has held its key support zone of $0.09-$0.116 whilst we've seen other memes, and major market cap memes lose their key support and breakdown to fresh lows e.g., FARTCOIN and WIF.
If we're right on our outlook over the next few months, we'd expect Majors to remain at highs/move higher, whilst capital then slowly moves down the risk curve. That's when we'd expect memes to outperform again and it's our view that AURA will be one of the major outperformers.
- Next Support: $0.072-$0.085
- Next Resistance: $0.116
- Direction: Neutral
- Upside Target: $0.145
- Downside Target: $0.072
Cryptonary's Take:
We've seen a crazy market over the last 48 hours, with much of the damage coming in altcoins and memes rather than BTC. Most of the Majors are at key supports, and whilst they're holding above those, the chart structures are still bullish.This week is important for us to gage price action to see if we can hold these supports and then get some upside from there.
We'll continue monitoring and providing updates.
Let's Go!
Recommended from Cryptonary


