Save 23% ($351) & Get a Free 1-1 Call with our Team ⏰ : 0d 2h 59m 43s

Disclaimer: This is not financial or investment advice. You are responsible for any capital-related decisions you make, and only you are accountable for the results.
Quick bridge from earlier this week…
Earlier this week, we carried a neutral-bearish stance on Bitcoin and Ethereum, with a more neutral, wait and watch bias on Solana and Hyperliquid, and that framework played out largely as expected. Bitcoin failed to hold 90,200, rolled lower, and went near the downside liquidity around the 86,400 region, tapping 87,000 before bouncing. Importantly, price has still not accepted back above 90,200, keeping the broader structure heavy and consistent with the bearish continuation scenario outlined earlier.Ethereum followed a similar path. After losing 3,055, we highlighted 2,872 as the next downside liquidity zone if the level gave way. Price moved directly into that area, reacted cleanly, and then retraced back toward 3,055, where it has since faced resistance. The market has respected these levels very precisely, reinforcing the importance of remaining level-driven and not directional during this phase.
Solana and Hyperliquid, meanwhile, have been holding at key higher timeframe support zones. Solana has been consolidating around 126, while Hyperliquid has continued to hold 21.5, both moving sideways as broader market pressure plays out. In today’s Market Direction, we’ve added SOL/ETH to better gauge relative strength within majors, as early signs suggest Solana may be positioning for potential outperformance versus Ethereum if conditions stabilise.
So let's dive in!
TLDR
- Bitcoin: Trading below the ascending triangular structure, bias stays neutral-bearish while below 90,200, with downside liquidity at 86,400 and 83,790 open, unless reclaimed.
- Ethereum: Structure weakened after losing 3,055, bounce from 2,872 is corrective for now, with neutral-bearish bias below 3,055.
- Solana: Sitting at major HTF demand near 126.15, stance neutral, watching 121 on downside and reclaim of 135 for strength.
- Hyperliquid: Holding 21.5 after losing 23.5, neutral bias as bullish divergence forms, needs reclaim of 23.5 for confirmation.
- SOL/ETH: Holding 0.04-0.042 after September 2025 downtrend break, sustained acceptance above 0.0458 open 0.05-0.055 for Solana relative strength.
Bitcoin
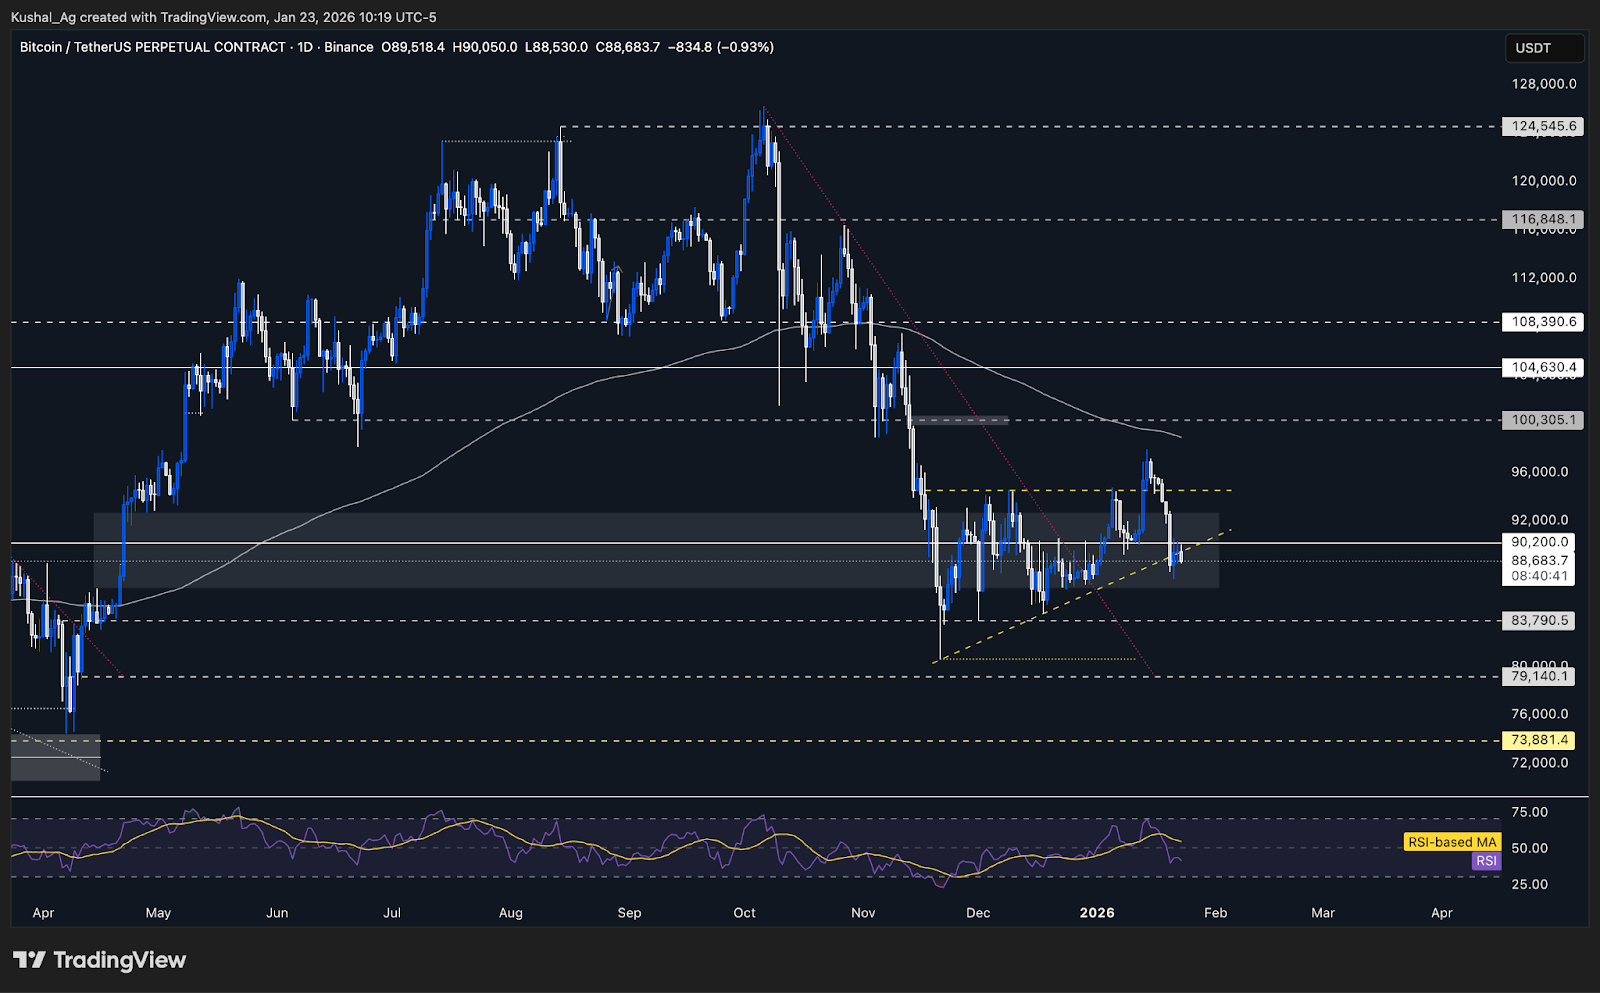
TABitcoin is currently trading within a broader ascending triangular structure that has been forming since November. This structure is becoming clearer as price is compressing inside this formation, suggesting balance, despite recent volatility on both sides of the range.
Price has deviated both above and below this structure over the past two weeks. The upside deviation in mid January was followed by rejection, while the recent downside deviation has pushed Bitcoin below the lower boundary of the triangle where it is trading currently struggling to reclaim the structure just yet. These moves are liquidity runs.
At present, Bitcoin is trading below $90,200, which remains the most important short term pivot. A reclaim of $90,200 would open $94,500 as the next upside test once again which would be the top of the ascending triangle. However, continuation beyond $94,500 will depend entirely on how price behaves around that level itself.
If Bitcoin fails to reclaim $92,200 after any bounce, downside liquidity remains exposed. In that scenario, $86,400 becomes the first major draw, followed by $83,790, with $80,500 acting as the extreme downside liquidity pocket. This keeps the broader structure neutral-bearish until proven otherwise.
RSI is hovering in the low 40s, around 41 with average at 53 showing bearish pressure, while the 200 EMA on the daily timeframe remains a little tilted to the downside near 98,900.
Key Levels
- Next Support: $86,400
- Next Resistance: $90,200
- Direction: Neutral-Bearish
- Upside Target: $94,500
- Downside Targets: $83,790 and $80,500
Cryptonary’s Take
Bitcoin is still in a higher-timeframe ascending triangular pattern, but price is currently working through the lower end of the range. A reclaim of $90,200 would shift focus back toward $94,500, but acceptance above those levels is required to invalidate downside risk.Until then, the market remains level driven. Failure to reclaim $90,200 keeps downside liquidity in play, while a clean reclaim followed by strength above $94,500 would confirm accumulation resolution and negate the open lows.
Ethereum
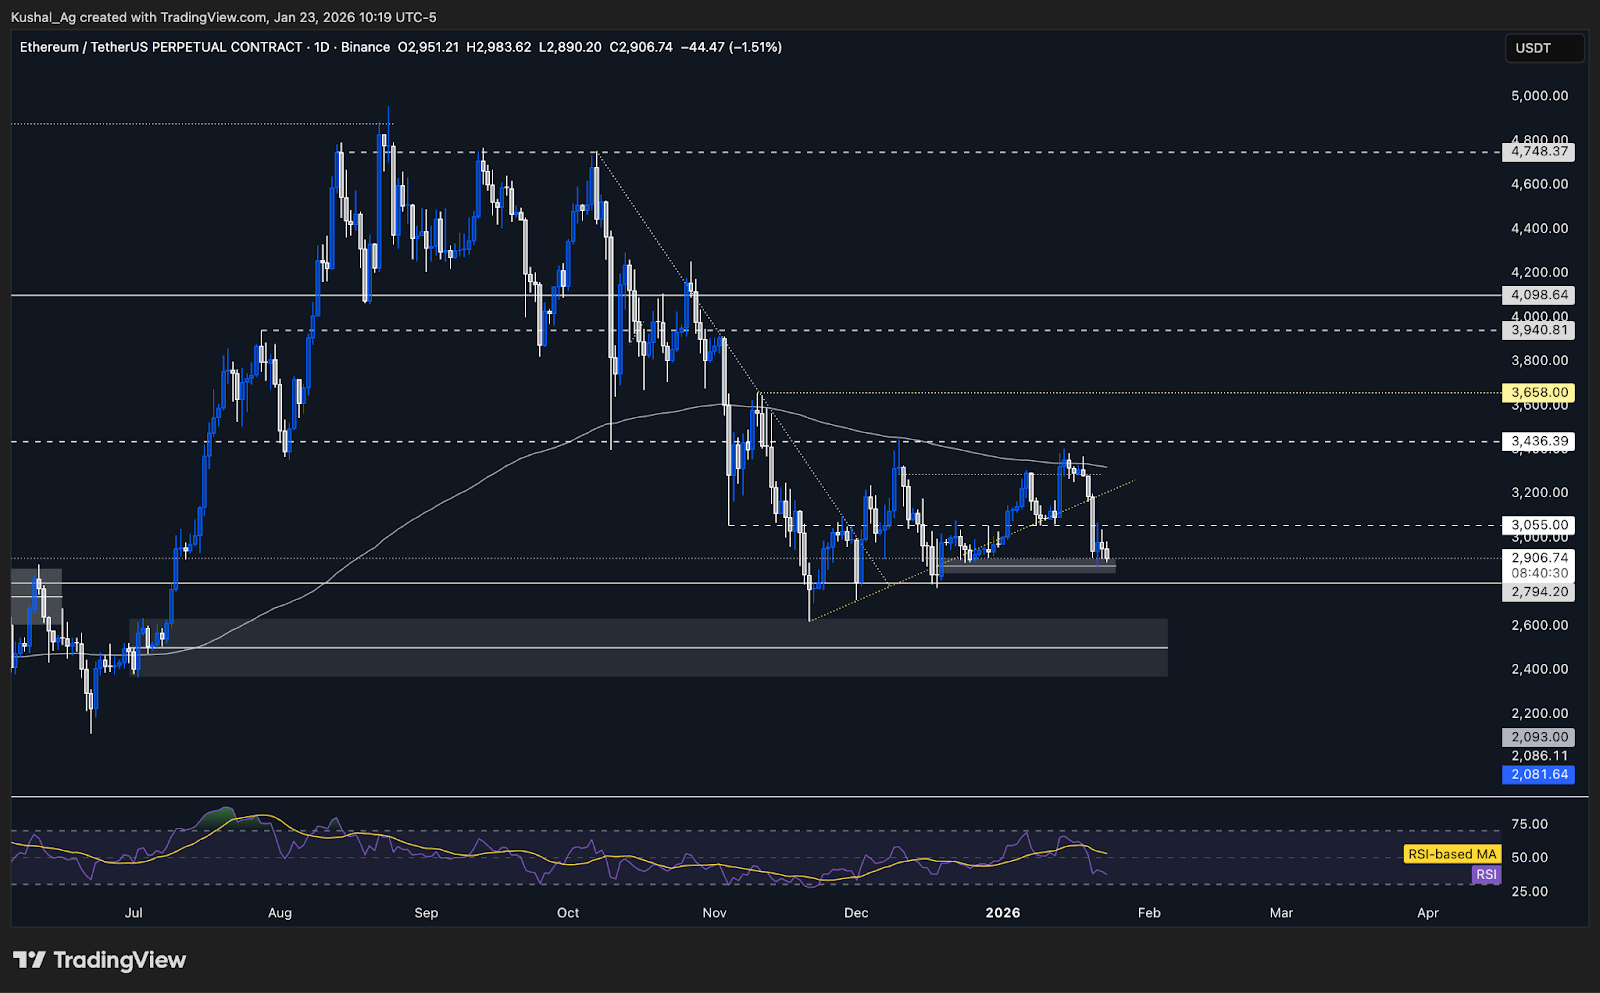
TAEthereum respected the $3,055 level precisely as outlined in the prior analysis. Once price broke below $3,055, it moved directly into the next downside liquidity pocket which we highlighted in the previous analysis at $2,872, tagged it cleanly, and produced an immediate reaction from that level.
The bounce from $2,872 was sharp, with price retracing straight back into the $3,055 zone to retest it from below. This reinforces how cleanly both levels are being respected and confirms $3,055 as a strong supply cap for now.
Price is currently compressing between $3,055 on the upside and $2,872 on the downside, forming a tight range after the initial breakdown. With the first downside target already achieved, focus now shifts to whether $2,872 can continue to hold.
If $2,872 breaks, the next downside liquidity pockets open at $2,794, followed by $2,720. These remain the active downside objectives under the current structure. On the upside, Ethereum needs to reclaim $3,055 first before any attempt toward $3,286 can be considered constructive.
Structurally, Ethereum remains weak after losing the uptrend trendline near the $3,200 region. Until that structure is reclaimed, rallies are corrective.
The 200 EMA on the daily timeframe is flat near $3,320, offering overhead resistance, while RSI remains subdued near 38 with the average around 52, reflecting persistent bearish pressure despite short term bounces.
Key Levels
- Next Support: $2,872
- Next Resistance: $3,055
- Direction: Neutral-Bearish
- Upside Target: $3,286
- Downside Targets: $2,794 and $2,720
Cryptonary’s Take
Ethereum has played out exactly as mapped, with downside liquidity at $2,872 tapped and price now consolidating beneath $3,055. As long as price remains capped below this level, the broader setup stays neutral-bearish with lower liquidity still in play.A reclaim and acceptance above $3,055 would be the first signal to reassess bias, but until that happens, downside continuation toward $2,794 and $2,720 remains the higher-probability path, especially if Bitcoin fails to reclaim its own accumulation structure.
Solana
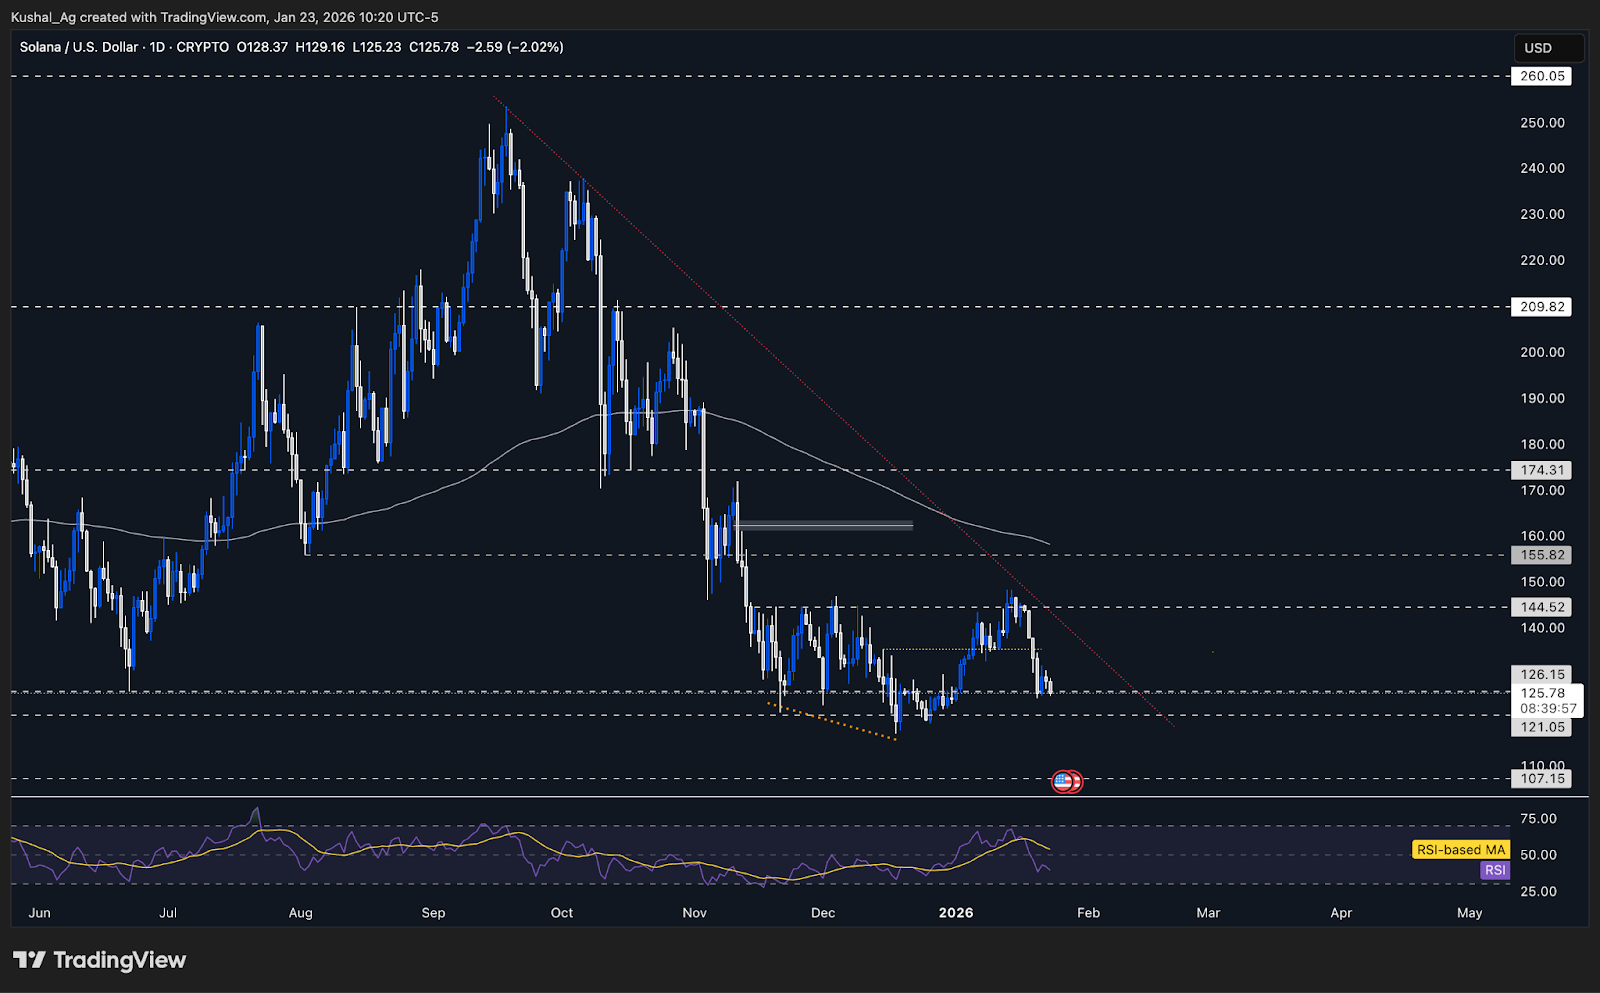
TASolana is consolidating around the $126 area, which we have highlighted is a higher timeframe support zone that has held up well so far. After tapping this level, price attempted a small relief bounce toward $131 but failed to build follow through and has rotated back into consolidation, which is broadly in line with expectations at a level like this.
$126 remains the key line in the sand. As long as this area holds, downside pressure stays contained and price is more likely to base. That said, with broader market conditions still fragile, especially with Bitcoin eyeing lower liquidity, there is no confirmation yet to shift into a bullish stance.
If broader market weakness persists and $126 gives way, the next downside level to watch is $121. A move below $121 would likely be a deviation into lower liquidity, but it could open a quick move into the low to mid $110s before any meaningful response.
On the upside, Solana needs to reclaim $135.4 to signal strength returning. Acceptance above that would open the door for a move back toward $144.5, but until then, upside moves remain corrective within a broader consolidation.
Momentum remains soft still, the daily 200 EMA is sloping down near $158, and RSI is hovering around 40 with the average closer to the mid 50s, reflecting weak momentum but also proximity to a zone where basing often occurs.
Key Levels:
- Next Support: $126.15
- Next Resistance: $135.4
- Direction: Neutral
- Upside Target: $144.5
- Downside Target: $121
Cryptonary’s Take:
Solana is sitting at a meaningful higher timeframe support, but without confirmation from the broader market, patience is warranted. Holding $126 keeps the base-building thesis alive, while a loss of this level shifts focus to $121 and potential downside deviations.With Bitcoin's downside liquidity being still open, Solana can go for quick liquidity runs in the low 120s or even mid 110s so that is something which is not completely off the table just yet . So for now, this is a wait and observe zone for Sol. Strength needs to return at the market level before Solana can move from neutral into a constructive bullish setup.
HyperLiquid
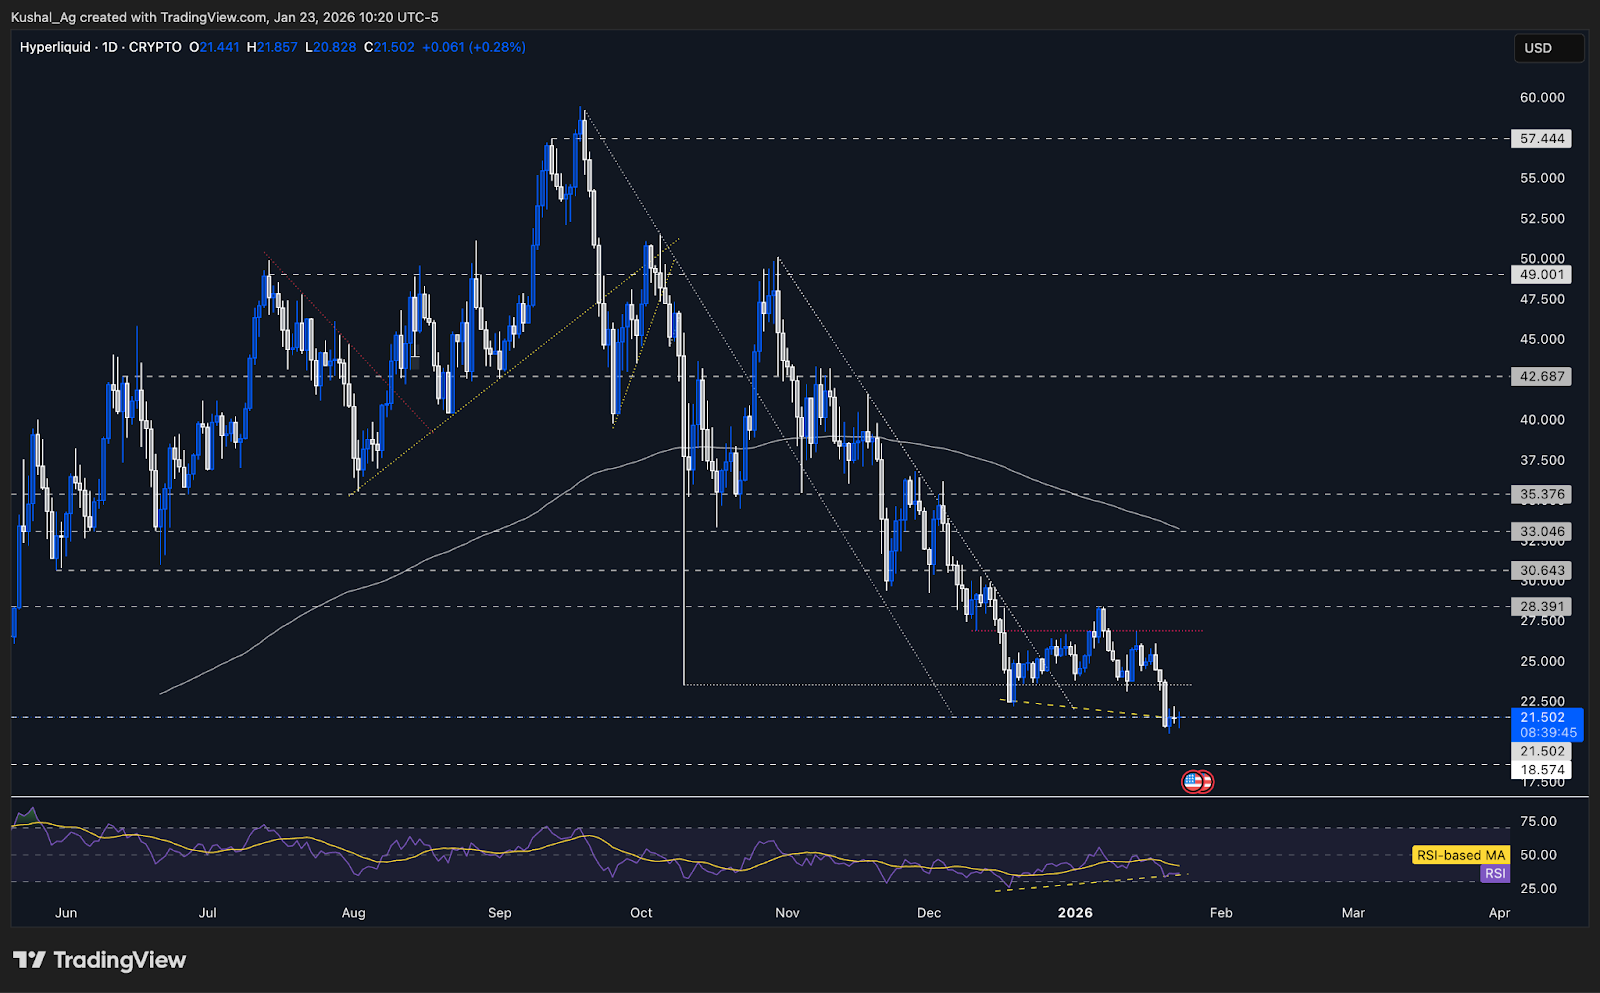
TAHyperLiquid continues to trade below the former $23.5 support, which broke down in the prior analysis as outlined. Following that breakdown, price moved into the next downside pocket at $21.5, a level we highlighted in advance, and has since been holding and consolidating around this area.
The $21.5 zone is now the immediate structural support. Price action here has stabilised, with no further acceleration to the downside so far, suggesting short term absorption. This keeps the market in a consolidation phase.
From a structure perspective, the bullish divergence setup we discussed earlier is still developing but remains unconfirmed. For that divergence to actually validate, HyperLiquid needs to show follow through strength, with a minimum reclaim of $23.5. Without that reclaim, the setup stays conditional for now.
If $21.5 continues to hold, sideways consolidation remains the base case. However, if this level breaks decisively, the next downside liquidity pocket opens toward $18.5, which would likely coincide with broader market weakness, particularly if Bitcoin accelerates toward its lower liquidity targets.
The daily 200 EMA is still sloping down near $33.2, reflecting broader trend pressure, while RSI is hovering around 36 with an average near 41, weak, but consistent with a potential basing environment.
Key Levels:
- Next Support: $21.5
- Next Resistance: $23.5
- Direction: Neutral
- Upside Target: $26.9
- Downside Target: $18.5
Cryptonary’s Take:
HyperLiquid is doing exactly what a market should do after tagging a predefined downside level, pause, consolidate, and assess direction. As long as $21.5 holds, the neutral stance remains appropriate, with attention on whether price can eventually reclaim $23.5 to validate the bullish divergence thesis.A loss of $21.5 would invalidate the basing attempt and shift focus toward $18.5, which might be on the table as bitcoin's lows are still open for now. Strength back above $23.5 would be the first proper signal that momentum is starting to turn.
Aura
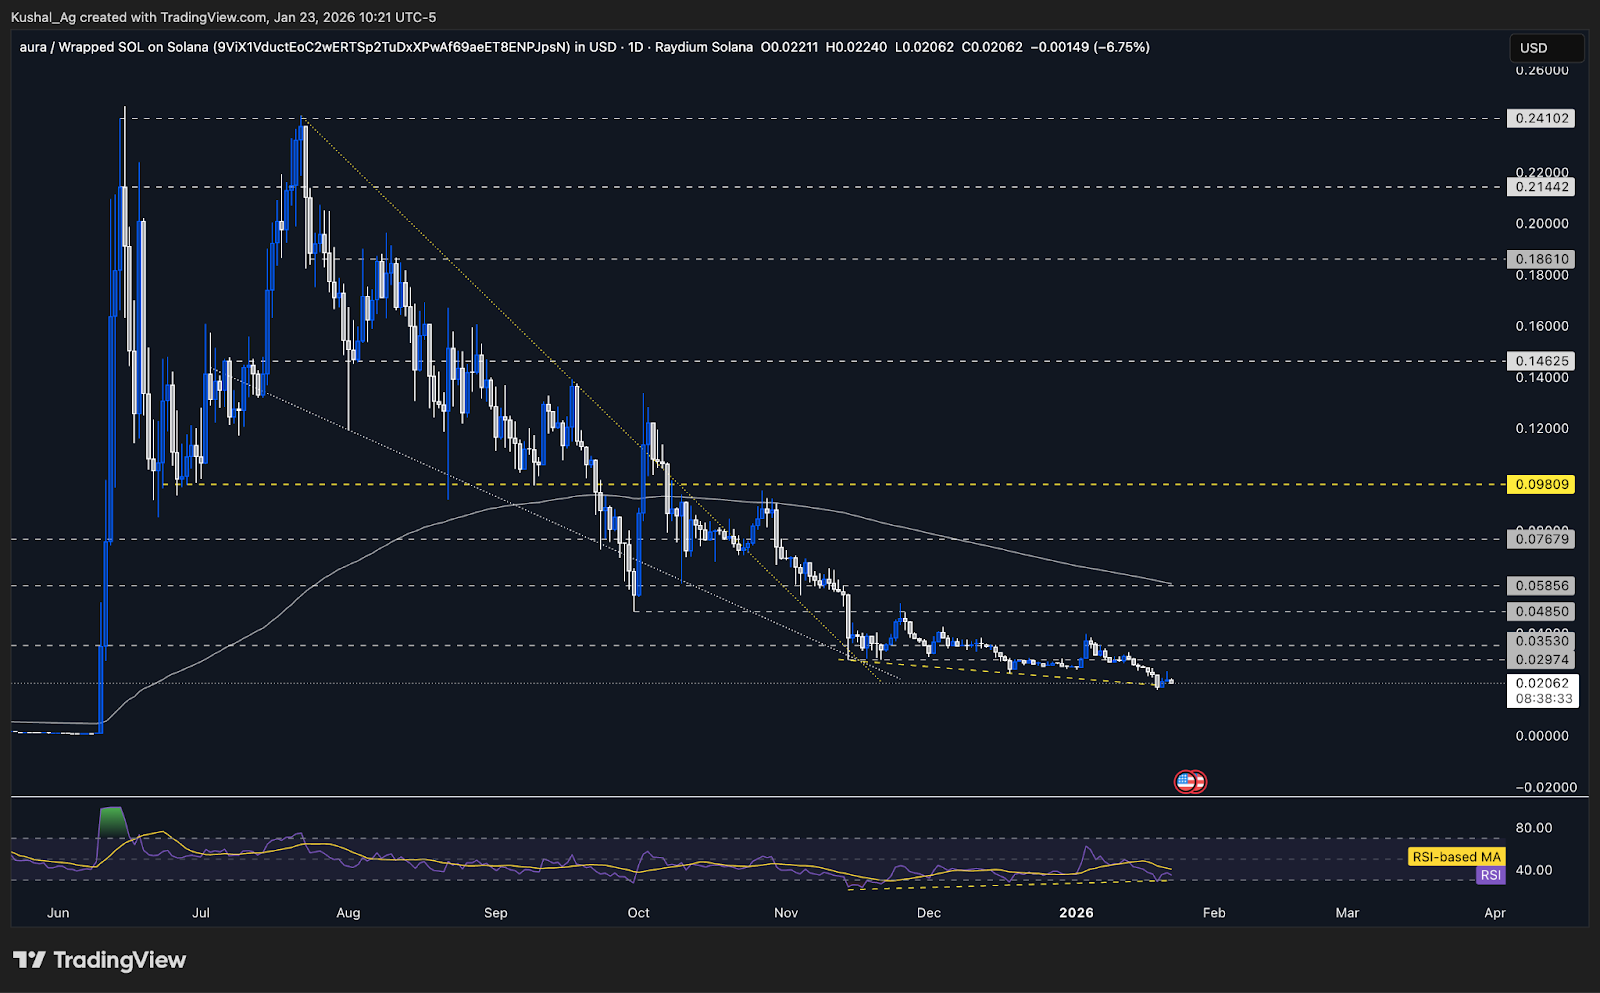
TAAura continues to trade with price action largely unchanged since the last analysis. The asset remains flat, reflecting the broader lack of momentum across Solana betas. Structurally, nothing has broken down yet, but there is also no expansion attempt underway at this stage.
From a technical standpoint, Aura is showing early signs of a potential bullish divergence, similar to what we are observing in HyperLiquid which we highlighted in the last Market Direction earlier this week. Price has pushed marginally lower while momentum has failed to make corresponding lower lows, suggesting downside pressure may be weakening. However, this setup is still forming and remains unconfirmed without upside follow through.
The lack of confirmation is largely tied to Solana itself. SOL is consolidating back near the $126 region, the same area from which its previous rally began. As long as Solana remains range bound and directionless, Aura and other Solana linked assets are likely to stay muted and choppy.
The 200 EMA on the daily timeframe is hovering near 0.06 and continues to slope gently downward, while RSI is deeply compressed around 26 with an average near 40.
- Direction: Bullish
- Action Plan: DCA and Raid
Cryptonary’s Take
Aura's bullish divergence setup is worth tracking, but it requires confirmation through strength, ideally alongside a breakout or expansion attempt in Solana. If and when Solana regains momentum, Aura is well positioned to respond, but for now, this remains a developing setup still.SOL/ETH
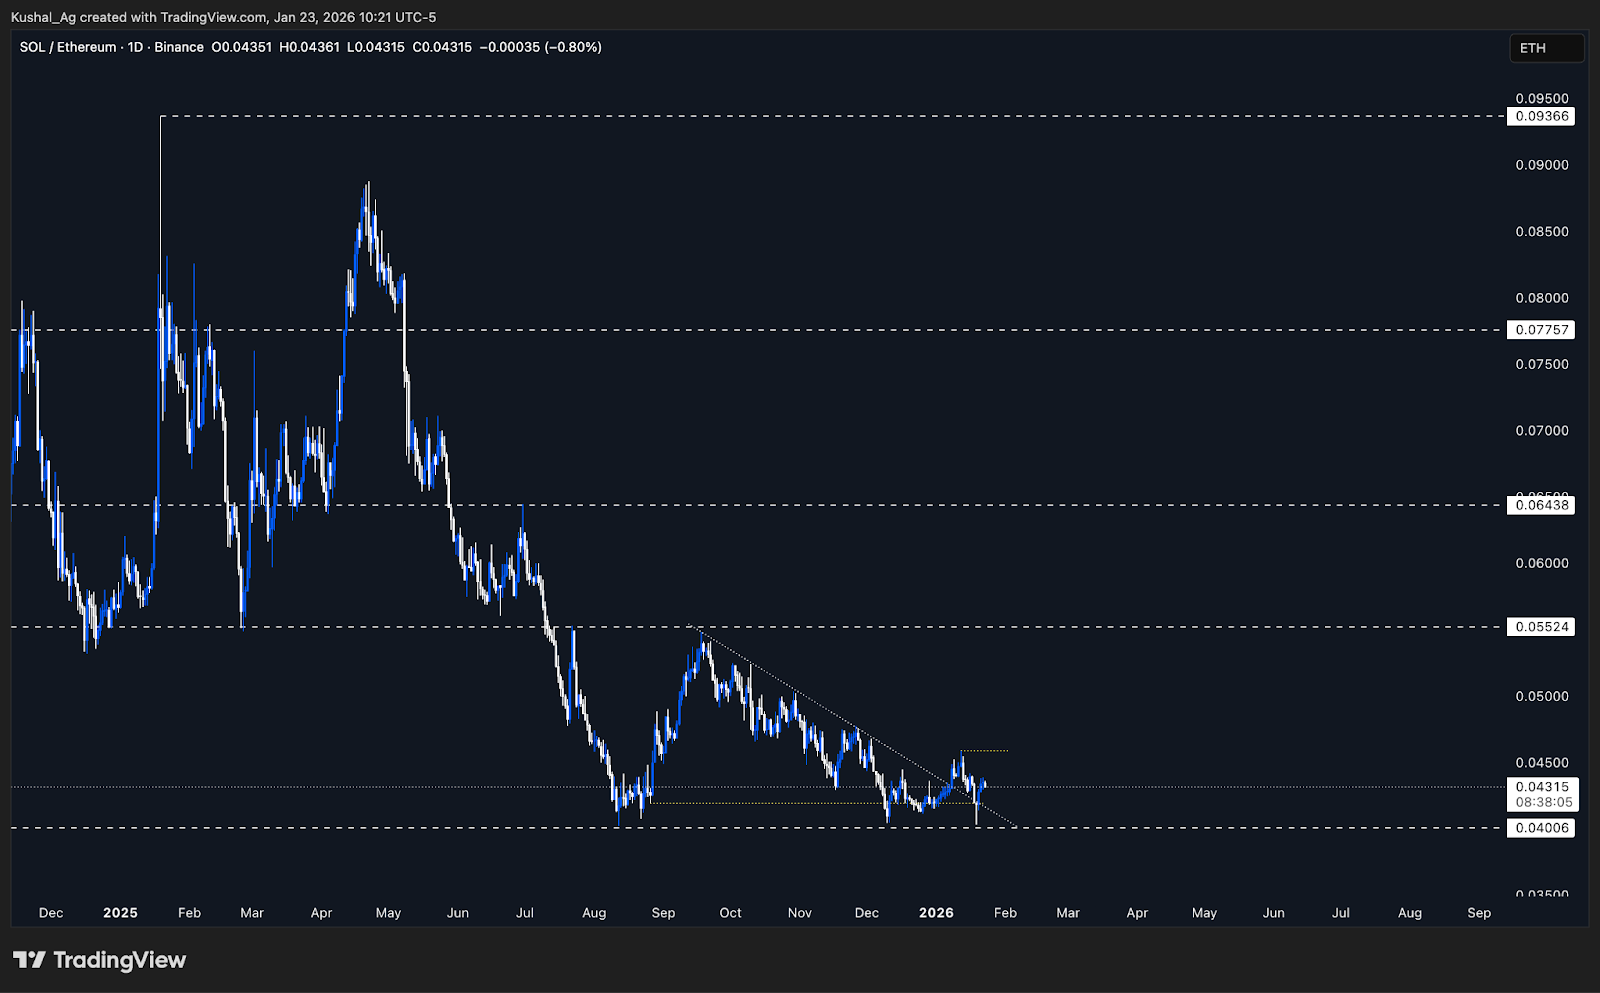
TA:Solana/Ethereum is trading at a critical higher timeframe support zone near 0.04, an area that has repeatedly acted as a pivot in the past. After months of relative underperformance, this level is now being tested again as price attempts to stabilise.
Structurally, the pair had been compressing within a well-defined downtrend since mid-September 2025, reflecting a prolonged retracement of Solana against Ethereum. That downtrend was finally broken in early January, marking the first meaningful shift in relative structure since early 2025.
Following the breakout, SOL/ETH delivered a clean retest of the former downtrend and the 0.04-0.042 region, holding and not breaking back down. This successful retest is an important development, as it suggests the breakout was not a false move and that sellers might be losing control at this level.
Price is now attempting to build acceptance above the reclaimed zone. As long as SOL/ETH sustains above 0.04-0.042, the structure favours a short to medium term reversal.
A decisive break above the post breakout swing high near 0.0458 would act as confirmation, opening the door for upside expansion toward the 0.05-0.055 region, where the pair last saw heavy compression in September.
SOL/ETH Chart:
Cryptonary’s Take:
SOL/ETH is quietly setting up a potential relative strength shift. While confirmation is still needed, the structure has improved materially.As long as the pair continues to hold above the 0.04-0.042 base, the risk-reward increasingly favours Solana outperforming Ethereum in the short to medium term. A clean expansion above 0.0458 would validate this thesis and likely coincide with stronger relative moves across Solana-linked assets.
Closing Thoughts
Bitcoin is trading within a broader ascending triangular formation that has been developing since mid November, with deviations already seen on both sides. For now, price remains in the downside deviation, which keeps lower liquidity targets in play before any sustainable reversal higher. A decisive break and acceptance above 94,500 is required to confirm a bullish continuation of this entire accumulation. Until then, moves higher remain internal reactions, with 90,200 continuing to act as the key line of sand.Ethereum has weakened structurally after losing 3,055, but importantly, it has already tagged one of the downside liquidity zones highlighted earlier. Solana and Hyperliquid are both sitting at high timeframe support areas, keeping our bias neutral as we wait to see whether these levels hold or give way. Hyperliquid and Aura, in particular, continue to show potential bullish divergence formations, though follow through is still needed for confirmation.
Finally, SOL/ETH is worth close attention. The pair is approaching a potential inflection point, and any confirmed upside continuation would point toward Solana outperformance versus Ethereum in the weeks ahead. We’ll continue to track these developments closely and adjust positioning as confirmation emerges.
Cryponary Out!
Continue reading by joining Cryptonary Pro
$1,548 $1,197/year
Get everything you need to actively manage your portfolio and stay ahead. Ideal for investors seeking regular guidance and access to tools that help make informed decisions.
For your security, all orders are processed on a secured server.
As a Cryptonary Pro subscriber, you also get:
3X Value Guarantee - If cumulative documented upside does not reach 300% during your 12-month membership, you can request a full refund. Terms
24/7 access to experts with 50+ years’ experience
All of our top token picks for 2025
On hand technical analysis on any token of your choice
Weekly livestreams & ask us anything with the team
Daily insights on Macro, Mechanics, and On-chain
Curated list of top upcoming airdrops (free money)
3X Value Guarantee
If cumulative documented upside does not reach 300% during your 12-month membership, you can request a full refund.
Our track record speaks for itself
With over 2.4M tokens and widespread misinformation in crypto, we cut through the noise and consistently find winning assets.
Our track record speaks for itself
With over 2.4M tokens and widespread misinformation in crypto, we cut
through the noise and consistently find winning assets.


Frequently Asked Questions
Can I trust Cryptonary's calls?
Yes. We've consistently identified winners across multiple cycles. Bitcoin under $1,000, Ethereum under $70, Solana under $10, WIF from $0.003 to $5, PopCat from $0.004 to $2, SPX blasting past $1.70, and our latest pick has already 200X'd since June 2025. Everything is timestamped and public record.
Do I need to be an experienced trader or investor to benefit?
No. When we founded Cryptonary in 2017 the market was new to everyone. We intentionally created content that was easy to understand and actionable. That foundational principle is the crux of Cryptonary. Taking complex ideas and opportunities and presenting them in a way a 10 year old could understand.
What makes Cryptonary different from free crypto content on YouTube or Twitter?
Signal vs noise. We filter out 99.9% of garbage projects, provide data backed analysis, and have a proven track record of finding winners. Not to mention since Cryptonary's inception in 2017 we have never taken investment, sponsorship or partnership. Compare this to pretty much everyone else, no track record, and a long list of partnerships that cloud judgements.
Why is there no trial or refund policy?
We share highly sensitive, time-critical research. Once it's out, it can't be "returned." That's why membership is annual only. Crypto success takes time and commitment. If someone is not willing to invest 12 months into their future, there is no place for them at Cryptonary.
Do I get direct access to the Cryptonary team?
Yes. You will have 24/7 to the team that bought you BTC at $1,000, ETH at $70, and SOL at $10. Through our community chats, live Q&As, and member only channels, you can ask questions and interact directly with the team. Our team has over 50 years of combined experience which you can tap into every single day.
How often is content updated?
Daily. We provide real-time updates, weekly reports, emergency alerts, and live Q&As when the markets move fast. In crypto, the market moves fast, in Cryptonary, we move faster.
How does the 3X Value Guarantee work?
We stand behind the value of our research. If the documented upside from our published research during your 12-month membership does not exceed three times (3X) the annual subscription cost, you can request a full refund. Historical context: In every completed market cycle since 2017, cumulative documented upside has exceeded 10X this threshold.
TermsRecommended from Cryptonary


