Save 23% ($351) & Get a Free 1-1 Call with our Team ⏰ : 0d 2h 59m 44s
BTC, ETH, and More: Don’t miss this rally
BTC is coiling inside a bullish wedge at $106K with a $120K target, while ETH and SOL reset above key levels. AURA and HYPE build quite a momentum. With dovish FED tones and global calm, the market may erupt sooner than expected.
TLDR:
- BTC: Holding $106k in bullish wedge; targeting $120k.
- ETH: Reclaimed range; eyes $2,720 short-term, $3,500 mid-term.
- SOL: Broke downtrend; bullish above $144, aiming for $185.
- AURA/HYPE: Building bases; AURA targeting $0.40 breakout.
BTC:
- BTC's Open Interest has remained relatively flat from a zoomed-out perspective; however, we saw a small pop high in OI over the weekend into the Weekly candle close.
- BTC's Funding Rate is currently flat at 0.00%, with last week's price increase due to Shorts being squeezed out.

Technical analysis
- Following the ceasefire between Israel and Iran, BTC bounced from $100k to $108k in the few days that followed.
- BTC reclaiming the key horizontal level of $106,000 is important if BTC is going to maintain a bullish structure.
- BTC is currently in a broadening wedge pattern. These patterns tend to have a bullish bias to break out to the upside.
- Should BTC break out of the top border of the broadening wedge, the next major horizontal resistance is the all-time high at $112k. The breakout target, however, is at $120k.
- To the downside, $106,000 is the horizontal support, with $103,500 being another key level.
- The RSI is in middle territory and above its moving average, having broken out of its downtrend line. There's room for this indicator to go higher.

- Next Support: $106,000
- Next Resistance: $109,000
- Direction: Neutral/Bullish
- Upside Target: $120,000
- Downside Target: $99,000
Cryptonary's take
Bitcoin has swiftly returned to the upper bound of its range following the ceasefire between Israel and Iran. We may see a small pullback to $106k before we see a price breakout of the broadening wedge and a return to all-time highs.Recently, we have had a slightly more dovish tone come out of the FED, which likely puts a September Interest Rate cut on the table, should the data continue to corroborate. For this reason, we're going to expedite our buying over the coming weeks. We will look to buy BTC should it retest between $99k and $105k, with the view to BTC being between $150k and $170k by mid-2026.
ETH:
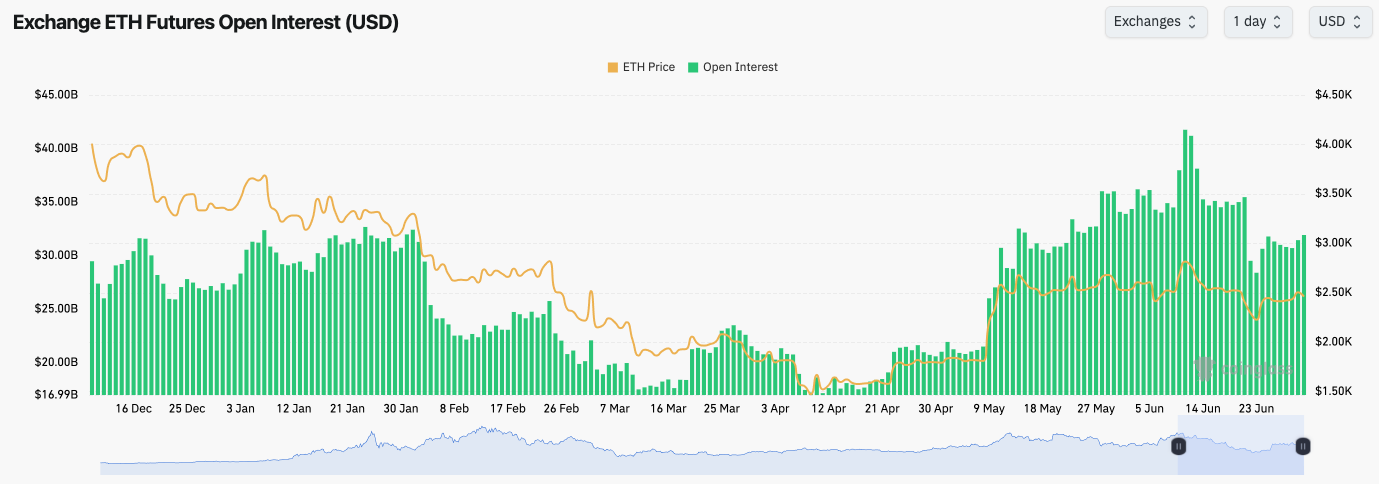
- ETH's Open Interest has pulled back following the price drop into the $2,100.
- Funding Rates remain positive, suggesting that there is a net bias amongst traders to remain Long.
Technical analysis
- ETH broke below the key horizontal level of $2,420, but price bounced perfectly from the horizontal support of $2,160 and quickly recovered the horizontal level of $2,420.
- Price is now back in the range between $2,420 and $2,720, with price attempting to build a base at $2,420 to then move higher in the coming days.
- To the upside, the key horizontal resistance is at $2,720. A break above that, and the next major level is at $3,050.
- The RSI is in middle territory, but it's above its moving average. However, it does remain in a downtrend. A push into the downtrend line could see the price break out and move up to $2,720 in the next week.

- Next Support: $2,420
- Next Resistance: $2,720
- Direction: Neutral/Bullish
- Upside Target: $3,050
- Downside Target: $2,160
Cryptonary's take
ETH managed to bounce at the key horizontal level of $2,160, and it quickly reclaimed its range. In the short term, we expect ETH to retest $2,720; however, if we look 2–3 quarters out (say mid-2026), we expect ETH to be back to $3,500 as a minimum. We'd suggest that those who are under-exposed begin adding exposure between $2,160 and $2,450.SOL:
- SOL's Open Interest spiked up over the weekend, which helped lift the price from the $140 level to the $150 level. Open Interest has since reduced a tad on this small price pullback.
- SOL's Funding Rate was more meaningfully positive; however, it has now reset back to neutral levels at 0.00%, suggesting there is no real directional bias here from traders.

Technical analysis
- SOL broke down into the buy zone we previously gave between $120 and $135, where the price swiftly bounced back to the key horizontal level of $144.
- Since mid-May, the price has been in a downtrend channel, which the price has just broken out of in the last day.
- Price is now back above the $144 horizontal level, and it's now out of its downtrend channel. This is a bullish setup for SOL in the short term.
- The RSI is in middle territory, above its moving average, and it has broken out of its downtrend line. This is a bullish setup.
- We are increasing our buy levels for SOL to the range between $135 and $150.

- Next Support: $144
- Next Resistance: $165
- Direction: Neutral/Bullish
- Upside Target: $185
- Downside Target: $135
Cryptonary's take
SOL has recovered the $130 level well, with price now reclaiming $144, and breaking above its downtrend channel. This is a bullish setup.With the macro data continuing to corroborate, our expectation is that the FED can begin a new Interest Rate cutting cycle from September that should last into the middle of 2026. We're beginning to see this with more and more FED members beginning to strike a seemingly more dovish tone. Our expectation is that the market is beginning to front-run this, and therefore, we're looking to get more risk-on, and more quickly.
We are adding more SOL between $135 and $150.
HYPE:
- HYPE bounced perfectly from the Yellow Buy Box between $30.50 and $33.00.
- Price has now moved higher and it is retesting the $39.40 horizontal resistance. A close above this level, and the price is primed to retest the all-time highs at $45.00.
- There is another resistance at $39.40, which is the underside of the main uptrend line. If HYPE can reclaim above these levels, it would be very bullish. However, a rejection below would likely send HYPE back to the $33.00 to $35.00 range.
- The main zone of support remains the Yellow Buy Box at $30.50 to $33.00.
- The RSI is in a good spot. It's in middle territory, and above its moving average, whilst it's squeezing into its downtrend line, potentially looking for a breakout.
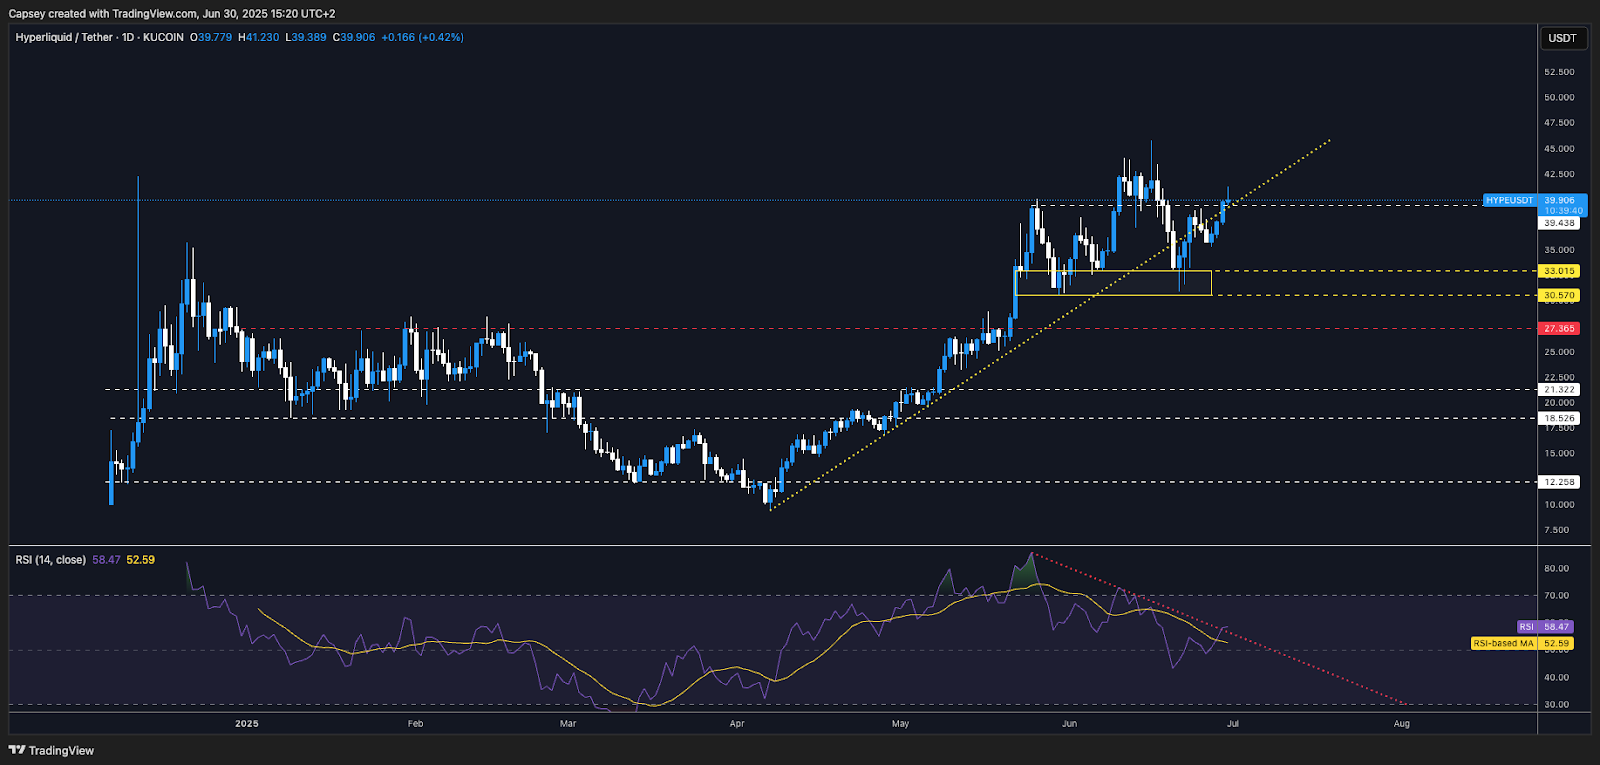
- Next Support: $33.00
- Next Resistance: $39.40
- Direction: Neutral
- Upside Target: $45.00
- Downside Target: $30.50
Cryptonary's take
This is a make-or-break moment for HYPE. Charting-wise it's running into resistance, but the indicators still suggest a bullish structure, should the indicators (RSI) break out.We remain buyers of HYPE, should price return to the $28.00 to $33.00 range; however, we're not looking to chase price above $35.00. It is possible that we miss the 'HYPE train'; however, it is better to buy coins at attractive values rather than chasing.
AURA:
- Price pulled back from the highs at $0.24, putting in a typical meme-like pullback of 65%, with price bottoming at $0.085.
- Price is now holding the Yellow Buy Box range between $0.085 and $0.104, with the key horizontal level just above at 0.116.
- Price is in a downtrend, and it now looks to be forming a base on the Daily timeframe between $0.085 and $0.116. This aligns with the structure we anticipated, with the bullish chart structure migrating from the 4-hour timeframe to the Daily timeframe. But of course, it takes time for it to play out.
- Whilst price remains in its downtrend, the more days that tick by as price forms this base, the closer price is to breaking out of the main downtrend line.
- Should the price break out of the main downtrend line, the likely first short-term targets are $0.177 and then $0.240.
- The RSI is in middle territory, and it is battling with its moving average.
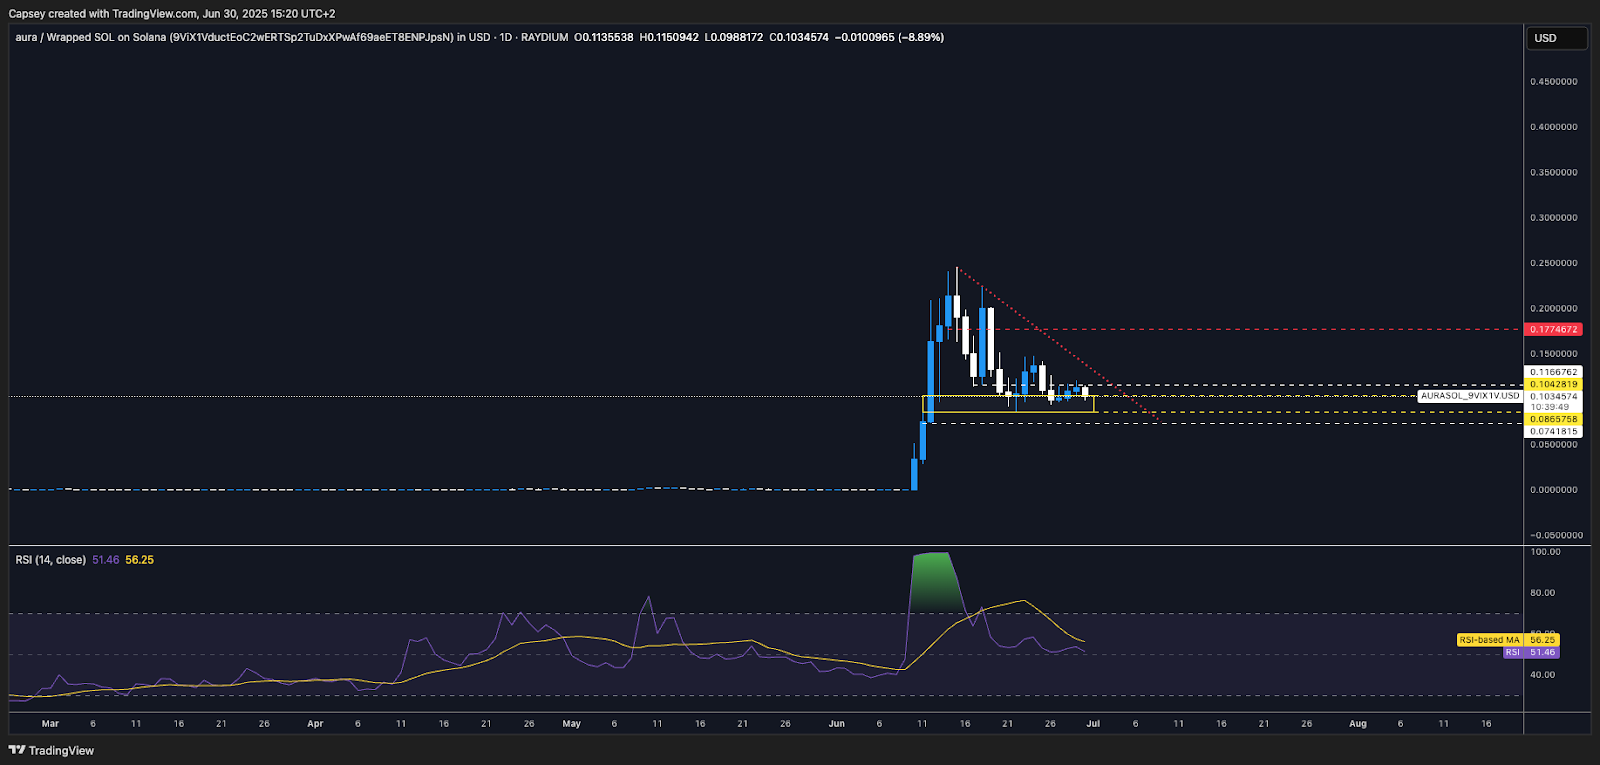
- Next Support: $0.085
- Next Resistance: $0.116
- Direction: Neutral/Bullish
- Upside Target: $0.177
- Downside Target: $0.085
Cryptonary's take
Aura's price action is playing out as we had expected it might. Following such a large run higher, it was likely to put in a meaningful pullback as traders booked profits. This process was needed to flush out weak hands and old holders, whilst distribution can be more healthily reset. We're also now seeing price retrace and form the base that we suggested it'd need to form before it can move up later. This would end up being a classic 'cup-and-handle' pattern. This is a very bullish pattern and would suggest a breakout target (in the coming weeks) of $0.40.Our conviction in AURA remains high, with longer-term upside targets of well north of $1.50. We expect Interest Rate cuts beginning in September (and likely being front-run before September) to kick start a new bull run, that likely peaks out in mid to late 2026. We expect AURA to be the 2025 meme that sets the tone for the rest of the meme space, like what WIF was in 2024.
Disclaimer: This is not financial or investment advice. You are responsible for any capital-related decisions you make, and only you are accountable for the results.
Recommended from Cryptonary


