Disclaimer: This is not financial or investment advice. You are responsible for any capital-related decisions you make, and only you are accountable for the results.
TLDR:
-
- Macro: Market in wait mode ahead of key inflation print; FED rate cut outlook at stake.
- BTC: Broke out to $120k–$125k; leverage overheated; potential pullback before $135k–$138k.
- ETH: Testing $3,050 resistance; likely range-bound short-term; support at $2,870.
- SOL: Bullish breakout; watching $167 resistance; upside to $185 and $203.
- HYPE: Strong rally continues; support at $44; next target $60.
- AURA: Cup-and-handle pattern forming; eyeing breakout to $0.24 and then $0.40.
Macro Context:
Tomorrow, we have a highly anticipated inflation print. The market may be more contained here as participants choose to sit on their hands rather than up their risk appetite 24 hours before a big economic data print.
Expectations are for inflation to come in slightly higher. The market can digest higher inflation prints, assuming the numbers aren't so high that it pushes back FED Interest Rate cuts.
BTC:
- Over the last few days, BTC's Open Interest has increased substantially with it now at all-time highs.
- The Funding Rate is also elevated above 0.01%.
- This suggests that the leverage market has become over-heated in the short-term, and therefore price might be vulnerable to a flush out. Any leverage flushes (price pull backs) would be dip buying opportunities.
BTC's Open Interest (by USD value):

TA:
- BTC broke out of its downtrend wedge and its horizontal resistance of $110,700. This has led to price swiftly re-pricing higher following a multi-month breakout.
- Price has now moved into price discovery and it is testing the target area of the breakout of $120k-$125k.
- When we look at on-chain models (which we need to determine upside price targets once price goes into price discovery), suggest that if BTC can break above $125k, then the next target range is between $135k-$138k (the MVRV +1 standard deviation).
- In terms of downside, the ultimate horizontal support is $110k.
- In terms of local supports to the downside, there is a CME gap between $114,300 and $115,700, so that zone remains a possible support zone for price.
- The RSI is overheated and it's well into overbought territory here.
Cryptonary's Take:
BTC has broken out to the upside and swiftly moved to our target range of $120k-$125k. It's early days in the rally, but with a 23% price gain in the last 3 weeks, it's possible that some sellers step in here and begin to take some profits. Therefore, BTC might consolidate between $115k and $125k to reset leverage and prepare for the next move. However, our base case is that price is much higher in the medium term and that we see $135k-$138k in the coming months.
For those that are under-positioned to BTC and are looking to add or increase their exposure, then the $115k area is a level for bidding should BTC pull back and retest there.

- Next Support: $115k
- Next Resistance:$125k
- Direction: Neutral/Bullish
- Upside Target:$138k
- Downside Target:$115k
ETH:
- ETH's Open Interest has also increased substantially to a new all-time high.
- ETH's Funding Rate is meaningfully positive.
- This setup suggests that the leverage market is somewhat frothy, although we do have to account for the fact that there are big basis trades going on in ETH, so that keeps the amount of Open Interest higher.
ETH's Open Interest (by USD value):

TA:
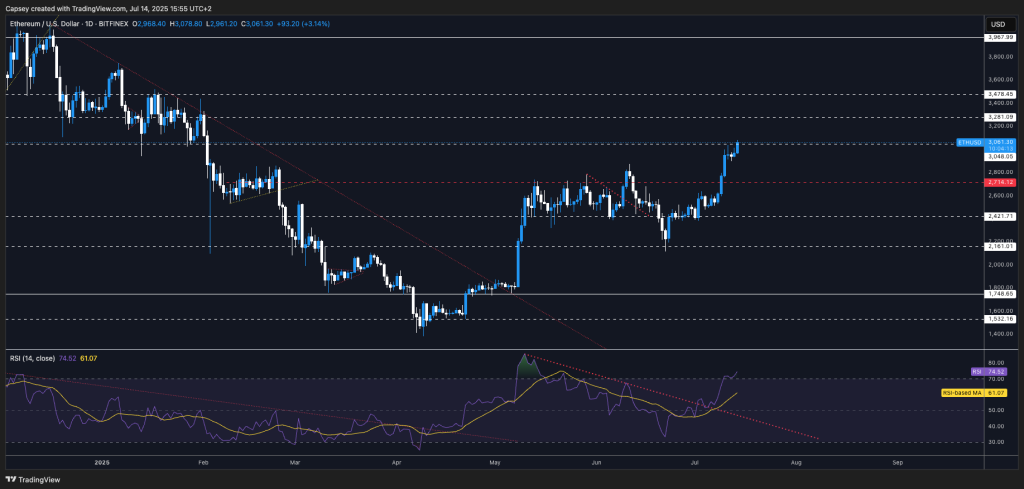
- Following the breakout of the resistance of the main range at $2,720, ETH has quickly pushed on to higher targets.
- ETH is now butting into the underside of the horizontal resistance of $3,050.
- Should ETH flip above the $3,050 level, then the next target to the upside is $3,280.
- Should ETH pull back here or go through a period of consolidation, then we'd expect any pull back to be shallow with $2,870 to $2,910 being a zone of support for price.
- If ETH were to break below $2,870 (not our base case), then $2,720 would be a strong horizontal support.
- The RSI is into overbought territory, however, there aren't any formations of bearish divergences yet.
Cryptonary's Take:
In the short-term, there is room for price to go higher, however, ETH has moved into a main horizontal resistance line at $3,050 whilst the RSI is in overbought territory. It's potentially more likely that in the immediate term (the next week), ETH stays more range-bound between $2,900 and $3,050.
For those looking to add exposure to ETH, $2,720 to $2,850 is a key accumulation zone for those underexposed. But for those who got exposure to ETH in our earlier calls between $2,160 and $2,450, we wouldn't be looking to add to our ETH bags at these prices, even though we see much more upside over the next 6 months.
- Next Support: $2,870
- Next Resistance: $3,050
- Direction: Neutral/Bullish
- Upside Target: $3,280
- Downside Target: $2,720
SOL:
- SOL's Open Interest has kick up to new local highs whilst the Funding Rate is now meaningfully positive.
- More leverage has gone into SOL recently; however, it's not yet at overheated levels that would suggest a meaningful flush out was imminent.
SOL's Open Interest (by USD value):

TA:
- SOL broke out of the main downtrend channel and then also the local downtrend line whilst price used the $144 horizontal level as support.
- Price has now moved up into the local resistance of $165-$167, where price is currently battling.
- Should price breakout of the $165 horizontal resistance, then the next move higher would have a target of $185, then $203.
- If price locally rejects around $167, then $154 would be a good area of local support.
- The RSI is in the low 60's. So, it’s not that close to being overbought yet.
Cryptonary's Take:
There can be more upside for SOL in the short-term, assuming BTC can hold up, rather than pull back, as SOL will need to be supported by this. However, SOL may retest the mid $150’s if BTC dips, presenting a solid buy zone.
To see more meaningful upside, SOL will need to climb above $167 and use it as new support before it can push on to much higher targets.

- Next Support: $154
- Next Resistance: $167
- Direction: Neutral/Bullish
- Upside Target: $185
- Downside Target: $154
HYPE:
- A quite unbelievable chart where price just seems to keep screaming higher and ignoring technical patterns and setups.
- HYPE found some resistance into the underside of the uptrend line and then also at the main horizontal resistance of $39.40. But, once that level was recovered, price swiftly moved much higher.
- Price has now moved up to the psychological level of $50.00, where price is potentially rejecting in the short-term.
- Should price pull back, we'd expect $39.40 to $44.00 to be a strong zone of support.
- The RSI is in overbought territory, but only just, and for now it hasn't formed any negative divergences, although this is something we'll be on the lookout for over the coming days.
Cryptonary's Take:
HYPE has been one of the strongest performers, and we expect it to continue to be. HYPE has been very dijicult to get a clean entry in as the pull backs have been shallow, and price has then gone on to run. Should price pull back to $39.40 to $44.00 we'd consider buying HYPE, although we might not buy with huge size, and rather use that zone as a price range to begin building a position in HYPE.

- Next Support: $44.00
- Next Resistance: $50.00
- Direction: Neutral/Bullish
- Upside Target: $60.00
- Downside Target: $39.40
AURA:
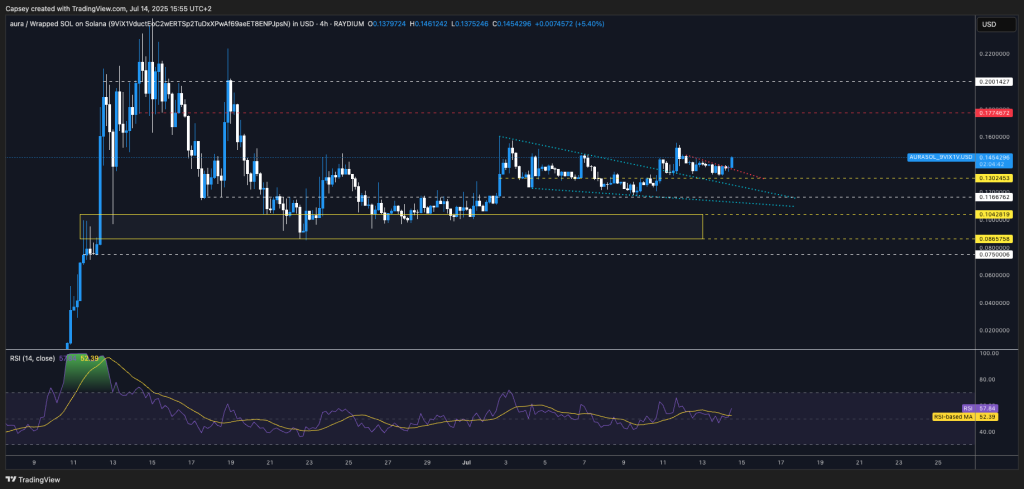
- Note: for AURA we will be looking at it on a 4hr chart timeframe rather than the Daily timeframe.
- Starting with a zoomed-out view, price continues to form the medium term 'Cup-and- Handle' pattern, which would have a breakout target of $0.40 should $0.24 be breached.
- Zoomed in, price broke out of the descending wedge (turquoise lines), with price pulling back and retesting the top border of the wedge as support, as well as the horizontal support of $0.13.
- Price is now breaking out of a local downtrend line, with price pushing up into the local horizontal resistance of $0.15.
- Price is forming in this range between $0.116 and $0.177, and that when $0.177 is breached, this sets price up to swiftly retest $0.24.
- To the downside, the major supports remain at $0.116 and $0.130.
Cryptonary's Take:
Our conviction in AURA as the next multi-billion $ memecoin is strong. We see AURA as being in a medium term 'Cup-and-Handle' pattern, where price is essentially ranging between $0.085 and $0.240, with tighter ranges in between.
Our base case is that price has bottomed, it's forming a 'Cup-and-Handle' pattern which would then see price push onto $0.24, before a small pull back and period of consolidation, and then a breakout of $0.24. Price then likely swiftly pushes on to $0.40, and then higher. We remain strong holders, and we'll use pull backs as dip buying opportunities.
- Next Support: $0.130
- Next Resistance: $0.177
- Direction: Bullish
- Upside Target: $0.24
- Downside Target: $0.116
Closing Thoughts:


