Save 23% ($351) & Get a Free 1-1 Call with our Team ⏰ : 0d 2h 59m 43s
BTC, ETH, SOL await breakouts as WIF and POPCAT dip
As Bitcoin steadies near $98,900 support, Ethereum and Solana face resistance, while WIF and POPCAT lag. With FOMC approaching, the market remains uncertain. Let’s break down the latest price action and what’s next for these key assets.
Disclaimer: This is not financial or investment advice. You are responsible for any capital-related decisions you make, and only you are accountable for the results.
BTC:
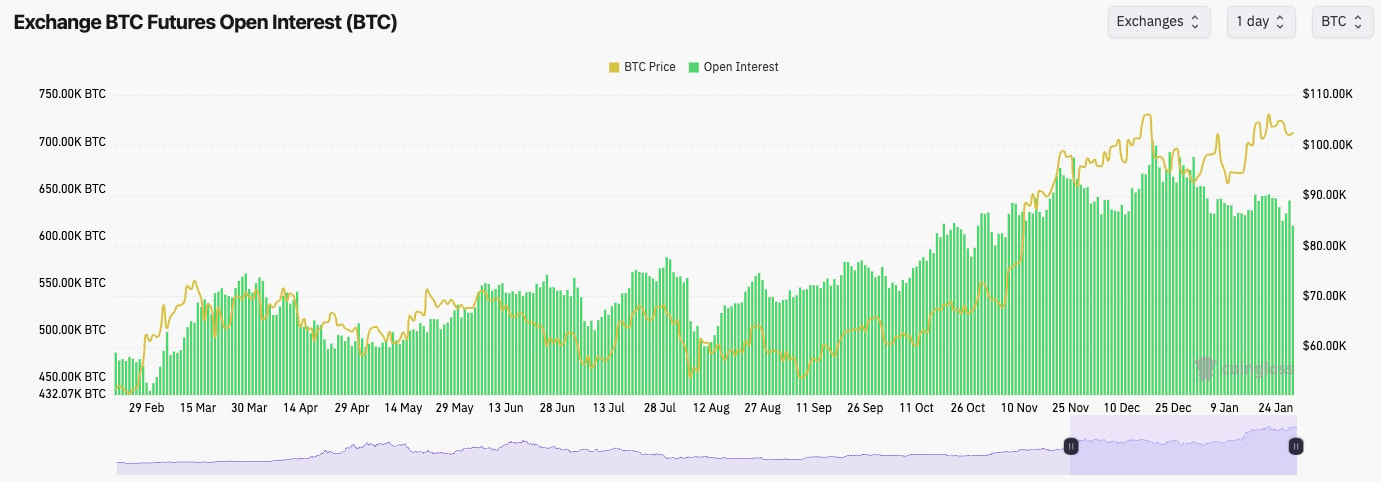
- BTC's Open Interest has continued its decline over the past few days, meaning that there's less of a leverage build-up.
- BTC's Funding Rate is at 0.01%, indicating there's an even balance between Longs and Shorts.
- Overall, this is a healthier leverage market, but that also doesn't mean that the rice has to go up because of it.
Technical analysis
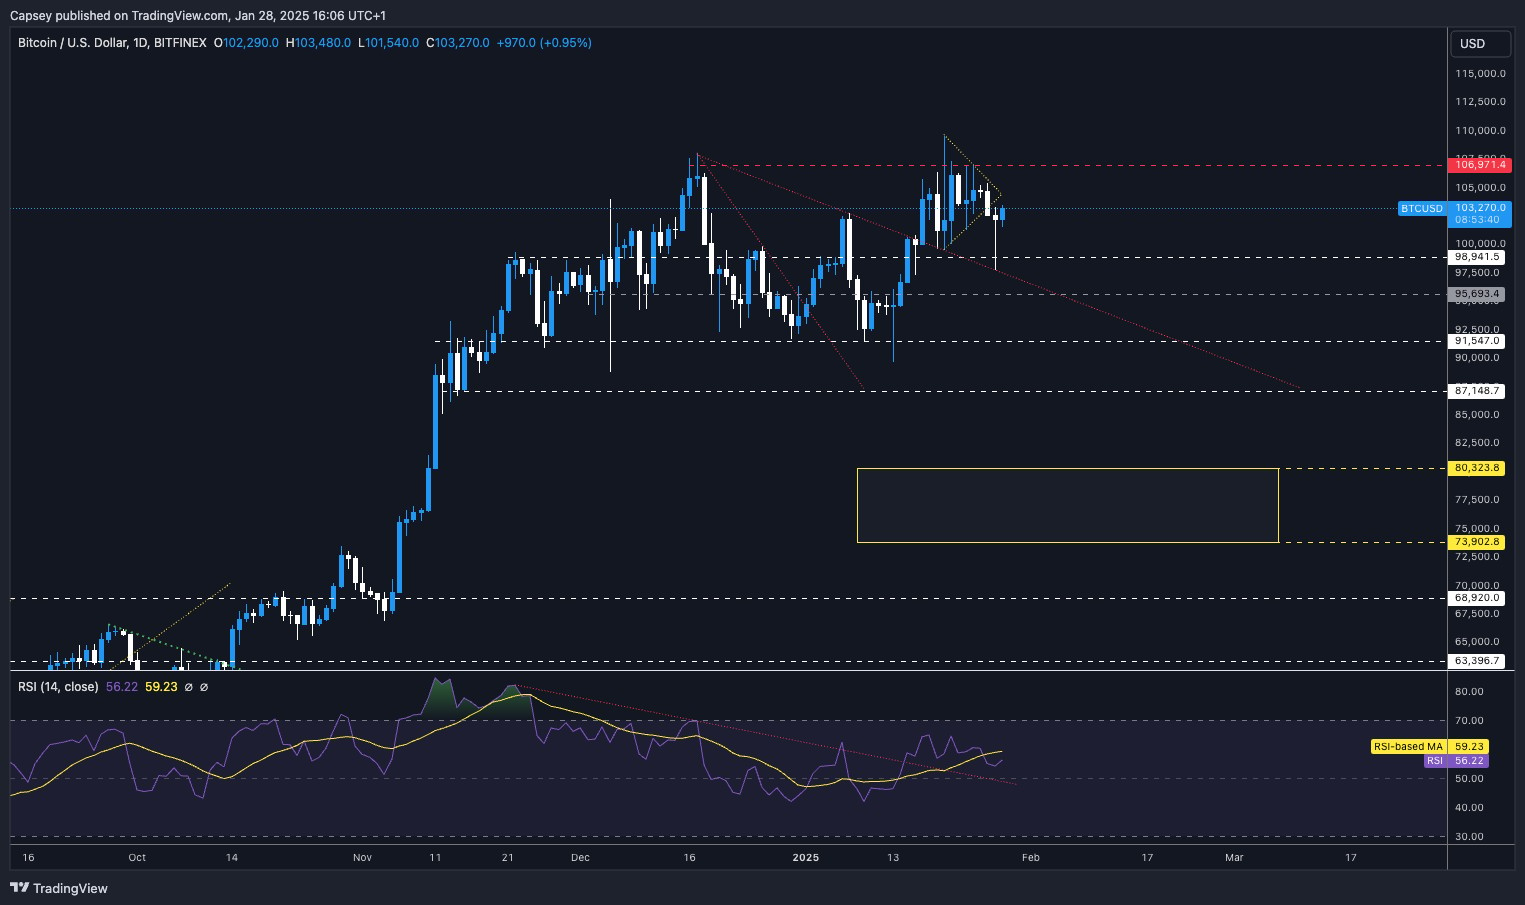
- BTC rejected into the main horizontal resistance of $107,000. This was following the announcement of 'exploring a stockpile' and not a mention of a 'Strategic Bitcoin Reserve'.
- Price formed a bullish pennant but then broke down from that pennant off the back of the DeepSeek news yesterday.
- However, the price bounced strongly from the horizontal support of $98,900, and the downtrend line was used as support.
- Price is currently just choppy and range-bound between the horizontal support of $98,900 and the horizontal resistance of $107,000.
- The RSI is in the middle territory, and for now, the only negative here is that it's below its moving average. However, that isn't something we'd get too caught up with.
Get the latest Bitcoin price prediction—dive into our detailed analysis to stay one step ahead!
- Next Support: $98,900
- Next Resistance: $107,000
- Direction: Neutral
- Upside Target: $107,000
- Downside Target: $95,700
Cryptonary's take
Considering what Alts, Meme's, and TradFi markets have done over the last few days to a week, Bitcoin has held up really impressively. This is probably due to the fact there is this Institutional adoption happening, especially now that SAB21 has been overturned.But in the short-term, it's possible BTC price is still a tad ahead of its ski's post-Trump excitement. We're also going into an FOMC tomorrow, and the expectation is that Powell will continue in a hawkish tone.
Ultimately, for now, we need to see BTC show us the direction, with either a breakout or a breakdown. There's an edge really in this choppy, range-bound price action, and in this situation, it's best to sit tight and let the market show you its hand first before you then act on that. We wouldn't be surprised if the price remained range-bound for more time as well.
ETH:
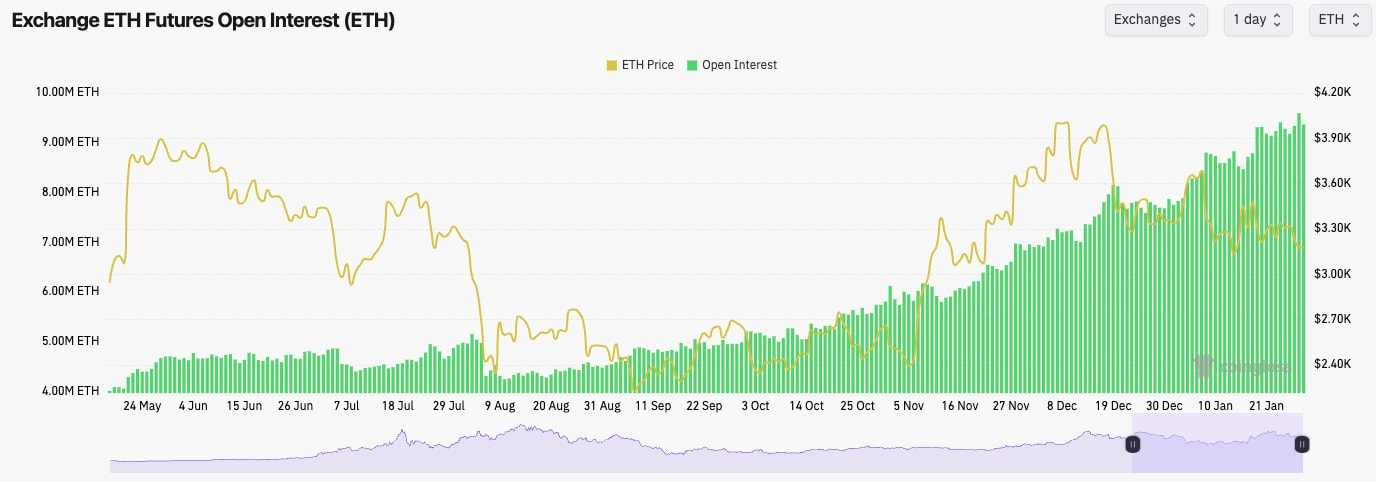
- ETH's Open Interest is still sky-high due to the cash-and-carry trade. It's becoming somewhat pointless to look at ETH's OI because of this.
- ETH's Funding Rate is at 0.008%, suggesting there's an even mix of Longs and Shorts.
Technical analysis
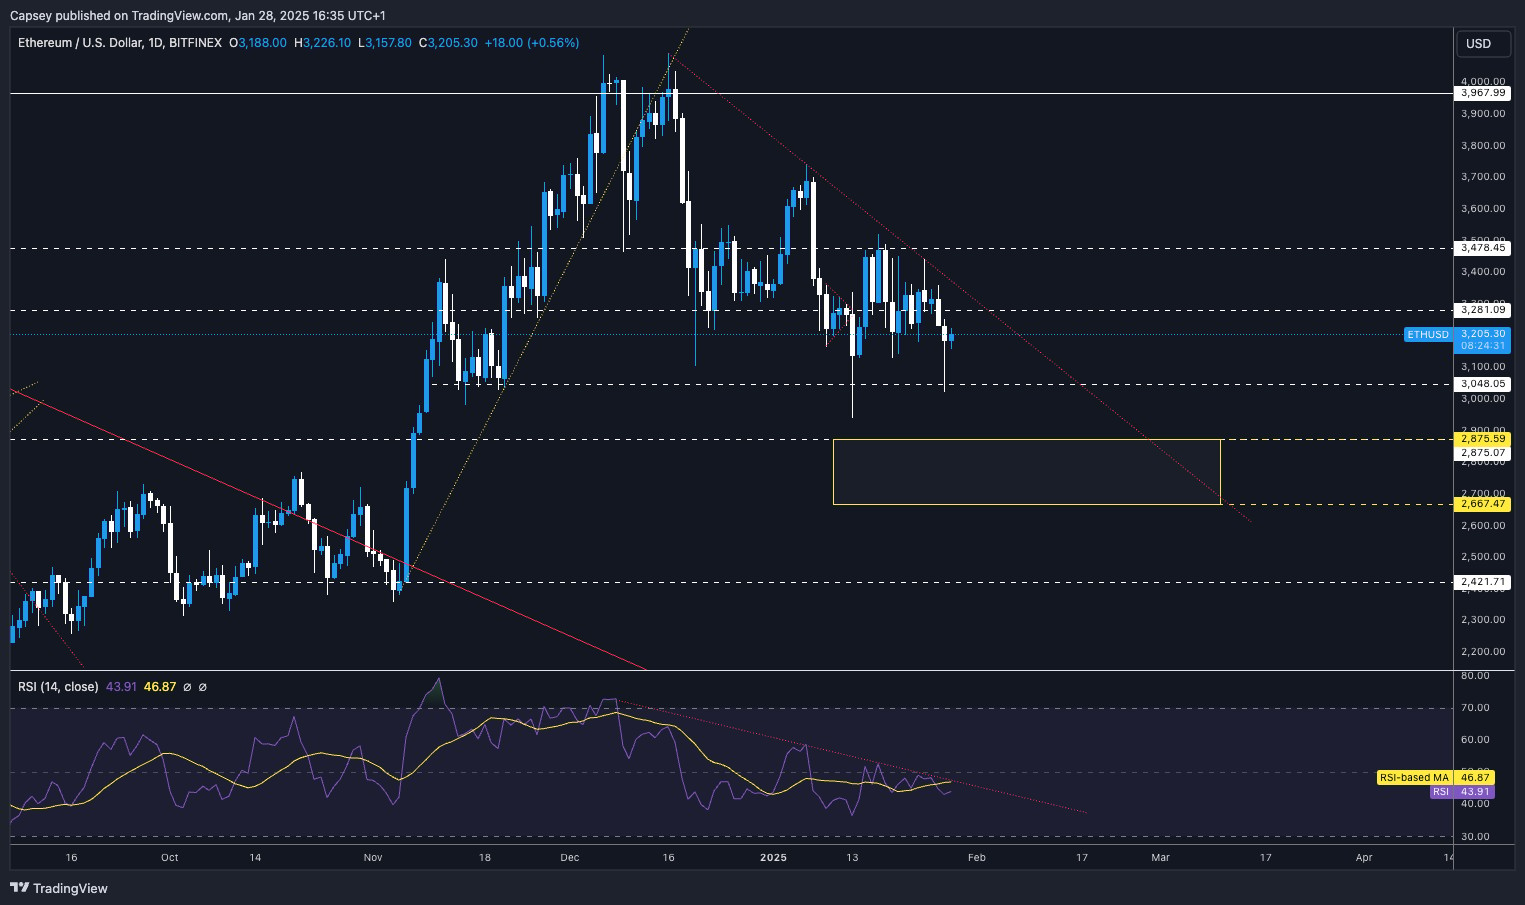
- ETH has broken down from its main horizontal resistance of $3,480 and is also rejected at the main downtrend line.
- Price has then broken below the next horizontal level of $3,280, but we are seeing the $3,050 hold as support for now.
- The RSI is in middle territory, but it's in a downtrend and also below its moving average.
- The key breakout will be a move above $3,480 and a break above the downtrend line.
- Next Support: $3,050
- Next Resistance: $3,280 (then $3,480)
- Direction: Neutral/Bearish
- Upside Target: $3,280
- Downside Target: $2,900
Cryptonary's take
ETH has been pretty boring here, and there isn't a mega-development beyond our last update. However, the new information we have is that ETH hasn't broken out of its downtrend line, and it's now also below the horizontal level of $3,280 - last time, it was butting up to $3,480 (the key breakout level).It's possible ETH can move back up to $3,400 - $3,500; however, we wouldn't be surprised if the Yellow box is eventually filled in the coming weeks. Again, this is another that we'll wait on for it to show us direction.
SOL:
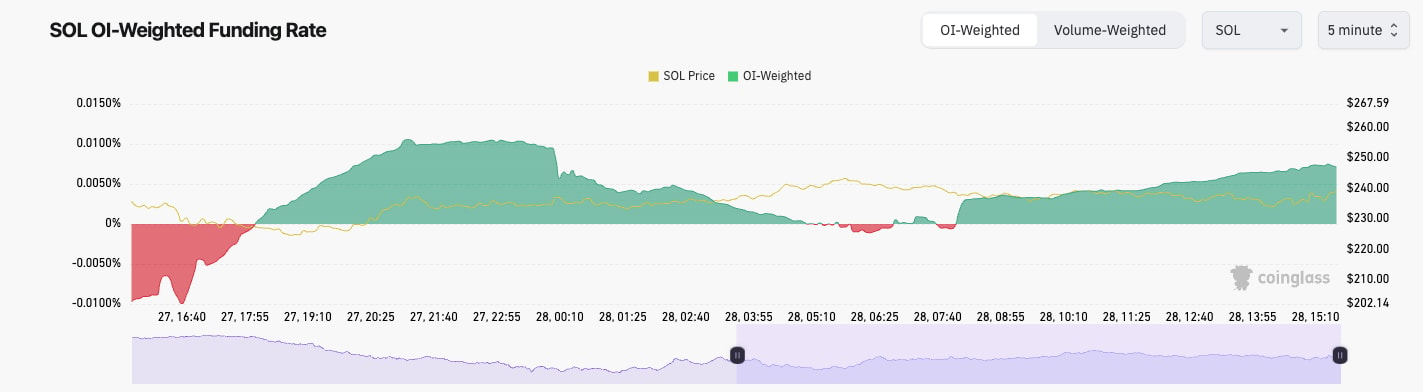
- Interestingly, SOL's Open Interest (by number of coins) is down substantially but this is potentially due to the price now being much higher.
- SOL's Funding Rate has been very choppy, flipping from positive to negative. This has likely been due to traders playing the range between $220 and $260.
Technical analysis
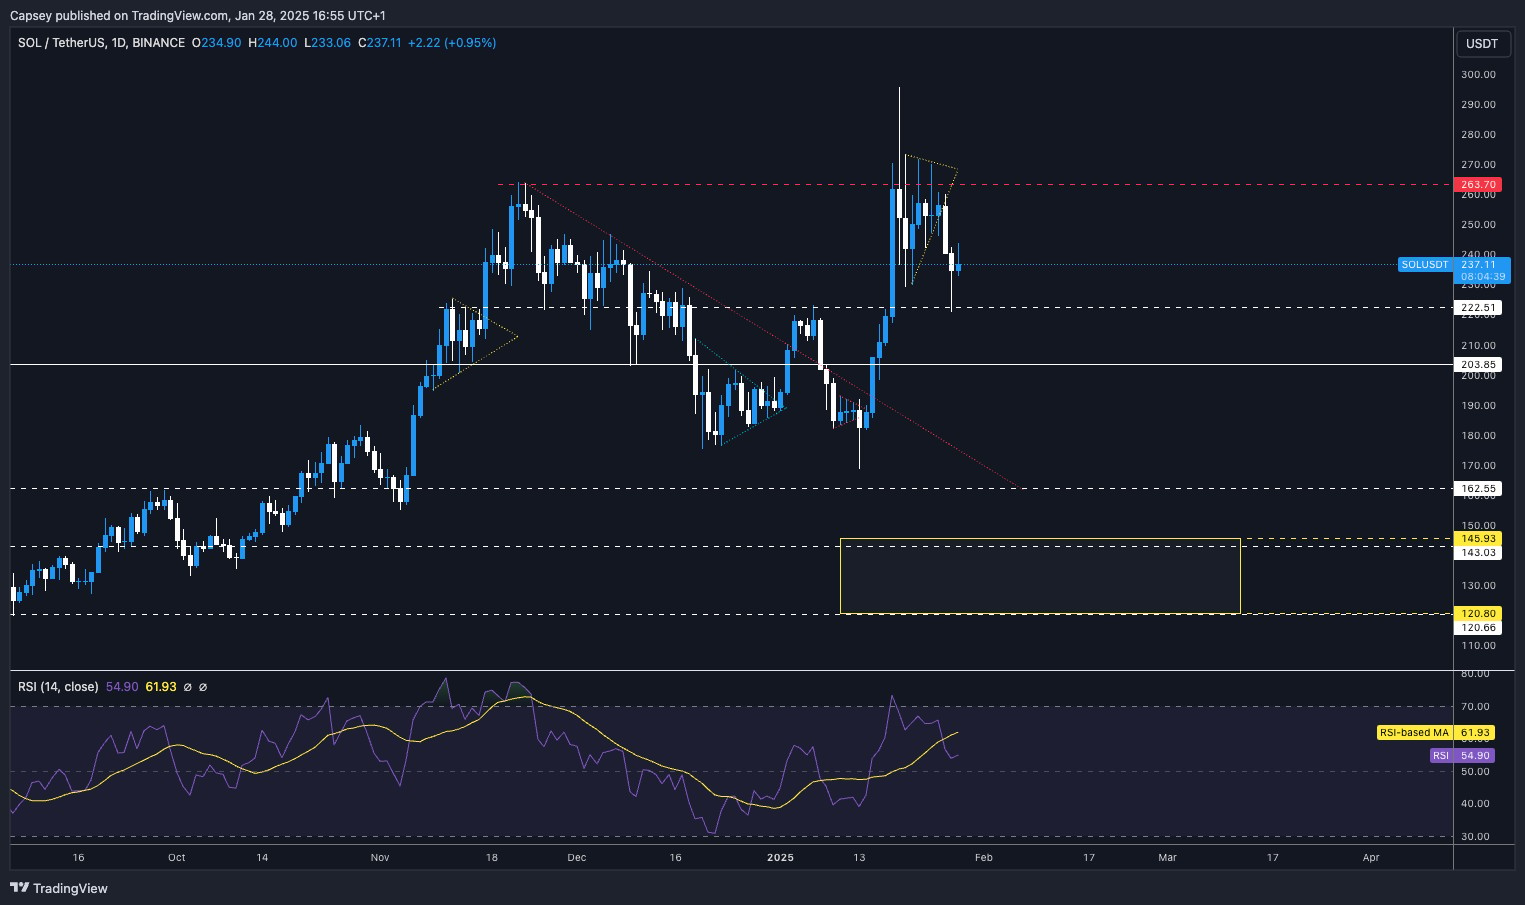
- SOL formed a pennant pattern but into the horizontal resistance of $263.
- Unfortunately, the price was rejected from the pennant and broke down to the horizontal level of $220, where bids came in and the price bounced. These key horizontal levels we have marked are really solid and tend to work regularly.
- Like many of the coins, the price is now in the middle of a larger range, between the $220 horizontal support and the $263 horizontal resistance.
- The RSI is in the middle territory, but it's below its moving average, although again, this isn't a major concern for us currently.
- Next Support: $220
- Next Resistance: $263
- Direction: Neutral
- Upside Target: $260
- Downside Target: $200
Cryptonary's take
Again, like BTC and ETH, SOL is in its larger range now, and we'll be waiting for the price to show us the way. However, we will also be a bit more practical with SOL in that if SOL pulls back into the $200 to $220 zone (particularly if it's around $200), we'll add to our long-term Spot positions.In the meantime, we'll remain patient and let price action show us the way. For now, we still have a short-term bearish tilt amongst the Majors, but let's stress the short-term point.
WIF:
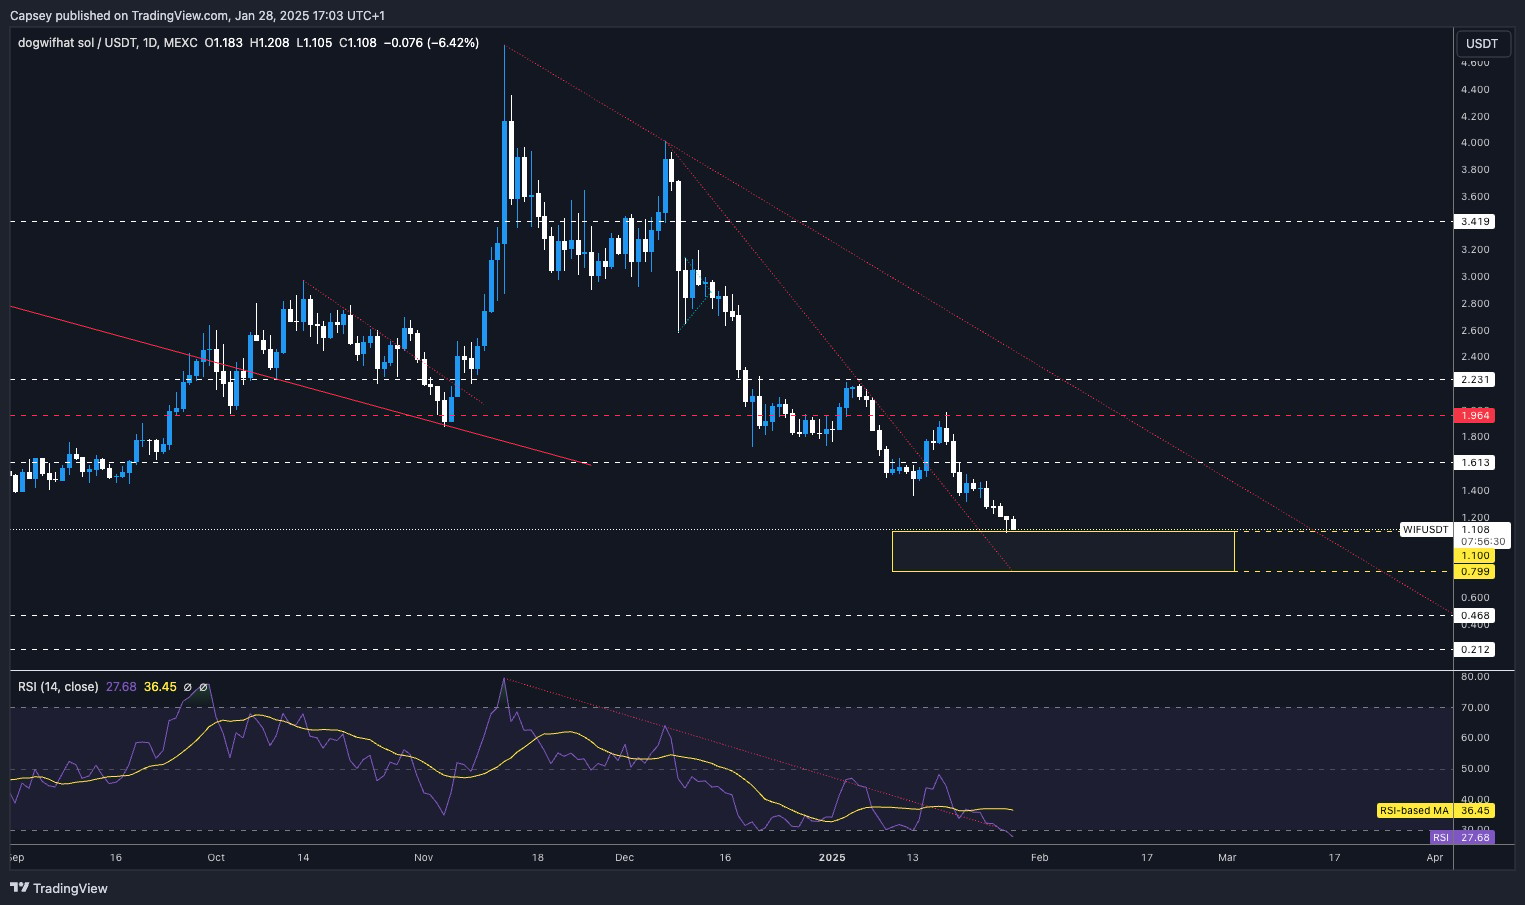
- WIF made a breakout of the local downtrend line, which shoved the price into the $1.96 horizontal resistance.
- The price was then rejected from there, and it lost the key horizontal level of $1.60.
- Price has now reached/touched our Yellow Target Box, as we called for over a month ago.
- The RSI is very oversold, and even though we've had some bullish divergences form, they haven't led to more substantial breakouts.
- Currently, the RSI is very oversold in the daily timeframe. The last time this was oversold was August 5th (Yen Carry trade unwind).
- We are looking for the $1.00 to $1.20 area to become a new zone of support.
- Next Support: $1.00
- Next Resistance: $1.60
- Direction: Neutral/Bearish
- Upside Target: $1.40
- Downside Target: $0.90
Cryptonary's take
WIF has really underperformed, unfortunately. However, it's now so oversold that it's not an attractive sell at these prices. But the journey going forward may be a tricky one as we're not expecting a straight move back up to the highs.What we're currently looking for here is for a rounding bottom to be formed, and we think that can be in the Yellow Box. If we get this, that might be the base that's needed for the price to then get a more substantial bounce. For now, it's wait and see.
POPCAT:
- It's a really brutal pullback and just very small periods of relief that haven't ended up mounting too much.
- POPCAT had a brief attempt at breaking out from the downtrend line, but the price rejected into the horizontal level of $0.72 and has since pulled back 50%.
- Having lost a number of key horizontal supports, the price has now pulled back to its Yellow box. If this box is lost, then the horizontal level of $0.23 is on the cards.
- The RSI is close to oversold territory, and it is now putting in its second bullish divergence. If the price can flatten out here (form a rounded bottom), that might be enough for the price to then see a more substantial bounce.
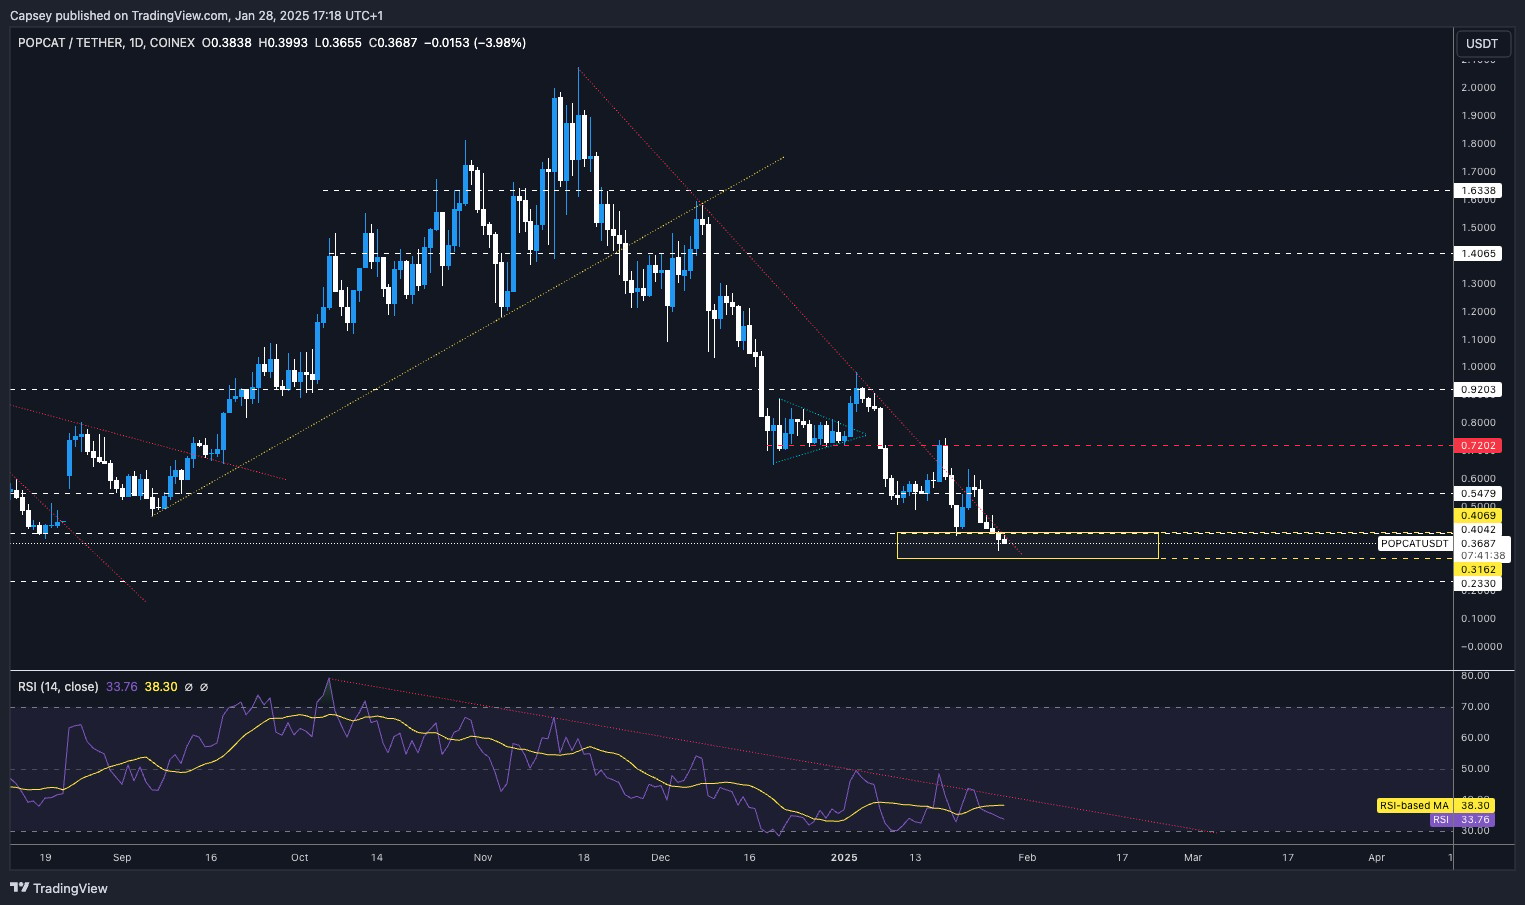
- Next Support: $0.30
- Next Resistance: $0.40
- Direction: Neutral/Bearish
- Upside Target: $0.60
- Downside Target: $0.23
Cryptonary's take
POPCAT is going to need real risk-on appetite to return in order to see a more substantial bounce. Now that a second bullish divergence is forming close to oversold territory, this is setting up some of the conditions needed for a more substantial bounce to happen. Like WIF, we want to see that rounded bottom form and the bullish divergences remain, and then POPCAT can set for a great Long opportunity.In the long term, WIF and POPCAT have been hit reputationally, and we've seen other plays run while they haven't. This is opening up the door for us to consider the thesis of whether new cycle memes can remain Blue Chips or whether we are just in a major rotation game, and it's about chasing the hot metas.
Recommended from Cryptonary


