Save 23% ($351) & Get a Free 1-1 Call with our Team ⏰ : 0d 2h 59m 43s
BTC, ETH, SOL, DOGE & SPX – reversal or another leg down?
Crypto markets remain choppy as Bitcoin hovers near key resistance, Ethereum eyes a breakout, and Solana tests support. Dogecoin and SPX also present crucial setups—let’s break down what’s next for these major assets.
Disclaimer: This is not financial or investment advice. You are responsible for any capital-related decisions you make, and only you are accountable for the results.
BTC:
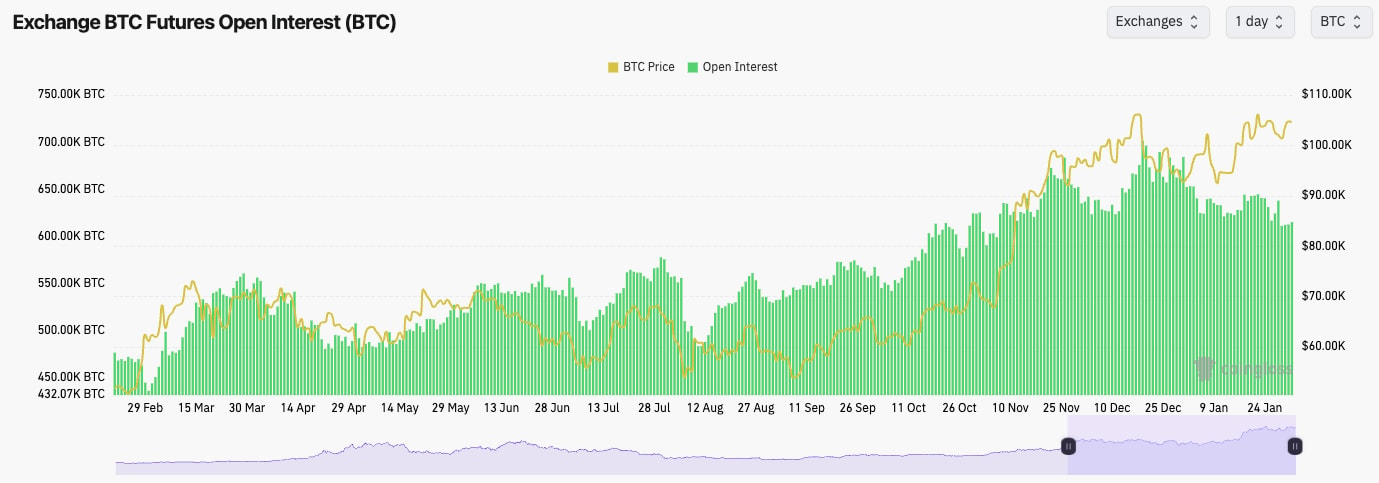
- We're seeing a lower BTC's Open Interest trend, which suggests there's less demand amongst traders to leverage it. This is positive but also expected when the market is in more choppy conditions.
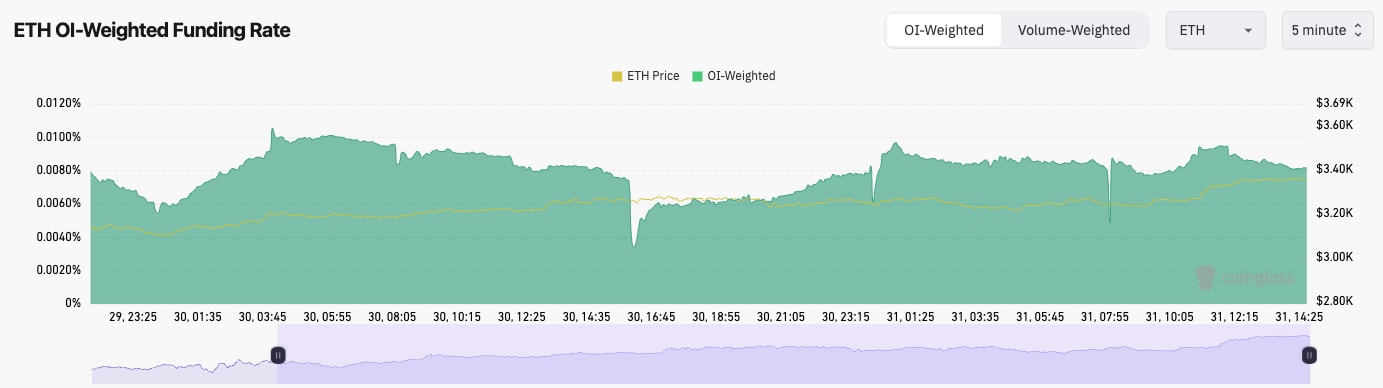
- Funding Rates range from 0.00% to 0.01%, indicating there's an even balance between Longs and Shorts.
Technical analysis
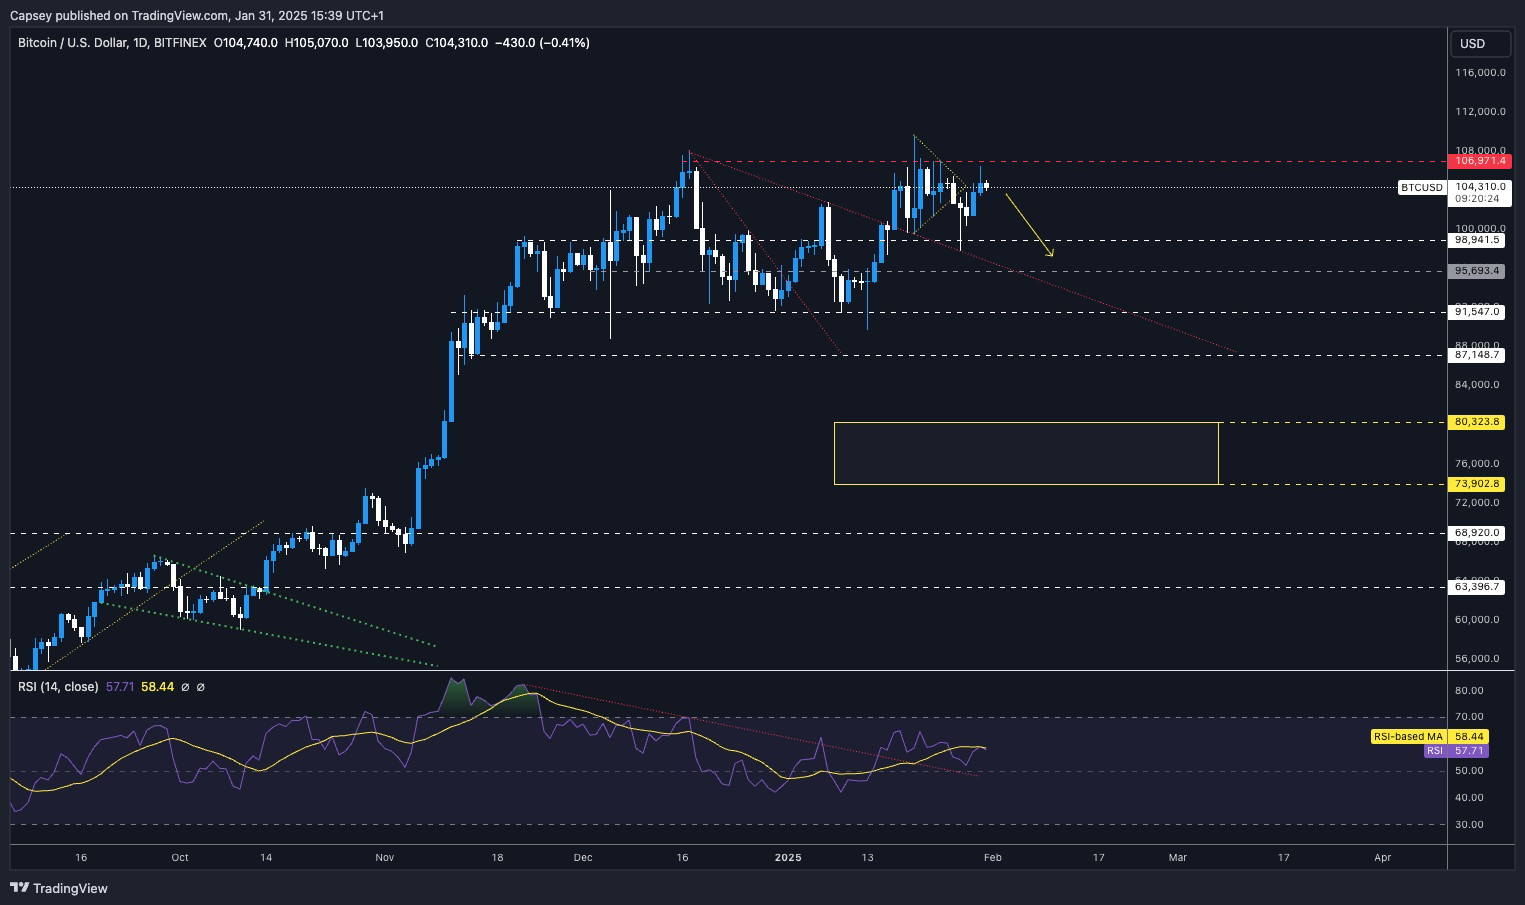
- Next Support: $98,900
- Next Resistance: $106,900
- Direction: Bearish/Neutral
- Upside Target: $106,900
- Downside Target: $95,700
Cryptonary's take
Bitcoin currently ranges between $95,700 and $106,900. Whilst we're in this post-Trump inauguration period where too much good news was priced in (the market had overpriced against a realistic reality), it's possible now that we do see a pullback for BTC in the coming 1-2 weeks. It's possible BTC pulls back to $95,700 to say $98,900.We have highlighted this with a yellow arrow on the chart. We'll add two other things to this. Firstly, if BTC does pull back 5-10%, it doesn't necessarily mean Alts/memes will have another major pullback. Looking across the board, we feel most of the Alts/Memes have done the substantial portions of their pullbacks, but we also think they'll be range-bound for a while.
Secondly, in a range-bound market, it doesn't mean there won't be good pockets of outperformance. For example, $HYPE over the last 3-5 days has heavily outperformed.
ETH:
Technical analysis
- ETH is interesting here. The price bounced off the main horizontal support of $3,050.
- Price is now attempting a break above the horizontal level of $3,280 whilst it's also looking to break out of the main downtrend line.
- The key for a major breakout here will be for the price to break the main horizontal resistance at $3,480.
- If the price can break out at $3,480 (we're sceptical in the short-term), then $3,700 is the target.
- The RSI is also attempting a breakout above the downtrend line and the moving average. We really need to see this move stick to potentially see a more substantial upside.
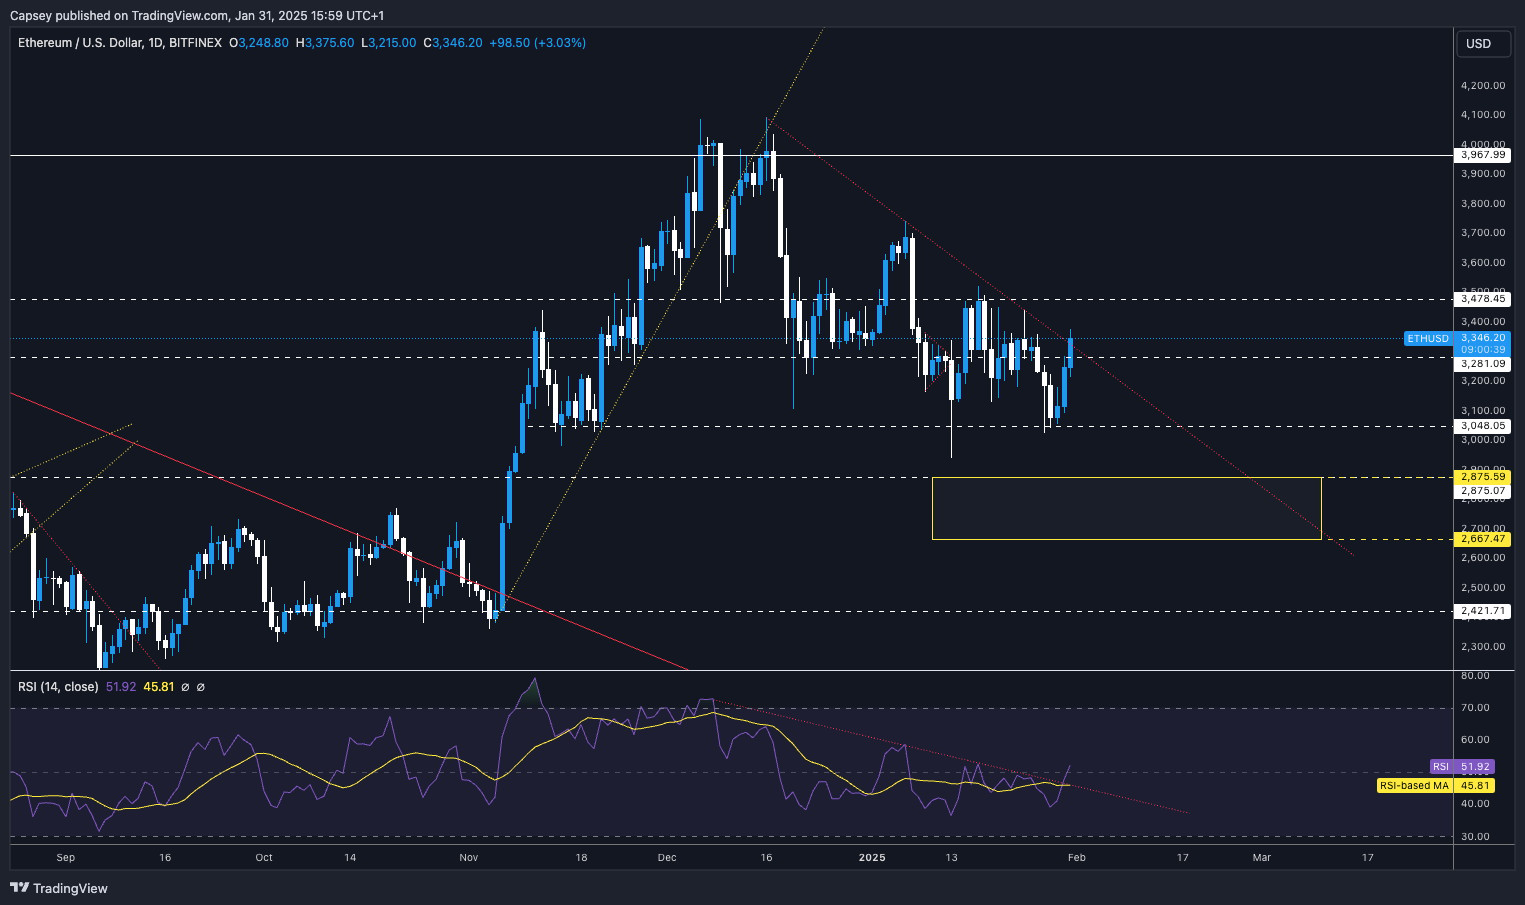
- Next Support: $3,280
- Next Resistance: $3,480
- Direction: Neutral
- Upside Target: $3,700
- Downside Target: $3,050
Cryptonary's take
ETH is at a really key level here as it is trying to break out. A breakout of the downtrend line and $3,480 horizontal resistance is a big ask, so we are sceptical. But this is what's needed to get that breakout.If the price were to break out, it would be a huge sign-off strength, and this may actually lead to other plays/sectors also having more substantial rebounds. Unfortunately, we're not expecting a substantial breakout in the short term, and we're still thinking that ETH can revisit $3,050 before it touches the Yellow Box. But we're expecting $3,050 as a minimum retest again.
SOL:
Technical analysis
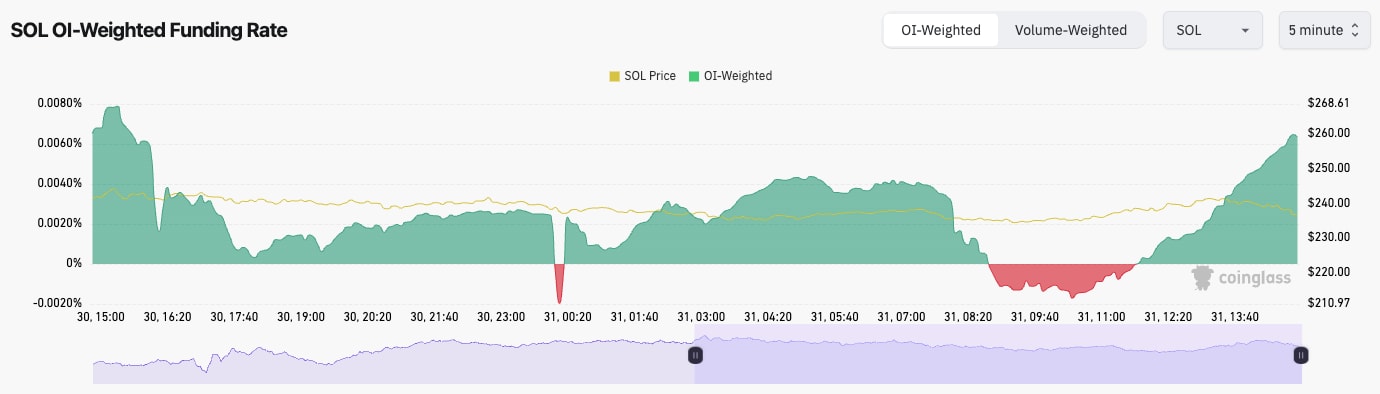
- SOL bounced off the main horizontal support of $220, and the price has now bounced up to the local horizontal level of $240.
- Price is in a larger range here between $220 (horizontal support) and the major horizontal resistance at $263.
- The RSI is in the middle territory, but it's below its moving average.

- Next Support: $220
- Next Resistance: $263
- Direction: Neutral
- Upside Target: $263
- Downside Target: $220
Cryptonary's take
There's no need to go heavy in detail here. SOL is just a range bound between $220 and $263, and we're expecting that to continue in the short term. Of course, a breakdown of the key levels ($220 and $263) will be the key thing to watch. Be patient with this and just let time give you/us more candles and, therefore, more information. There's no point getting stuck into (trading) something that's in the middle of a larger range. If we had to call it, we'd say there's more chance of a retest of $220 first than a retest of $260.DOGE:
- DOGE has once again held the major horizontal support at $0.30, and the price has bounced from there.
- Price is attempting a breakout of its main downtrend line, as well as its local downtrend line.
- The key level for the price to reclaim will be the horizontal resistance of $0.35. Beyond that, $0.39 is the main horizontal resistance.
- The RSI is in the middle territory, but it's also now butting up into its moving average, which may become resistance.
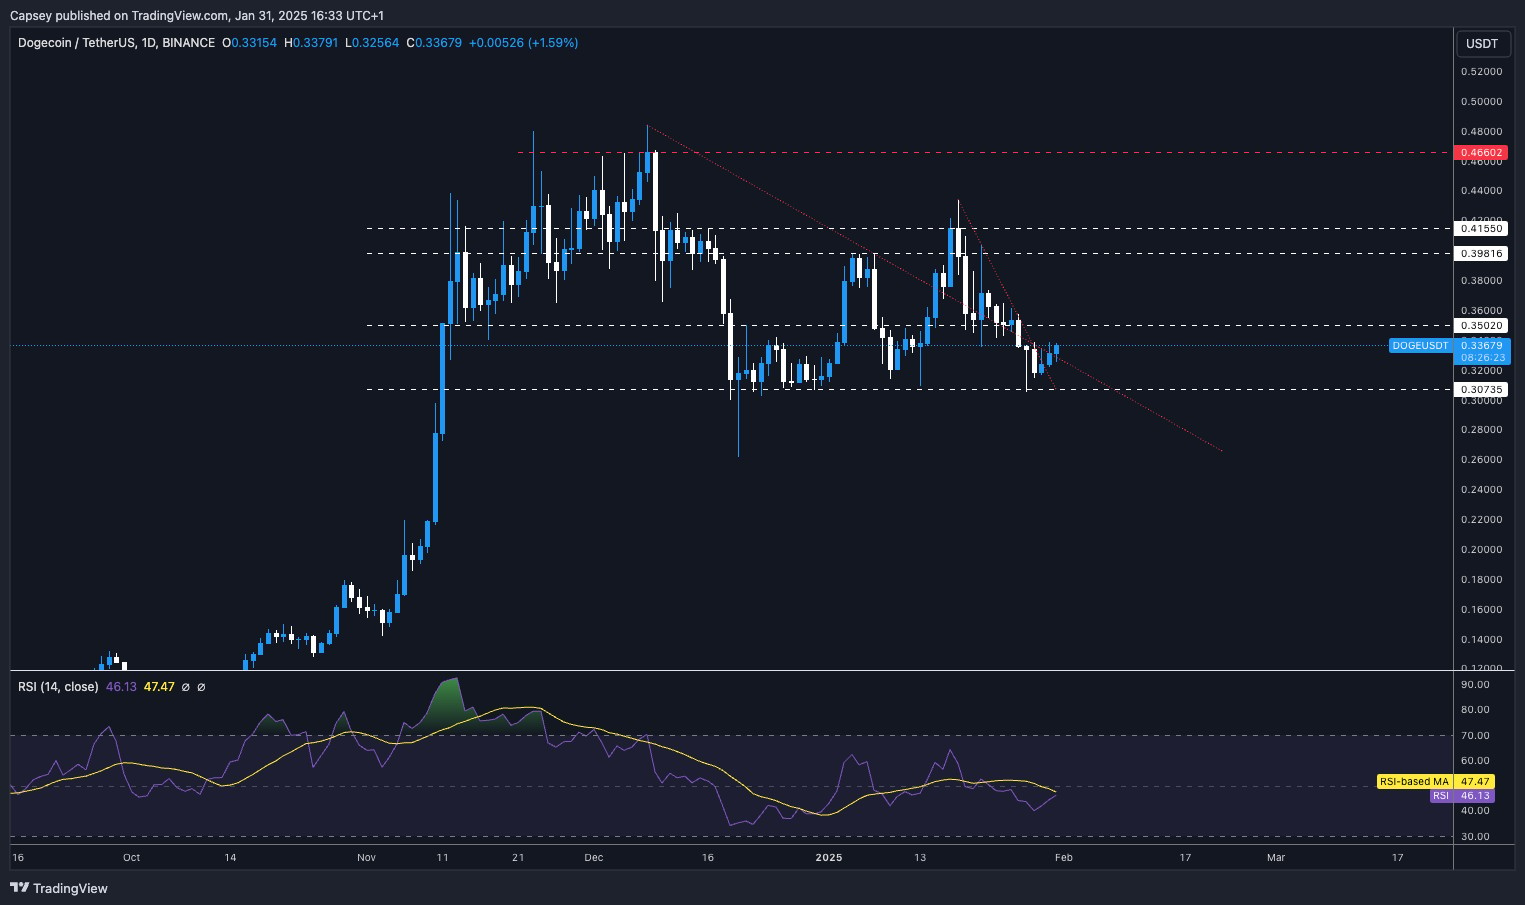
- Next Support: $0.30
- Next Resistance: $0.35
- Direction: Neutral/Bullish
- Upside Target: $0.40
- Downside Target: sub $0.30
Cryptonary's take
Again, whilst we're sceptical of a major breakout, we're still watching intently. A breakout for DOGE above $0.35 would likely be mega and give other Alts/memes the fuel to run higher also. DOGE is also now the only major meme that's held its structure (it hasn't broken below key support of $0.30), whereas everything else (major memes-wise) has.If DOGE can recover and break higher, that would be great for other memes. We're sceptical of a major breakout, and we think $0.35 might be a sticking zone for the price, but let's see how this unfolds over the weekend.
SPX:
- SPX has performed well in that many other coins have had sizeable pullbacks, where SPX has held between $1.00 and $1.60.
- Price has bounced from the lows and the horizontal support of $1.00, and it's now breaching the downtrend line.
- It's possible we see SPX pull back, find some support at $1.20, and then have a more substantial breakout from there.
- The main horizontal resistance will be at $1.55.
- In terms of support, $1.00 to $1.20 is a big zone of support for SPX.
- One thing we do note is the downtrending volumes. This is somewhat a cause for concern, but it may also mean the price can shove higher if the volumes really kick up and their bids.
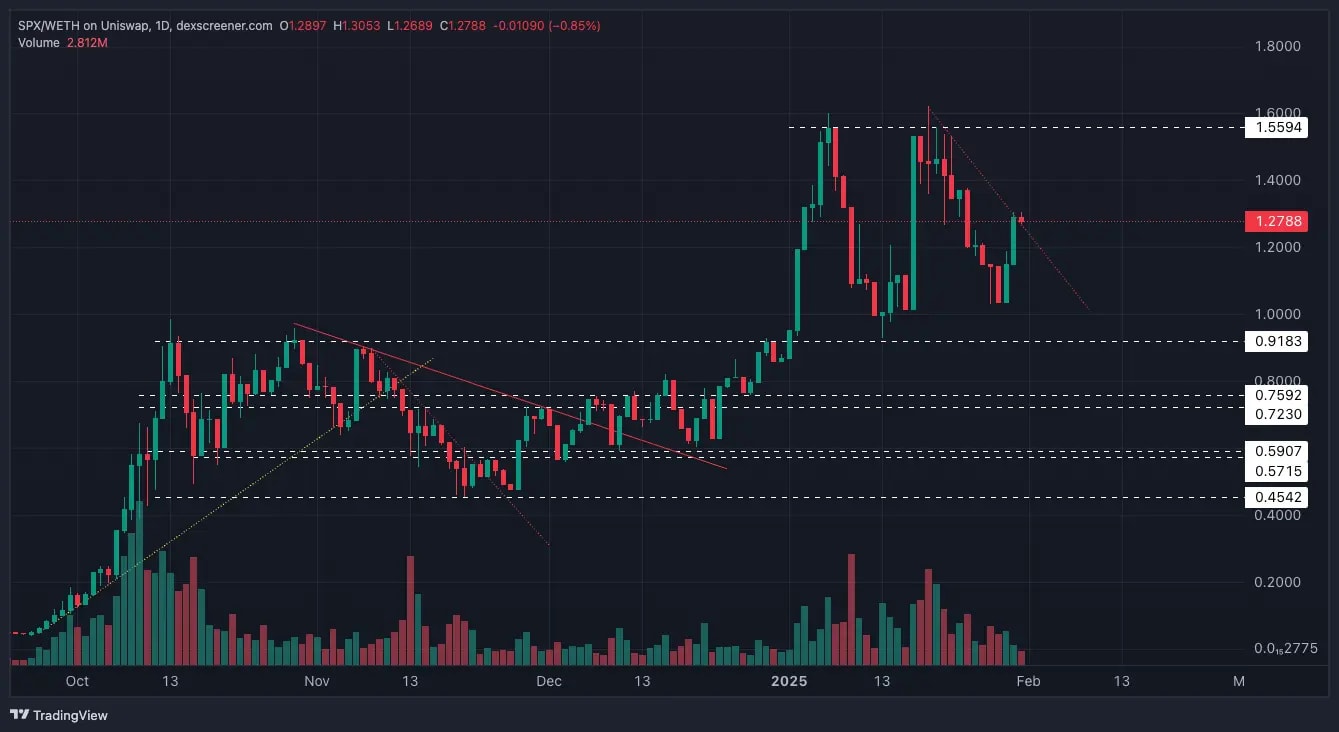
- Next Support: $1.20 (then $1.00)
- Next Resistance: $1.60
- Direction: Neutral
- Upside Target: $1.60
- Downside Target: $1.00
Cryptonary's take
SPX has been surprisingly strong, particularly when you look at other Memes and other major memes. For price now, we'd like to see a retest of $1.20 and then a breakout higher from there. SPX is in middle territory here, and we're also seeing the downtrending volumes, so it's tricky to call price action here. In the short term, on SPX, we remain neutral rather than bullish or bearish.Recommended from Cryptonary


