Save 23% ($351) & Get a Free 1-1 Call with our Team ⏰ : 0d 2h 59m 43s
Disclaimer: This is not financial or investment advice. You are responsible for any capital-related decisions you make, and only you are accountable for the results.
BTC:
- BTC's funding rate has fluctuated between slightly positive and slightly negative, as we can see below. This indicates a lack of conviction amongst traders, who are flip-flopping between Longing and Shorting.
- BTC's Open Interest increased substantially from the lows, up approximately 20%. This was leverage traders chasing the price higher as it moved into the $87k to $88k area. Although this wasn't matched by strong Spot buying, hence we've seen the move higher be relatively weak and short-lived.

Technical analysis
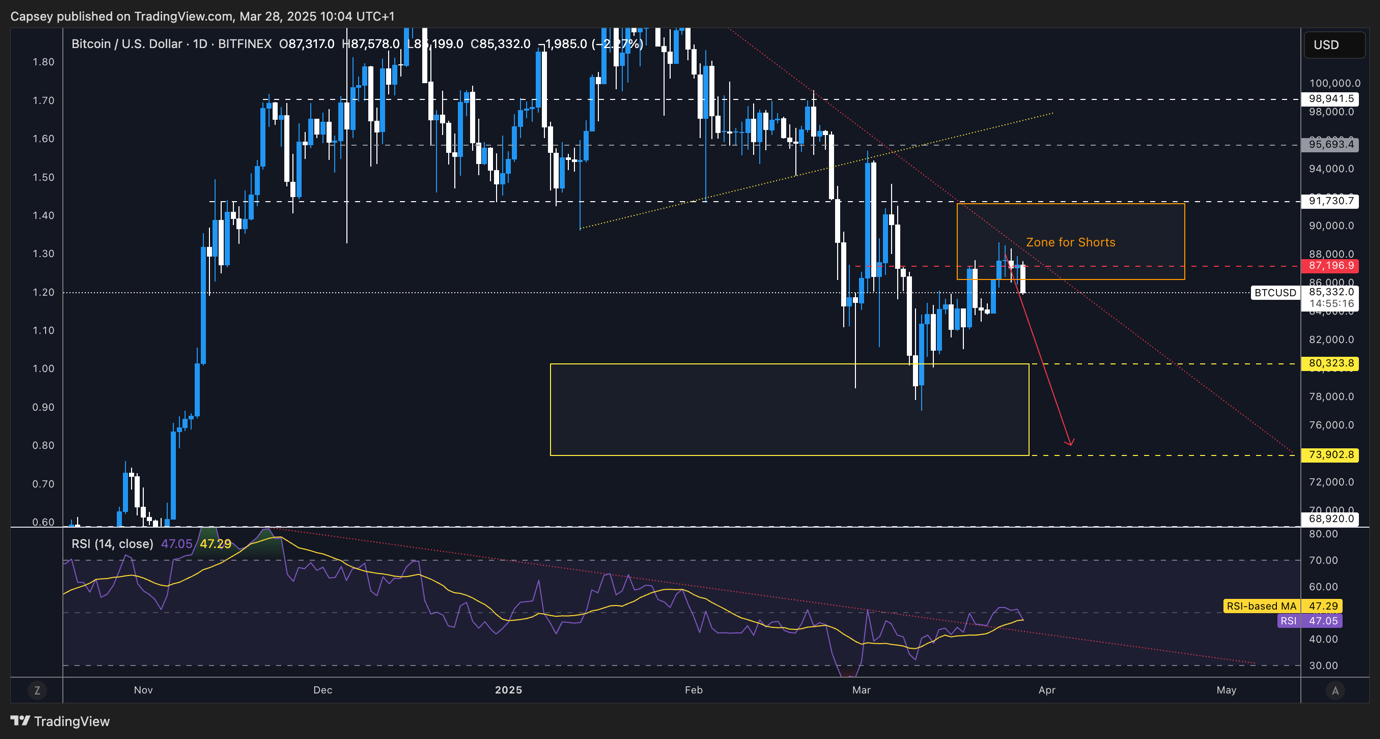
- BTC has seemingly rejected into the 'Short Box' we identified between $86,300 to $91,700.
- Price rejected into the main downtrend line (red line).
- Price has now pulled back to the local support of $85,000, although the major horizontal support is at $78k.
- To the upside, $87,200 is a key local horizontal level for price to reclaim and hold above. If price can do this, then $91,000 to $91,700 is a potential target, and we'd reassess at that point. However, we don't see this happening in the short-term.
- The RSI downtrend line has seen a breakout with the RSI now sat on top of it's moving average and in middle territory. This could help the $85,000 area be a local support.
- Next Support: $85,000
- Next Resistance: $88,500
- Direction: Bearish
- Upside Target: $88,500
- Downside Target: $82,000
Cryptonary's take
BTC has moved into our 'Short Box' that we had identified a number of weeks ago. We had to be patient in letting the price grind up to the box and to fill Short orders, which have now filled between $86,300 and $88,600.We are of the view that the recent move up has just been a small relief rally and not much more than that. We expect BTC to move down to retest $82k as a minimum target over the next week or two. However, we see the possibility of a retest of $78k as somewhat likely as well.
ETH:
- ETH's Open Interest continues to soar higher as traders/institutions take advantage of the 'cash-and-carry' trade - Buy Spot ETH, Short the Perps contract and profit from being paid the Funding Rate.
- ETH's Funding Rate has remained mostly positive, indicating traders have been more willing to be Long than Short.

Technical analysis
- ETH rejected into $2,100, which was where the bottom wicks lined up previously.
- We expected the major horizontal resistance of $2,160 to not be surpassed, and we presumed it would be tested, considering ETH was getting a relief rally after a really strong downtrend. However, it wasn't even retested.
- ETH is now seemingly breaking below the local support of $1,950.
- The major horizontal support for ETH is at $1,745. We expect this to be retested sometime over the next fortnight. We're not sure exactly when, but we do think it's inevitable.
- ETH's RSI broke out of it's downtrend line, but it has swiftly rejected and fallen back into the trend, with it now also breaking below its moving average. Not great to see.

- Next Support: $1,745
- Next Resistance: $2,160
- Direction: Bearish
- Upside Target: $2,160
- Downside Target: $1,745
Cryptonary's take
ETH still looks very weak, and each time it gets to a key level to stage a test, it seems to fail, eg, it couldn't even retest $2,160 in this relief rally. We are expecting a retest of $1,745 in the coming week or two.If/when ETH gets there, we'll reassess, as it's possible another bullish divergence might form close to oversold territory, whilst ETH is moving into a major horizontal support. That might provide an opportunity for a Long. But let's see if our thesis plays out, and we'll reassess closer to the time.
SOL:
- SOL's Funding Rate has also fluctuated from slightly positive to slightly negative, showing indecision amongst traders.
- SOL's Open Interest (by number of coins) has interestingly spiked to new highs showing that there's still appetite to trade SOL with leverage.

Technical analysis
- SOL saw some relief from the major horizontal support of $120, however price has seemingly rejected into the local resistance level of $148.
- In the short term, price is likely to remain range-bound between $120 and $148.
- Beyond $148, the major horizontal resistance is at $162. We don't expect this area to be reached in the short term.
- If the $120 horizontal support is broken and we still believe this is a possibility over the coming weeks, then $98 is the next major horizontal support. If that level is reached, we'd strongly reassess at the time, but our thinking is that we'd be considering buys there.
- The RSI is in middle territory and it's up trending, however, the RSI is resting on top of its moving average. It'll need to use the moving average as support here. If not, the rice can drive lower.
- The RSI did also put in a hidden bearish divergence when price spiked into $148. This is when price makes a lower high and the oscillator makes a higher high. We've marked this out on the chart (yellow circles).

- Next Support: $120
- Next Resistance: $148
- Direction: Bearish
- Upside Target: $148
- Downside Target: $120
Cryptonary's take
Whilst SOL did show some signs of life, and we did see that in some memes which had strong rebounds, SOL is still unable to reclaim some key levels. This is, however, the case with many coins.For now, we expect SOL to be range bound between $120 and $148, however, we do expect a breakdown (of $120) to be more likely than a breakout to the upside. Therefore, we remain patient in the near-term, and if we're right, we'll reassess upon a break below $120 (again, assuming we're right).
HYPE:
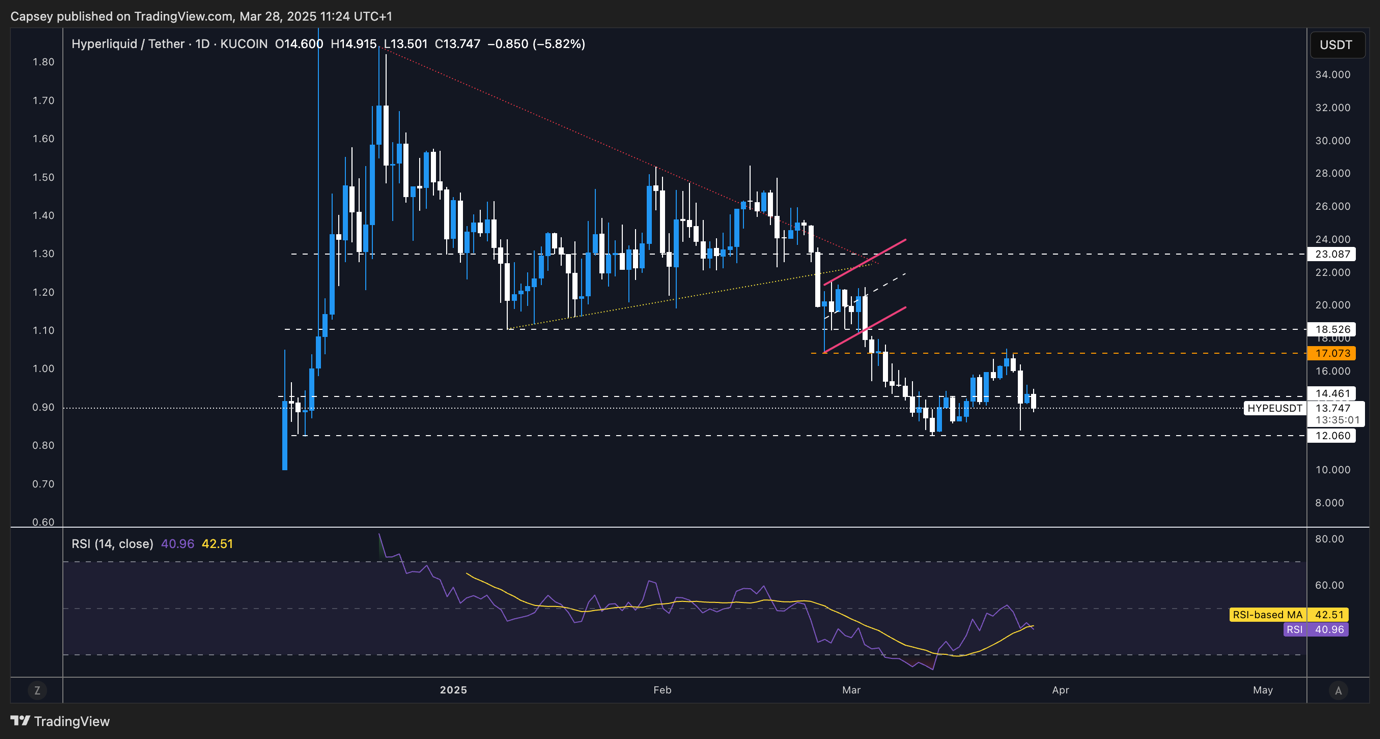
- HYPE bounced from the major horizontal support of $12.00, and it broke above the $14.50 level that we marked out as a horizontal resistance.
- Price then dropped into a local horizontal resistance of $17.00, and following the second 'exploit' on HYPE, price swiftly dropped back to $12.00 but did close more meaningfully higher.
- Looking at this, we can say that HYPE is range bound between $12.00 and $17.00, with the middle horizontal level being $14.46. Above this, bullish; below, bearish. We're keeping it as simple as that for now.
- If the $12.00 horizontal level is lost, then price will be in price discovery to the downside, and there, essentially, the door to single-digit HYPE is open. It's hard to say where a floor level might be, we'll have to just see where that comes (assuming we see a breakdown) when it comes.
- The RSI is now retesting its moving average. Ideally, you'd want it to find support here; otherwise, a break below, and that opens the door for a retest of $12.00 as a bare minimum.
- Next Support: $12.00
- Next Resistance: $14.45
- Direction: Bearish
- Upside Target: $17.00
- Downside Target: $12.00
Cryptonary's take
HYPE is a really interesting one as we've seen HyperLiquid go through controversy recently with these trade attacks ('exploits'). This does open the door for more of a 'black swan' event to occur.We will, however, just continue to assess and play the levels. For now, those levels we've identified are $12.00 and $17.00. We do expect a retest of $12.00 in the coming week, and then the key thing will be if there's a break below. We expect the retest to happen.
If that happens, we'll see and assess the reaction to a potential break below, and how violent that might be. Right now, we're not looking to buy HYPE in the short-term.
Recommended from Cryptonary


