Save 23% ($351) & Get a Free 1-1 Call with our Team ⏰ : 0d 2h 59m 43s
BTC, ETH, SOL & HYPE at make-or-break levels
As market volatility rises, Bitcoin tests crucial support, Ethereum wrestles with resistance, and Solana faces uncertainty. Let’s analyze the latest price action and see what’s next for these top cryptos amid shifting sentiment and funding rate fluctuations.
Disclaimer: This is not financial or investment advice. You are responsible for any capital-related decisions you make, and only you are accountable for the results.
BTC:
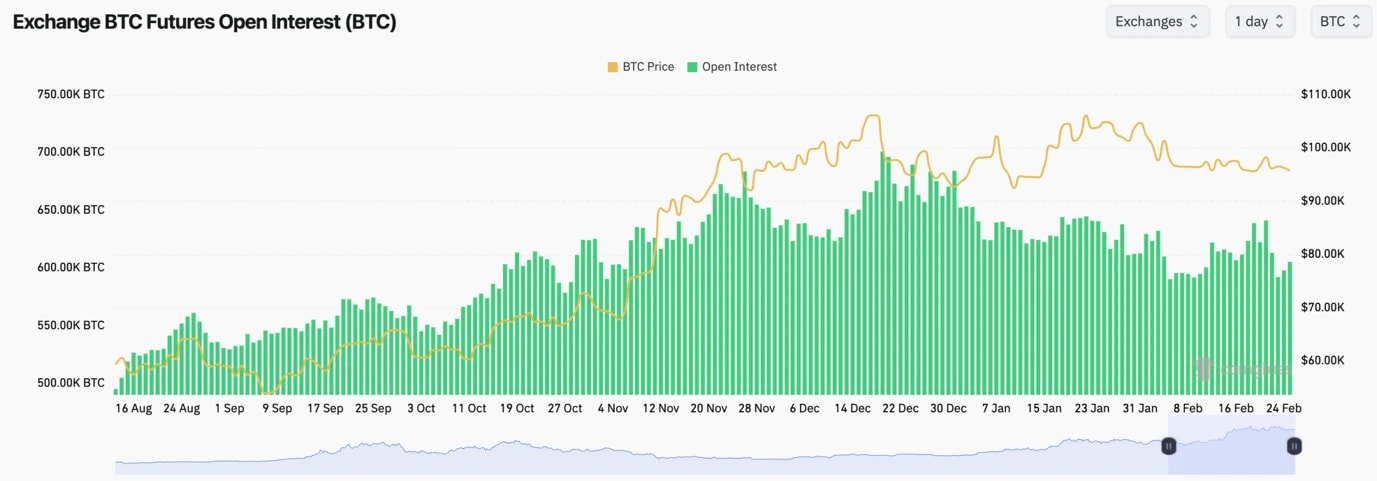
- We're still in a general downtrend for Open Interest, and it was interesting to see the OI pop higher into $99k before the price pulled back and OI came back down and into new lows.
- Interestingly, Funding Rates have mostly stayed positive, meaning Longs are still more dominant.
- This has been contrarian to the rest of the space where we've seen a lot of ALTS have negative Funding Rates.
Technical analysis
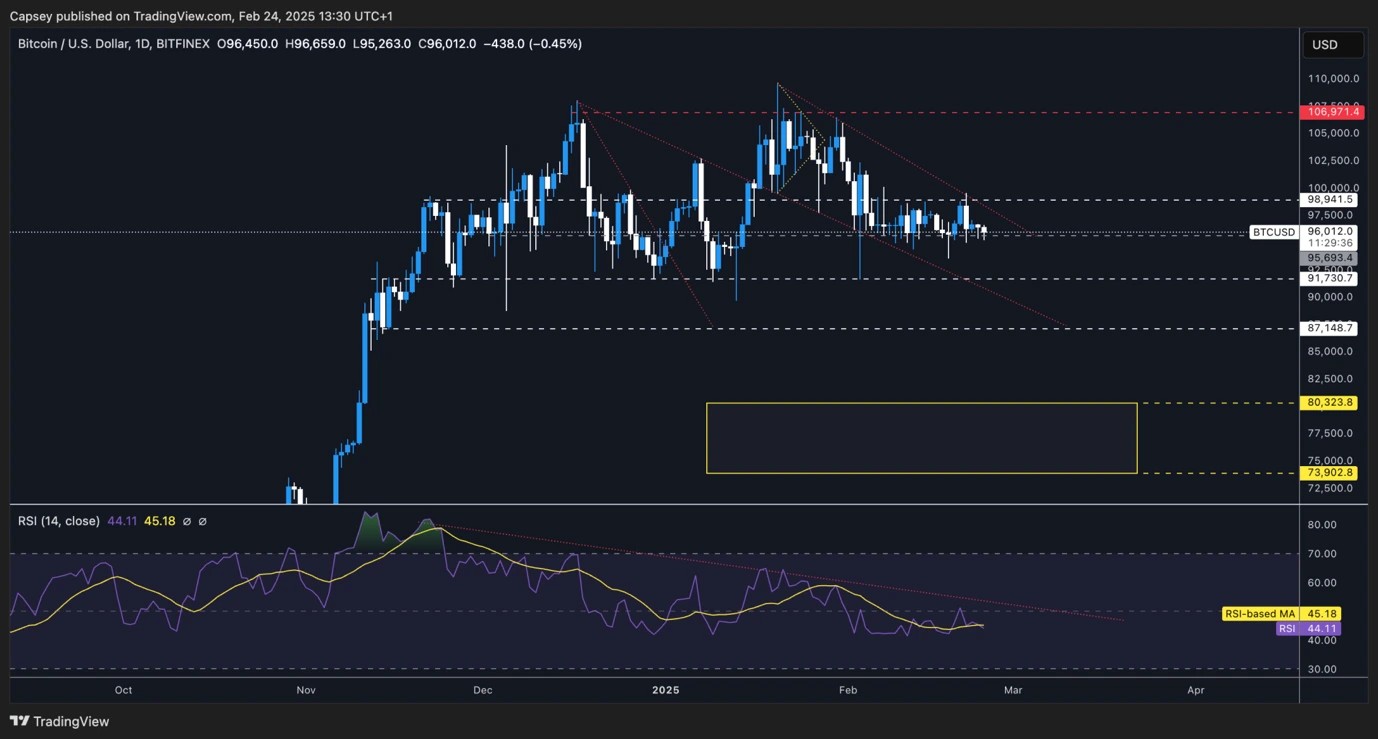
- Amazing really to see that Bitcoin has remained tight in its range.
- Bitcoin is still ranging between the major horizontal resistance of $98,900 and the horizontal support of $95,700.
- On Friday, the price tested the horizontal resistance and the local downtrend line, but the price was rejected and it's now back to the lows of the range. As we expected, the upside is capped.
- The RSI is still in a downtrend but remains in the middle territory and it's battling at its moving average.
- On the downside, if $95,700 breaks, $91,700 is the next level. We expect this level to be tested again at some point in the coming weeks.
- Next Support: $95,600 (then $91,700)
- Next Resistance: $98,900
- Direction: Bearish
- Upside Target: $98,900
- Downside Target: $87,000
Cryptonary's take
Whilst it's possible for Bitcoin that we still get these small pops higher, and granted the range lows have continued to hold, but we do expect them to break. In the coming weeks, we see a more material breakdown coming with $91,700 being the likely target, although the price may extend to the high/late $80k's - $87k to $91k say.We still lack catalysts in the short-term, whilst there are macro headwinds with Trump policies (companies are cautious until they see the effects of the policies). This can potentially set us up for more downside in the coming weeks. And for now, this is what we're expecting and positioning for. If the price retests north of $98k, Shorts can be considered.
ETH:
- ETH's Open Interest has moved up from the lows very slightly, but it still remains well below the highs we saw before the flush out.
- ETH's Funding Rate has fluctuated between positive and negative, indicating that traders have flip-flopped between Longing and Shorting.

Technical analysis
- ETH has bounced from the $2,500 level and it's moved up to the local horizontal resistance of $2,875, where it has (for now) rejected, as we expected it to. $2,875 to $3,050 is the resistance zone. For now, we expect this resistance zone to hold.
- There is local support for ETH at $2,655, with the major support at $2,420.
- We're now also seeing the formation of a local uptrend line (yellow line). A break below this line could propel a larger move to the downside.
- The RSI has broken out of its main downtrend, it's moving higher and is using its moving average as support. This is one of the few elements of the TA.

- Next Support: $2,650 (then $2,420)
- Next Resistance: $2,875
- Direction: Bearish
- Upside Target: $2,875
- Downside Target: $2,420
Cryptonary's take
It's possible we see a positive outcome over the coming weeks, although we still favour the negative outcome (downside). The positive outcome would be price grinding into the main downtrend line and the horizontal resistance of $2,875, and then breaking out to the upside. The negative outcome is just a rejection into this converging resistance zone, and then the price makes new lows, likely at the $2,420 support.SOL:
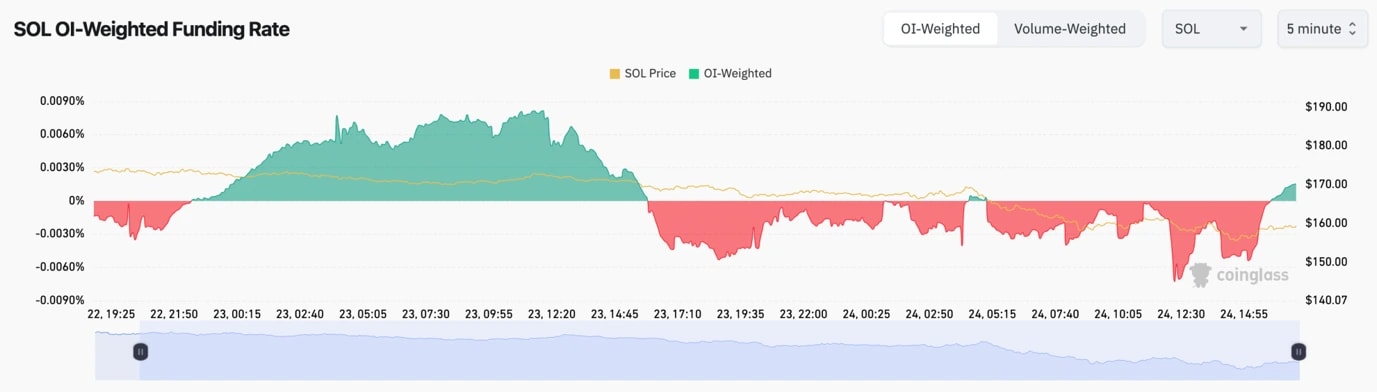
- SOL's funding rate has fluctuated between positive and negative. But mostly it's been negative, suggesting that Shorts have been more dominant.
- SOL's Open Interest is at new highs (measured by a number of coins). However, this is partly due to there still being a lot of interest, and also the price being much lower ie, less $ needed to Long or Short 1 SOL.
- Ultimately, OI is high, and we're seeing traders flip-flop meaning there's a lot of uncertainty around positioning. Not an attractive setup here.
Technical analysis
- SOL has just breached its horizontal support of $162, however, this support does extend to $158, so it's more of a zone of support.
- Price has pulled back substantially and it's now only 10% above the main Yellow Buy/Support box, we outlined 6-8 weeks ago.
- Interestingly, SOL's RSI is very close to being overbought, and it can put in a bullish divergence today (assuming the price closes a new low and the oscillator closes a higher low). This might be what's needed for SOL to get a small relief bounce.
- In terms of horizontal resistance, the low $ 180s is likely to be that level.
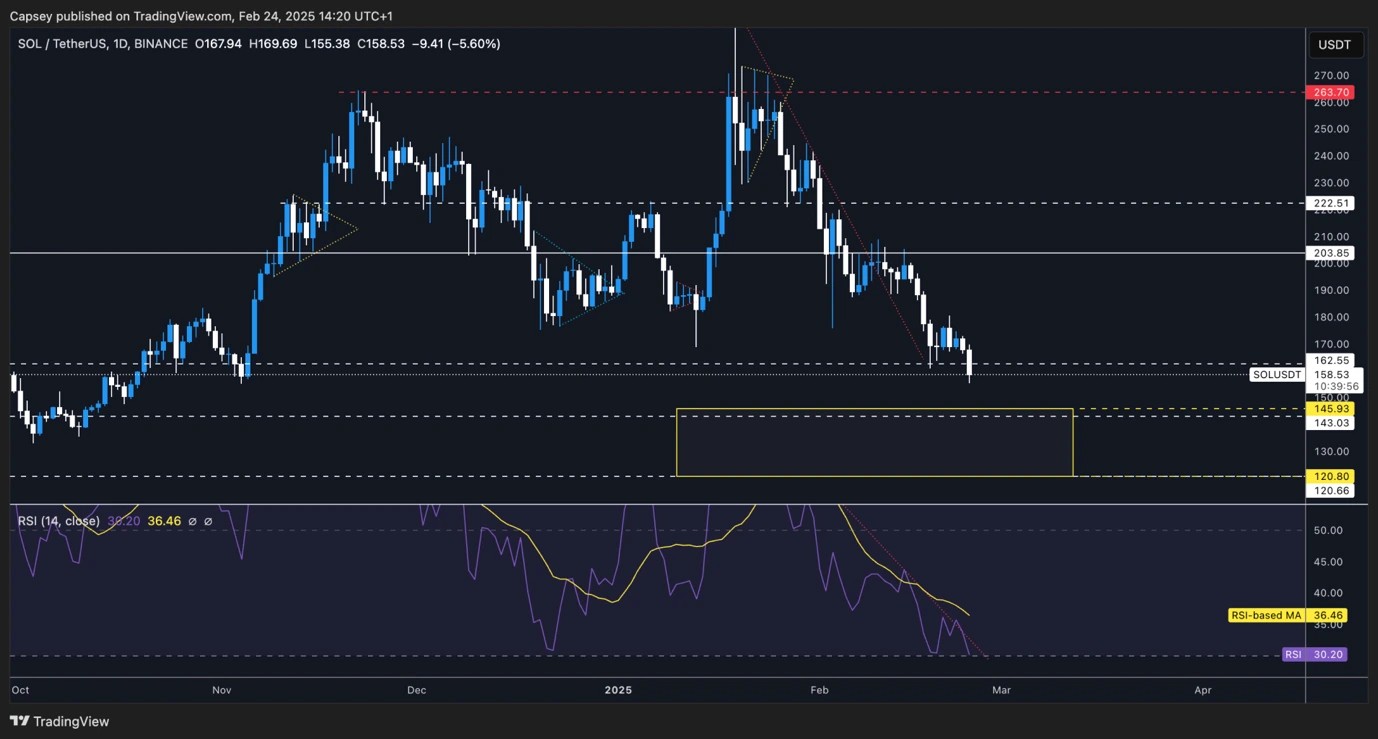
- Next Support: $145 (then $120)
- Next Resistance: $180
- Direction: Neutral/Bearish
- Upside Target: $180
- Downside Target: $120
Cryptonary's take
Overall, it's just not a great chart, even though a potential relief bounce is possible. We're seeing a cleanse in the SOL eco-system, or rather we're on the cusp of a cleanse after meme's crime season ($TRUMP, $MELANIA, $LIBRA etc).In the short term, a relief bounce is possible, we're just not sure we'll play it, as the narrative around SOL right now isn't great. We still expect the Yellow Box to be retested in the upcoming weeks.
HYPE:
- HYPE is starting to look really interesting.
- Price tried a number of times to break out to the upside of the pennant pattern, but unfortunately, it wasn't able to. We've since seen the price turn lower and break below the horizontal level of $23.00.
- Price did break below the local uptrend line, but it has since recovered the trend. However, we need to see how the daily candle closes today.
- We now consider the price in a new range between $20 (horizontal support) and $23 (horizontal resistance).
- Beyond $23, $24.70 is a relatively strong resistance also.
- The RSI was holding tight to its moving average in the middle territory, however, it has since broken down.
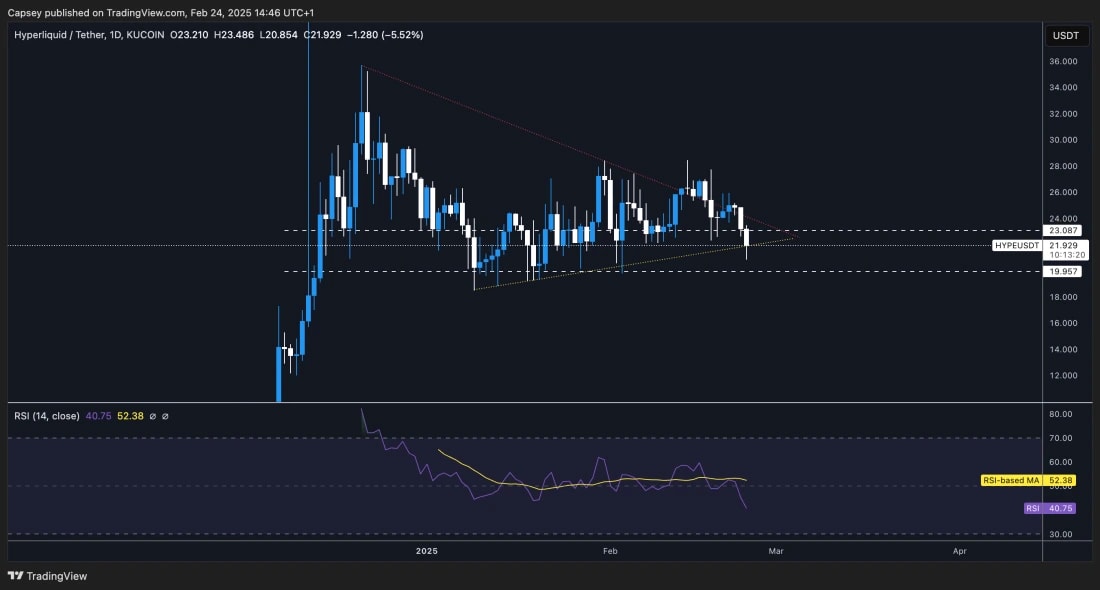
- Next Support: $20.00
- Next Resistance: $23.70
- Direction: Neutral/Bearish
- Upside Target: $23.70
- Downside Target: $16
Cryptonary's take
HYPE is still mostly holding the range, however, we're of the opinion that we'll see further downside in the upcoming weeks for the majors.We think this will impact HYPE, and therefore, it's possible HYPE can fall further from here, and potentially test into the mid-teens in the upcoming weeks. If there is a small move to the upside in the short term, we expect it to top out around $23.70 - $24.00.
Recommended from Cryptonary


