Save 23% ($351) & Get a Free 1-1 Call with our Team ⏰ : 0d 2h 59m 44s
Disclaimer: This analysis is for informational purposes only and not financial advice.
TLDR:
- BTC: Bounced from $112k, OI rising, watch for daily close above $123,100 to target $130k-$134k, support at $116,600.
- ETH: From $3,600 to $4,200; likely retest $4,000 support before push to $4,500, bullish if $4,000 holds.
- SOL: Holding bullish structure, buys at $165-$173 for $203 target if $185 reclaims.
- HYPE: Pullback to $41.70–$44.20 offers buys, break $45.80 opens $50.00 then $70.00.
- AURA: Cup-and-handle intact above $0.148, breakout over $0.245 targets $0.35-$0.40.
BTC:
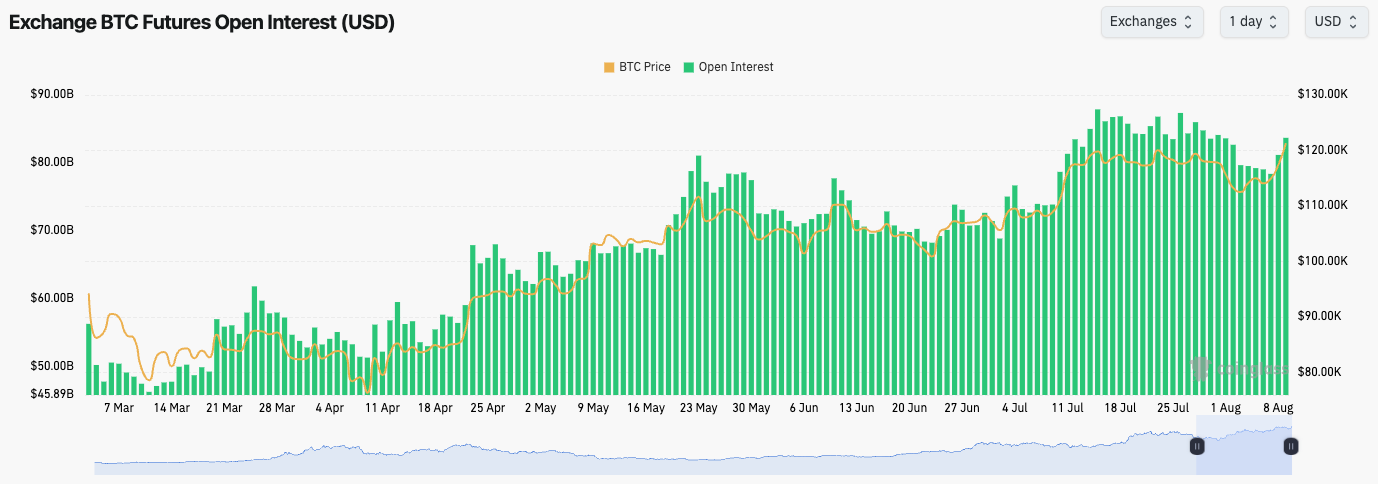
- BTC's Open Interest pulled back on the price pullback; however, in the last few days, as price has bounced from $112k, BTC's Open Interest has increased substantially with it, suggesting that futures have helped drive price higher, alongside a meaningful Spot bid.
- Despite the above, the Funding Rate remains positive but not in frothy territory, which is a positive development considering the move up in OI that we've seen.
Technical analysis
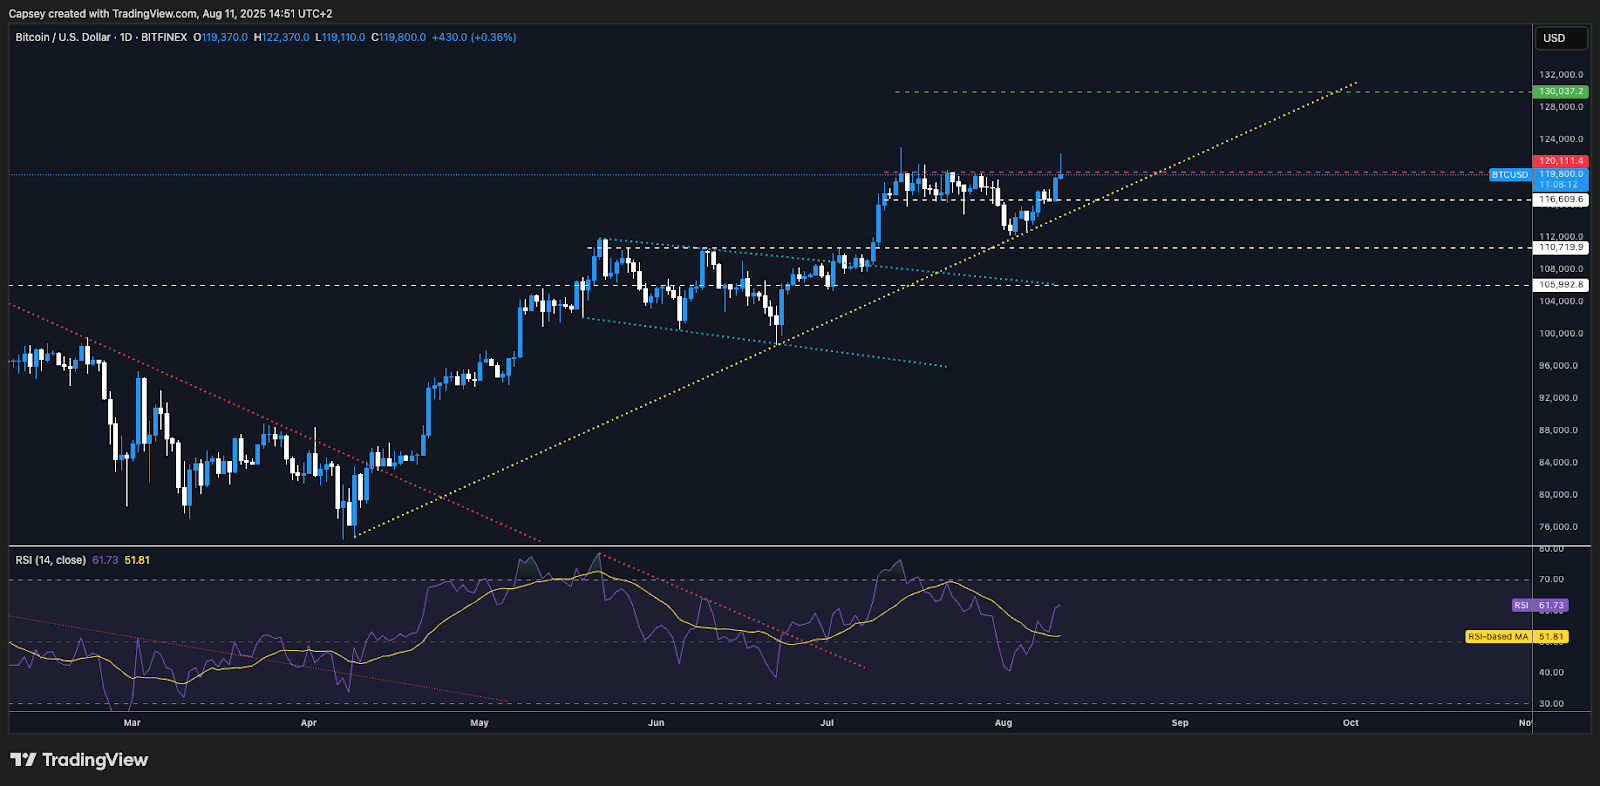
- Price bounced off the $112k horizontal support and the main uptrend line.
- Price was then able to reclaim the horizontal resistance of $116,600, and BTC flipped that resistance into new support over the weekend.
- BTC was then able to break out of the top resistance of $120,100, with price now just shy of all-time highs.
- $116,600 is now the main horizontal support for price, should price fall back below $120,100.
- In terms of further upside resistances, the main level is the all-time high of $123,100.
- The RSI has now risen well above its moving average, but it's still a little way away from entering overbought territory, meaning there is still room for further upside in the short-term.
- What to watch: if BTC can win the battle at the $120,100 horizontal level, that enables the push higher from there.
Cryptonary's take
BTC has reclaimed key horizontal levels with price now just shy of all-time highs. It's possible in the short-term that price pulls back to retest the horizontal level of $120,100; however, it's our expectation that price breaks above its all-time highs in the coming 1-2 weeks (we think this week), and BTC pushes onto $130k-$134k.Should price pull back to $116,600, the bullish structure would remain intact, and we'd look to buy BTC (at $116,600) with a view to a longer-term hold.
- Next Support: $120,100
- Next Resistance: $123,100
- Direction: Bullish
- Upside Target: $130,000
- Downside Target: $116,600
What's next?
ETH and SOL are prepping breakouts: watch ETH's $4,000 retest for bullish validation and SOL's $185 pivot. HYPE and AURA's ranges offer prime entries before the next explosive leg.ETH:
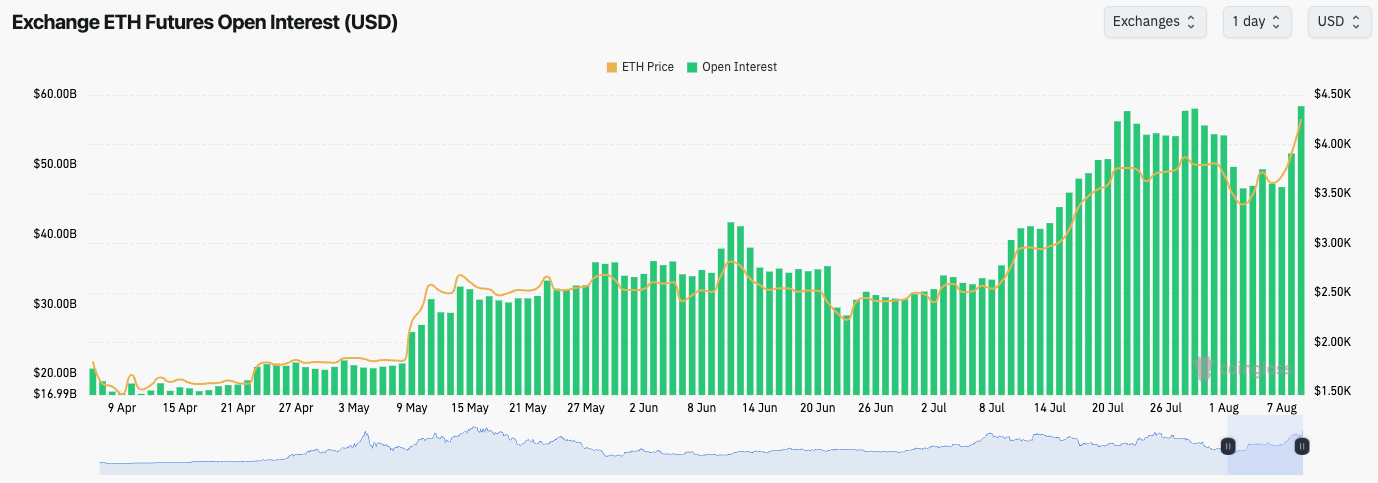
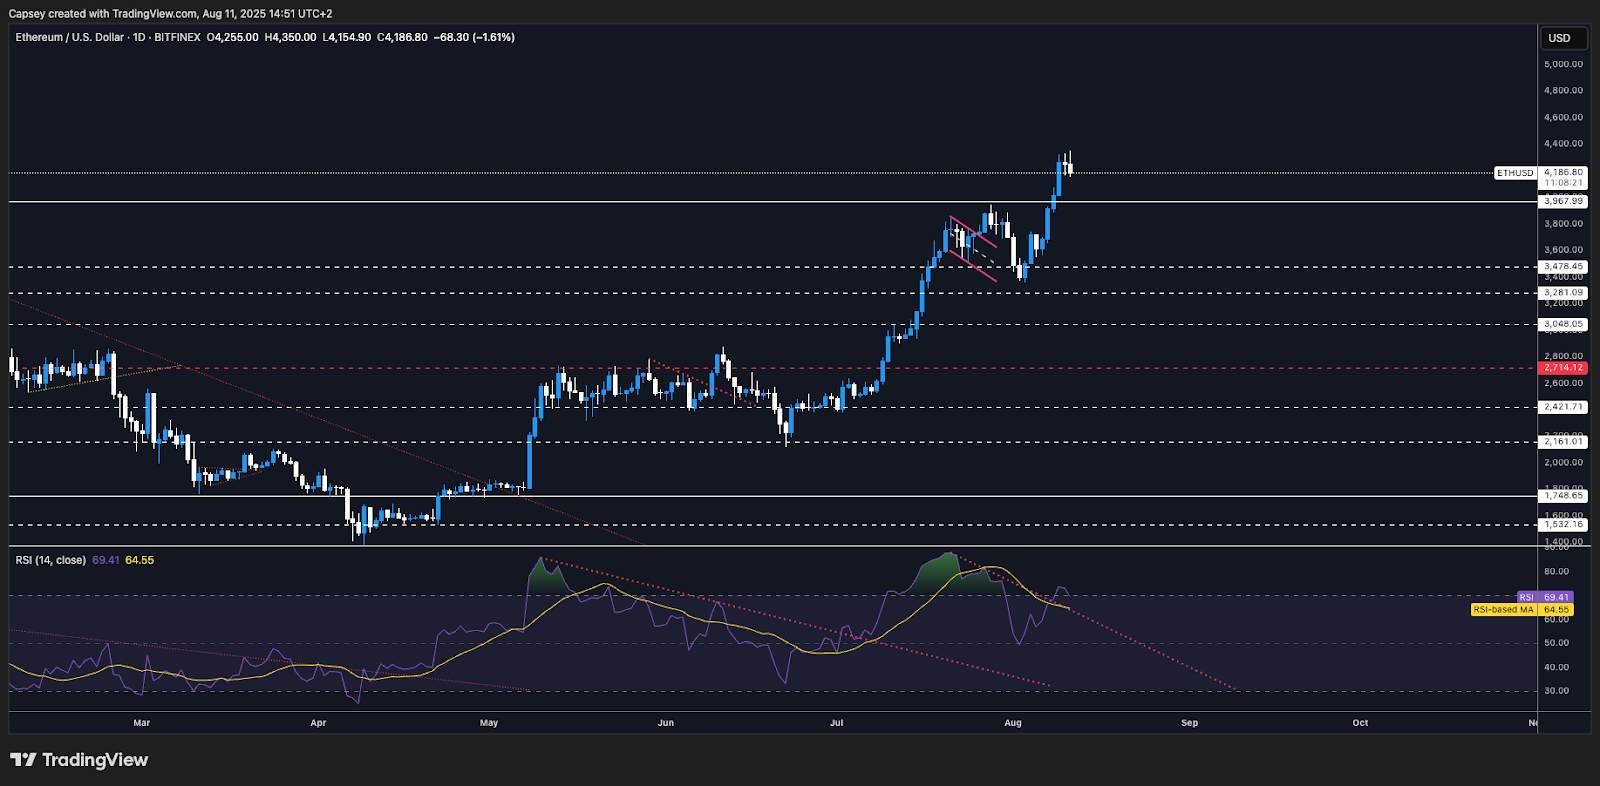
- Like BTC, ETH's Open Interest has popped materially higher over the last 4-5 days, which has resulted in the price moving from $3,600 to $4,200.
- The Funding Rate is at 0.01% meaning that there is a bias amongst traders to be Long, but this Funding Rate isn't at frothy levels, suggesting that there isn't any imminent risk of a leverage shakeout despite the move up in OI.
Technical analysis
- ETH found support between $3,280-$3,480 (our marked area), and the price bounced and broke out of the main horizontal and psychological resistances of $3,970 and $4,000.
- Price is now somewhat in price discovery with the next major horizontal resistance at $4,500.
- Should price pull back, and there's potential for a small, short-term correction for ETH here, then we'd expect $4,000 to become new support.
- In recent days, ETH has had a big move up, and with the price slowing down at $4,200, it's important we now monitor what formation price forms. For instance, a positive formation would be a bull flag, but for now, we need more Daily candles to obtain this information.
- The RSI has now moved back into overbought territory, but only just. Perhaps the main concern is that a bearish divergence (a higher high in price and a lower high on the oscillator) has now formed.
- What to watch: Is it possible we now see ETH consolidate in the short-term? If so, look for it to hold $4,000.
Cryptonary's take
In the short-term, ETH looks likely to see a small pullback here. We'd be looking at the $4,000 level to hold as new support for price, and for price to consolidate for a period over this level. This would then help fuel a healthier move higher that could then breach above $4,500 in the coming weeks.For those who are under-exposed to ETH, the time to get in was back at $2,400 when we were pushing for entries at that level. However, should you be wanting fresh exposure now, $4,000 seems like a good spot to buy ETH, should we see $4,000 be retested.
- Next Support: $4,000
- Next Resistance: $4,500
- Direction: Neutral/Bullish
- Upside Target: $5,000
- Downside Target: $3,780
SOL:
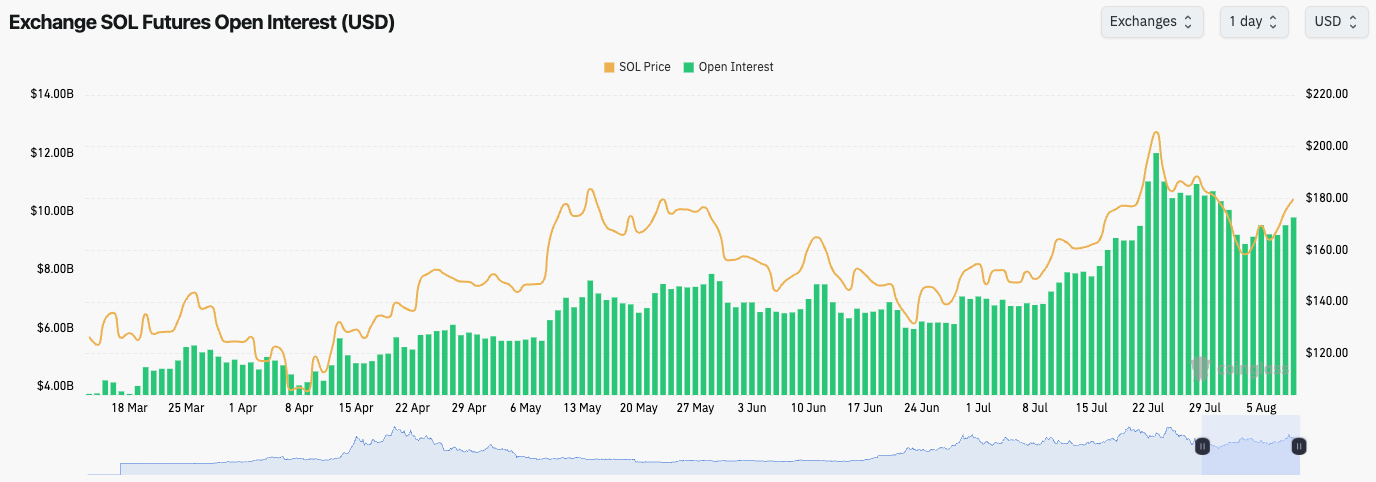
- SOL's Open Interest has remained relatively subdued in comparison to the increases in OI that we've seen from BTC and ETH.
- SOL's Funding Rate has stayed flat at 0.01%.
- The above indicates quite a healthy leverage setup for SOL, and we therefore don't have any concerns from this viewpoint i.e., imminent leverage flush outs don't look likely.
Technical analysis
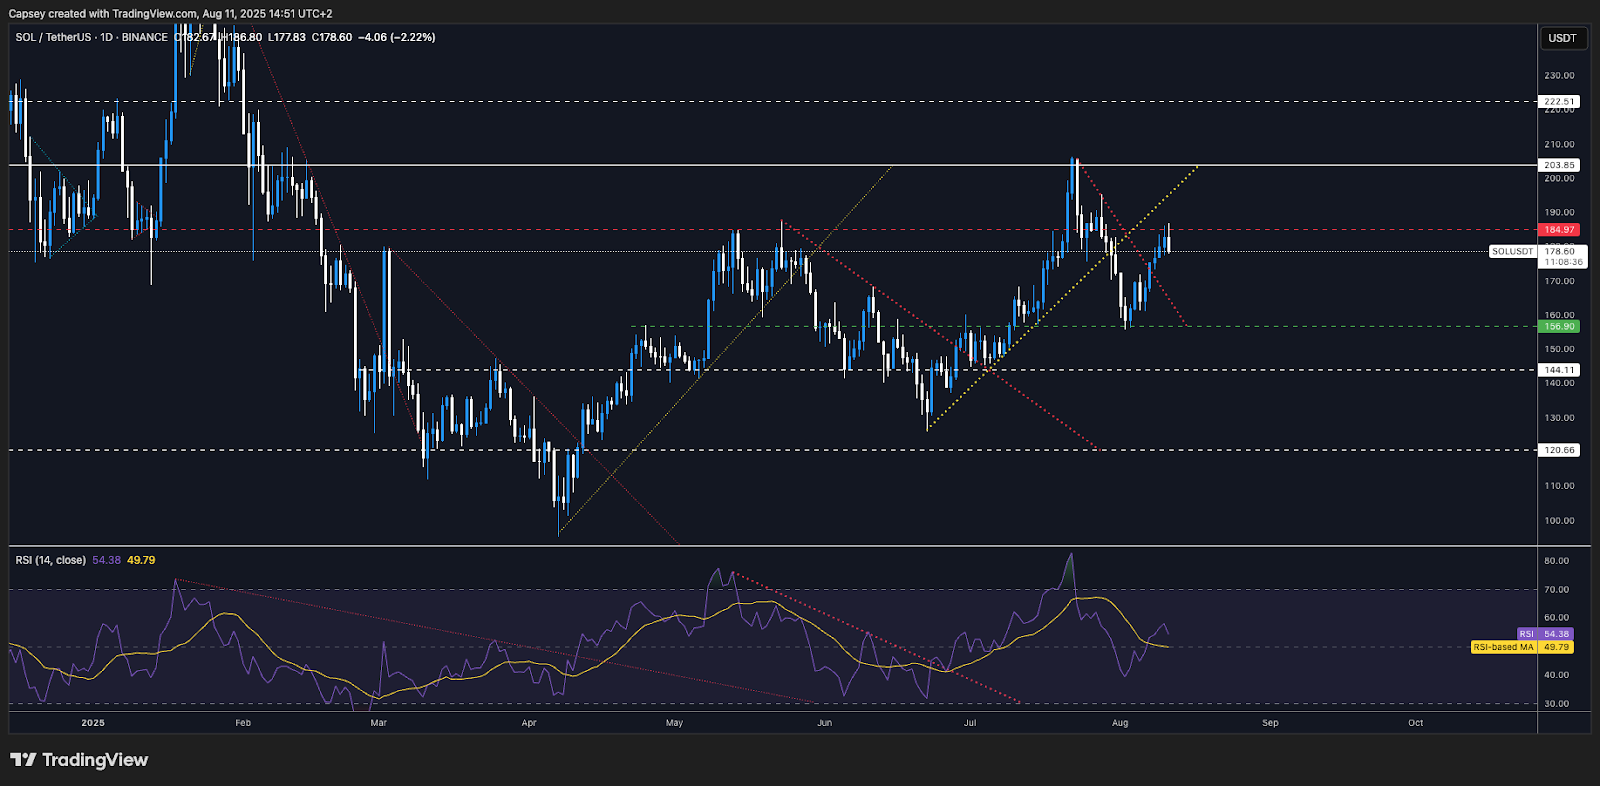
- SOL bounced perfectly from the horizontal support of $156, with the price breaking out of the local downtrend line.
- Price has now run into the horizontal resistance of $185, with price seemingly rejecting from this level in the short-term.
- Again, it is possible that in a small pullback for price, the chart maintains a bullish structure, particularly if we see a bull flag form.
- Should price see a more meaningful move, we'd expect the $165-$173 area to be a zone of price support.
- Should SOL reclaim $185, the next horizontal resistance to the upside would be at $203. SOL really needs to reclaim $203 for a more substantial run to take place.
- The RSI is in middle territory and above its moving average, so despite the move up to $185, there are no signs of any exhaustion with the indicator not being anywhere near overbought levels.
- What to watch: if $185 cannot be reclaimed, we’ll look to take advantage of a pullback to $165-$173 level.
Cryptonary's take
SOL has seemingly hit a short-term resistance here at $185, and it might see a small pullback and a period of consolidation for a few days. Should SOL pullback to $165-$173, we'd consider buys for a trade up to $203. For those looking for longer-term targets, entries between $165-$173, could be sold at $260 in 6-9 month's time.- Next Support: $165-$173
- Next Resistance: $185
- Direction: Neutral
- Upside Target: $203
- Downside Target: $165
HYPE:
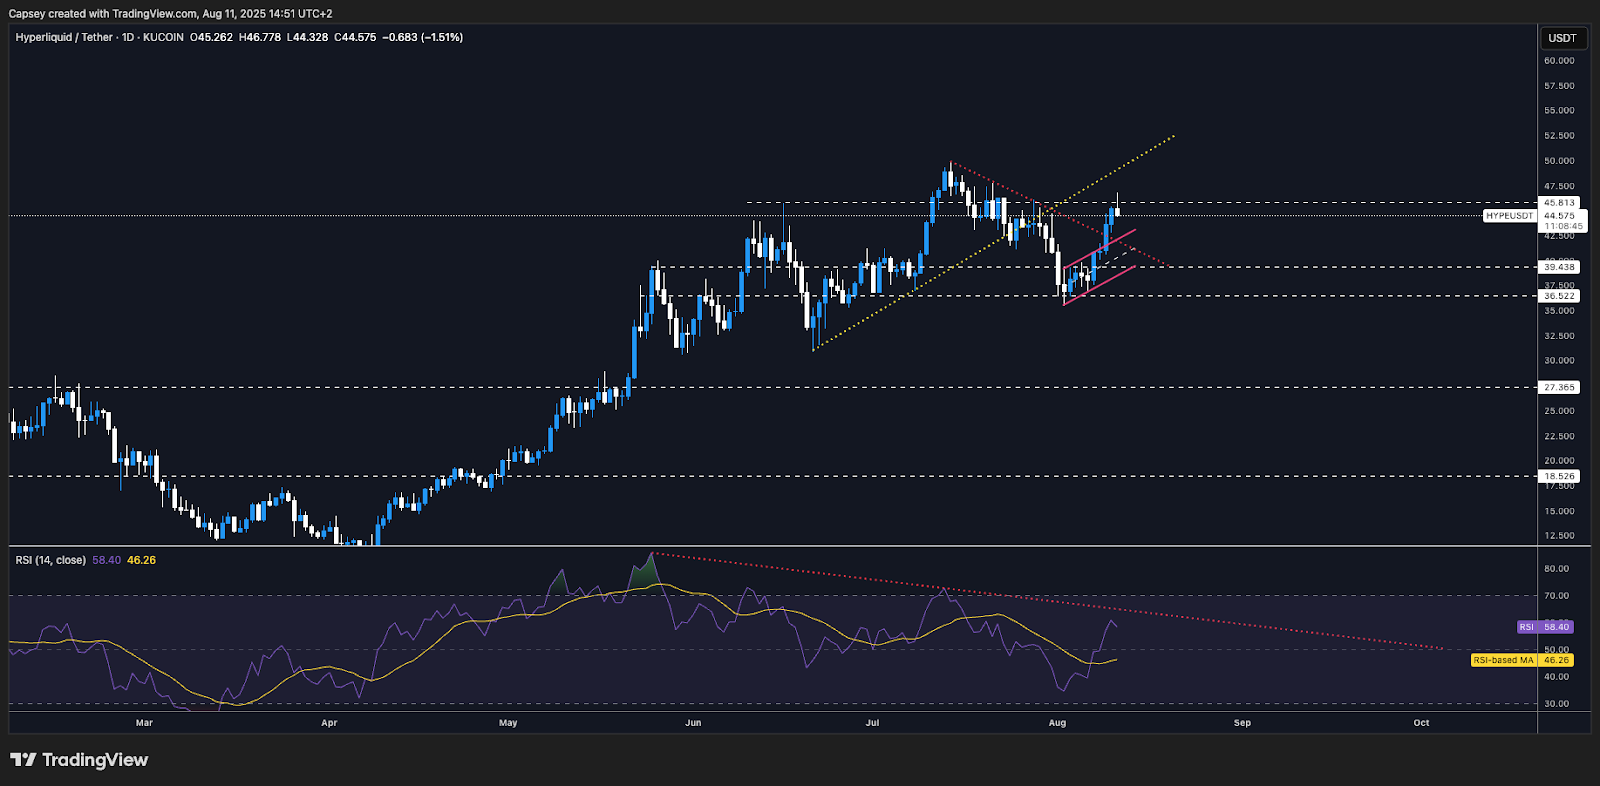
- SOL formed a bear flag, but the price broke out of the top border, which invalidated the flag, with the price then moving higher to reclaim significant horizontal levels.
- Once price was able to comfortably move above $39.40, there was enough momentum for price to break out of its downtrend line, and for price to push on to the major horizontal resistance of $45.80.
- Price has now run into the key horizontal resistance of $45.80, and price has seemingly rejected from that level.
- Should price pull back from here, we'd expect there to be a support zone between $41.70-$44.20. This is a region we'd suggest bidding in, should your exposure to HYPE be low.
- Should the price break out of $45.80, the next major horizontal resistance is at $50.00.
- The RSI is in middle territory, and it remains in a longer-term downtrend. Should this indicator see a breakout to the upside, that might then be the bullish impulse for price that gets HYPE well north of $50.00, although this may take more weeks.
- What to watch: HYPE is currently contesting at a key horizontal level of $45.80
Cryptonary's take
HYPE has lagged in recent weeks as we've seen other Majors perform (ETH in particular). However, HYPE has run higher over the last few days, having put in a bottom between $36.50-$39.40. For those who are still not exposed or are underexposed, we'd suggest adding HYPE between $41.70-$44.20.In the short-term, we expect price to have a small pullback but for price to eventually breakout of $45.80 and then $50.00 and push on to $70.00.
- Next Support: $41.70-$44.20
- Next Resistance: $45.80
- Direction: Neutral/Bullish
- Upside Target: $50.00
- Downside Target: $39.40
AURA:
- AURA bounced nicely off the $0.148 horizontal support, which then allowed the price to break out of the downtrend line.
- Price has since moved higher, and it has battled between $0.17-$0.19.
- Price has now pulled back towards the bottom of this range at $0.170.
- Should the price breakout of $0.19, the next level to the upside is at $0.214, and then $0.245.
- The 'Cup-and-Handle' pattern is still intact, but it takes time to play out. A breakdown below $0.148 would invalidate the 'Cup-and-Handle' pattern, and the price would be back to just being range-bound between $0.116 and $0.245.
- We expect the price to eventually reclaim $0.214, and breakout of $0.245, and push on to the 'Cup-and-Handle' breakout target of $0.35-$0.40.
- The RSI remains in middle territory as it sits on top of its moving average. This is likely a good support area for the price here.
- What to watch: in which direction does AURA breakout of its tight range of $0.17-$0.19.
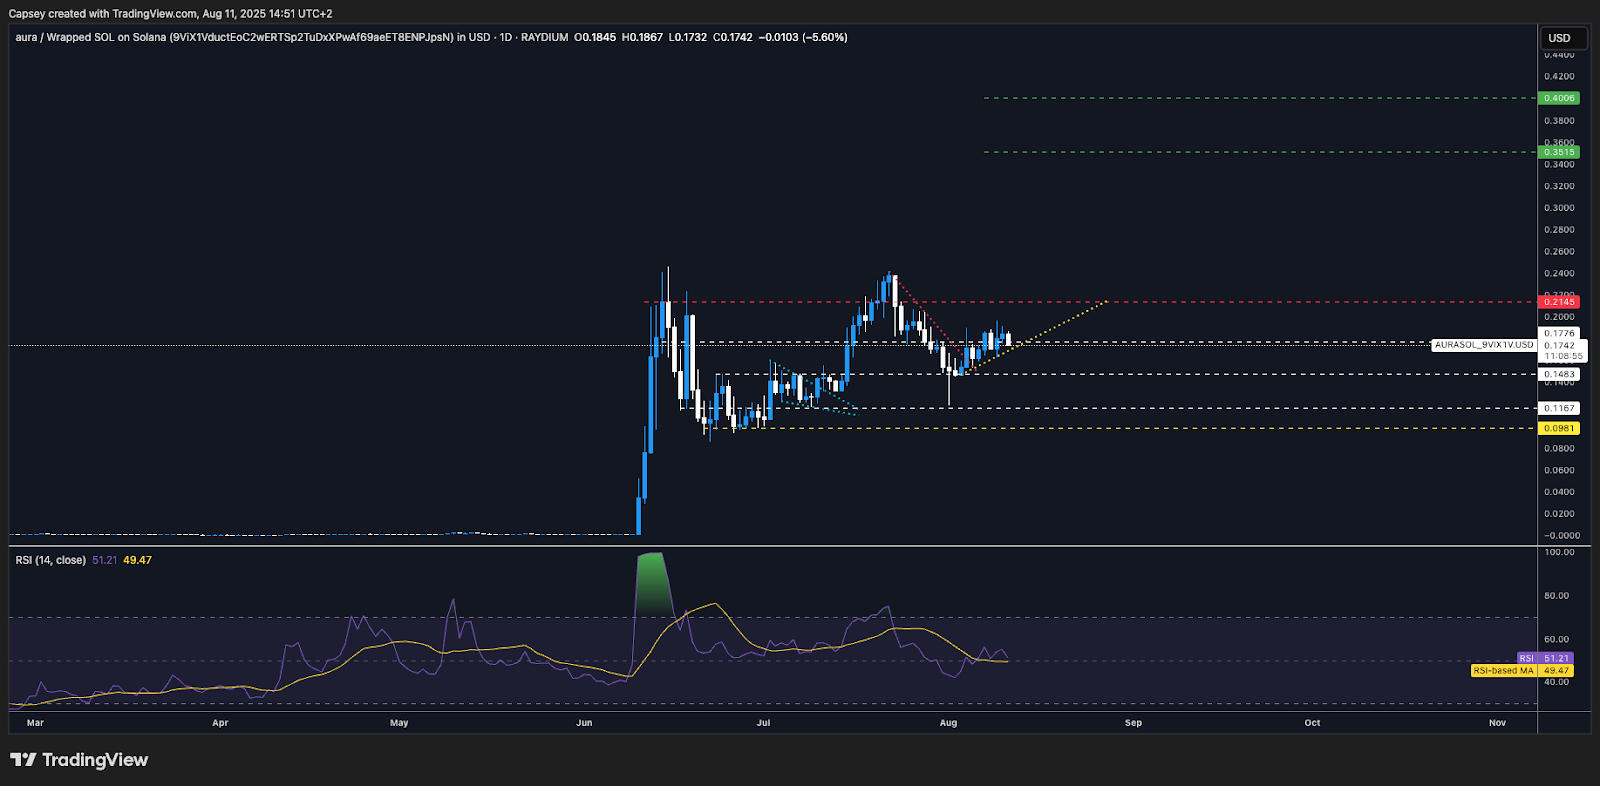
Cryptonary's take
The 'Cup-and-Handle' pattern remains intact, with price slowly grinding higher, and currently battling between the tight range of $0.17-$0.19. Our base case is that price remains above $0.148, and it eventually reclaims $0.215, which then enables a breakout of $0.245, that would then make the 'Cup-and-Handle' breakout target ($0.35-$0.40) achievable.We remain convicted in our hold of AURA, and we'd look to re-add to our positions should price breakdown from the local uptrend line and retest the horizontal support at $0.148.
- Next Support: $0.148
- Next Resistance: $0.215
- Direction: Neutral/Bullish
- Upside Target: $0.35
- Downside Target: $0.116
Closing thoughts
In short, we're bullish, but we're also aware that we're likely going to see volatility in both directions over the coming weeks, so be prepared for that. Keep leverage low, and look to pick up Spot positions on dips/pullbacks.Tomorrow we'll be doing a Market Pulse on the release of the Inflation data (1:30PM UK time), which will then be followed by a Market Update on Wednesday.
We maintain our bullishness - don't be shaken out!
Let's Go!!!
Recommended from Cryptonary


