Log in

Home
Research
Analysis
Community
  1. Cryptonary
  2. Market Analysis
  3. BTC, ETH, and More: Breakouts, Pullbacks, and Critical Resistance Zones
Market Direction

BTC, ETH, and More: Breakouts, Pullbacks, and Critical Resistance Zones

Updated: Sep 2, 2025
Published: Aug 27, 2025
0
Share:

Market finds pivotal support and resistance levels. BTC, ETH, and other Cryptonary picks face breakout or rejection conditions. Key buy zones align with short- and long-term risk-taking opportunities.

Post Feature Image

Disclaimer: This analysis is for informational purposes only and not financial advice.


TLDR:

  • BTC: Holding $108k–$112k support; dip-buy zone with targets $116.6k–$120k.
  • ETH: Range-bound $3,970–$5,000; buyers below $4,340, upside to $5,500.
  • SOL: Pressing $203 resistance; breakout could reach $222, support $176–$185.
  • HYPE: New highs; holding $48.8–$50, breakout over $50 targets $60.
  • AURA: Strong support $0.116–$0.120; eyeing breakout to $0.177–$0.186.

BTC:

  • BTC's Open Interest spiked back towards its highs last Friday following Powell's dovish tilt at Jackson Hole, but OI has since pulled back as price action has been lacklustre.
  • The Funding Rate has remained flat at 0.01% indicating a healthy appetite amongst traders to be Long, but not to overly frothy levels.
BTC's Open Interest (by USD value):

https://cryptonary.s3.eu-west-2.amazonaws.com/wp-content/uploads/2025/08/unnamed-216.png

Technical analysis

  • BTC bounced from the $112k level following a dovish tilt from Powell at Jackson Hole, which saw price retest the main horizontal resistance of $116,600 and the underside of the main uptrend line.
  • Price rejected from the converging resistance area and price has since pulled back to the major support zone of $110k-$112k.
  • The Short-Term Holder Cost Basis is at $108k, and whilst it's possible that price falls below that level, this level has historically been a good buying opportunity in bull markets.
  • For BTC the support zone is between $108k-$112k, although we'd be aggressive buyers down to $105k, with a view to holding for the long-term.
  • Should price bounce, and we expect it will after a week or two of consolidation between $108k-$115k, then $116,600 and $120,100, are the key resistance levels for price to reclaim.
  • The RSI has meaningfully reset, although it's below its moving average and still some way away from being oversold.
https://cryptonary.s3.eu-west-2.amazonaws.com/wp-content/uploads/2025/08/unnamed-217.png

Cryptonary's take

Bitcoin has pulled back to our support zone between $108k-$112k. We're buyers at this level, and we'll intensify our buys should BTC fall below $108k, down to $105k. Our expectation is that BTC is in a weak seasonal period where we could see price consolidate for several weeks before price recovers and begins to move higher again. It's still our view that this is just a bull market pull back, and therefore our approach remains the same; we're dip buyers.
  • Next Support: $108,000
  • Next Resistance: $112,000
  • Direction: Neutral
  • Upside Target: $120,100
  • Downside Target: $105,000


ETH:

  • ETH's Open Interest has pulled back in recent days, whilst there was a substantial Spot bid, this has now begun to decrease.
  • The Funding Rate has also begun decreasing alongside this, pulling back to flat (0.00%).
  • This suggests some cooling from very overheated levels in ETH's leverage market. This is likely a healthy reset.
ETH's Open Interest (by USD value):

https://cryptonary.s3.eu-west-2.amazonaws.com/wp-content/uploads/2025/08/unnamed-218.png

Technical analysis

  • ETH moved up into the horizontal resistance at $4,770 following Powell's dovish pivot last Friday at Jackson Hole, although price rejected into that level over the weekend.
  • Price has pulled back and initially found support at a local level of $4,340, whilst the more major levels below lie at $3,970 and $4,000 (psychological level).
  • We would be buyers of ETH should it fall below $4,340, down to $3,970.
  • To the upside, the horizontal resistances are at $4,770 and then $5,000, with $5,500 the next level should price break out.
  • The RSI is in middle territory; however, one concern is the back-to-back bearish divergences which we have noted on the chart. This is the higher highs in price and the lower highs on the oscillator.
https://cryptonary.s3.eu-west-2.amazonaws.com/wp-content/uploads/2025/08/unnamed-219.png

Cryptonary's take

ETH rejected from the all-time highs, and price is now likely to remain range-bound for some time, unless Treasury company buys step up, and in, in a significant way. We expect ETH to be range-bound between $3,970 and $5,000. The reason being is that ETH was getting overheated, and we could see this from the back-to-back bearish divergences, which now may need some time to reset. Should ETH pull back to $3,970-$4,340, we'd be buyers of ETH at this level, with a view to ETH eventually breaking out of $5,000 and pushing on to $5,500. So, this would be a buy of $3,970-$4,340, with a view to selling into $5,500 over the medium to long-term.
  • Next Support: $4,340 (then $3,970)
  • Next Resistance: $4,770
  • Direction: Neutral
  • Upside Target: $5,500
  • Downside Target: $3,970


SOL:

  • SOL's Open Interest pulled back from the highs during the weekend, but they have since re-approached the highs.
  • The Funding Rate is positive, but it remains below 0.01%. This is a healthy leverage setup for SOL, and price can continue higher with this backdrop.
SOL's Open Interest (by USD value):

https://cryptonary.s3.eu-west-2.amazonaws.com/wp-content/uploads/2025/08/unnamed-220.png

Technical analysis

  • SOL initially rejected into the key horizontal resistance of $203 over the weekend, pulling back to the $185 local horizontal support.
  • Price has since bounced and it is squeezing into the $203 horizontal resistance again.
  • Should SOL break out (we're expecting it to), then the major horizontal resistances above price are at $222 and then $260.
  • Should price reject and pull back, then $185 is a key support, followed by $176.
  • The RSI has reset and it's in middle territory without any major bearish divergences. This suggests that there's room for upside.
https://cryptonary.s3.eu-west-2.amazonaws.com/wp-content/uploads/2025/08/unnamed-221.png

Cryptonary's take

SOL has consolidated towards the top of its range with price mostly being range-bound between $176 and $203. This has given price a strong base and chart structure to lodge a breakout of $203 and potentially push on to $222 in the short-term. This may also give more momentum to the rest of the SOL eco-system, potentially benefitting SOL memes. Should price now break out of $203 here (although not our base case), then we'd be buyers of SOL should it re-visit $176. However, we do see this as unlikely. So, for now, we will continue to hold our Spot bags and anticipate a breakout to $222.
  • Next Support: $185
  • Next Resistance: $203 (then $222)
  • Direction: Bullish
  • Upside Target: $222
  • Downside Target: $176


HYPE:

  • Price pulled back from one of key horizontal resistances of $45.80, with price finding support and bouncing from $40.00.
  • Price has now cleared above $45.80, and price has put in a new all-time high, although price is pulling back to $48.80-$50.00 which is a key horizontal level that price needs to now flip into a support zone.
  • Should the price convincingly break out of $50.00, then $60.00 is likely next, although this may take some weeks.
  • Below $48.80, we expect this zone between $45.80 to $48.80 to also now be a strong support zone. Should price retest the bottom of this zone at $45.80, we'd be buyers of HYPE with a view to holding for the long-term.
  • Should the price breakdown more materially, then once again $39.40-$40.00 should act as support for price, although we're not expecting this level to be retested.
  • The RSI is in middle territory and above its moving average, whilst it's also squeezing up into its downtrend line which has been intact since late May. Should the RSI breakout of the downtrend line, we'd expect a big move higher for price, potentially making $60.00 achievable sooner.
HYPE's Open Interest (by USD value):

https://cryptonary.s3.eu-west-2.amazonaws.com/wp-content/uploads/2025/08/unnamed-222.png

Technical analysis

  • HYPE has broken out to new all-time highs with price now using $48.80-$50.00 as a support. Should HYP hold this support level, and we see price move higher, that'll likely result in an RSI downtrend line break out which would likely give fuel for price to break out to $60.00 in the short-term (next few weeks).
  • We continue to hold HYPE as we look for a clean and convincing break out of $50.00 that could take price swiftly onto $60.00. However, should price break down (this isn't our base case), then we'd be buyers of HYPE at $45.80.

Cryptonary's take

We continue to hold HYPE as we look for a clean and convincing break out of $50.00 that could take price swiftly onto $60.00. However, should price break down (this isn't our base case), then we'd be buyers of HYPE at $45.80.
  • Next Support: $45.80
  • Next Resistance: $50.00
  • Direction: Bullish
  • Upside Target: $60.00
  • Downside Target: $45.80


AURA:

  • AURA reclaimed the horizontal level of $0.145 and pushed into the downtrend line, however price rejected into that resistance area, and price pulled back.
  • The $0.116-$0.120 level has continued to be a strong level of support that we expect to remain intact and support price.
  • Price is now squeezing back into $0.145, whilst it's also squeezing into its downtrend line. A breakout of this level would likely send price back to the horizontal resistance zone of $0.177-$0.186.
  • Should price reclaim $0.177-$0.186, then the next resistances above price are $0.215 and $0.245. A breakout of the all-time high would likely send price into the $0.30's.
  • The RSI has meaningfully reset and it's back to middle territory, whilst it's also climbed above its moving average. This leaves plenty of room for upside to be had.
AURA's Open Interest (by USD value):

https://cryptonary.s3.eu-west-2.amazonaws.com/wp-content/uploads/2025/08/unnamed-223.png

Technical analysis

  • AURA has continued to find strong support between $0.116-$0.120 with price now bouncing back towards the horizontal level of $0.145 as price also squeezes into the downtrend line. A breakout of this level would be substantial and likely send price to the resistance zone of $0.177-$0.186. We're expecting this in the short-term.
  • We're therefore holding Spot positions, in anticipation of a breakout to $0.177-$0.186 in the short-term. An invalidation would be a breakdown of the support zone of $0.116-$0.120.

Cryptonary's take

AURA has continued to find strong support between $0.116-$0.120 with price now bouncing back towards the horizontal level of $0.145 as price also squeezes into the downtrend line. A breakout of this level would be substantial and likely send price to the resistance zone of $0.177-$0.186. We're expecting this in the short-term. We're therefore holding Spot positions, in anticipation of a breakout to $0.177-$0.186 in the short-term. An invalidation would be a breakdown of the support zone of $0.177-$0.186.
  • Next Support: $0.120
  • Next Resistance: $0.177-$0.186
  • Direction: Bullish
  • Upside Target: $0.215
  • Downside Target: $0.116


Closing Thoughts:

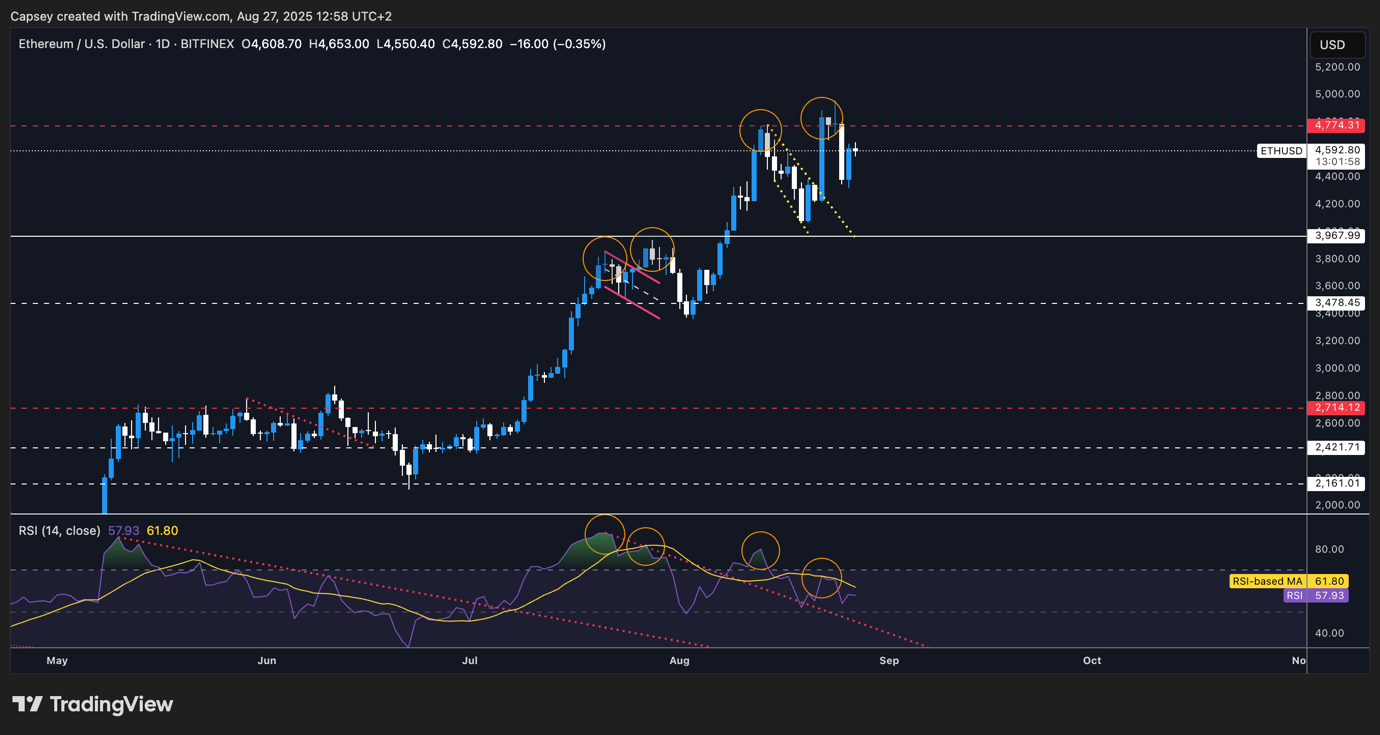
We've seen prices pull back but most plays have pulled back to their buy zones, or just above, so we're maintaining a proactive stance and looking to accumulate coins into their buy/support zones that we've mentioned above.

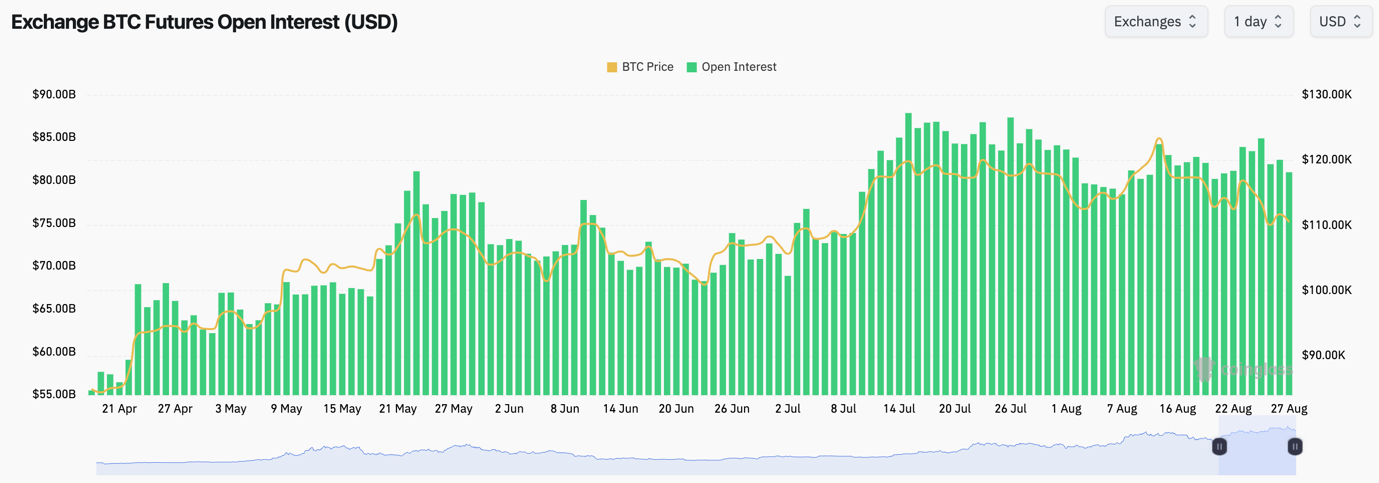
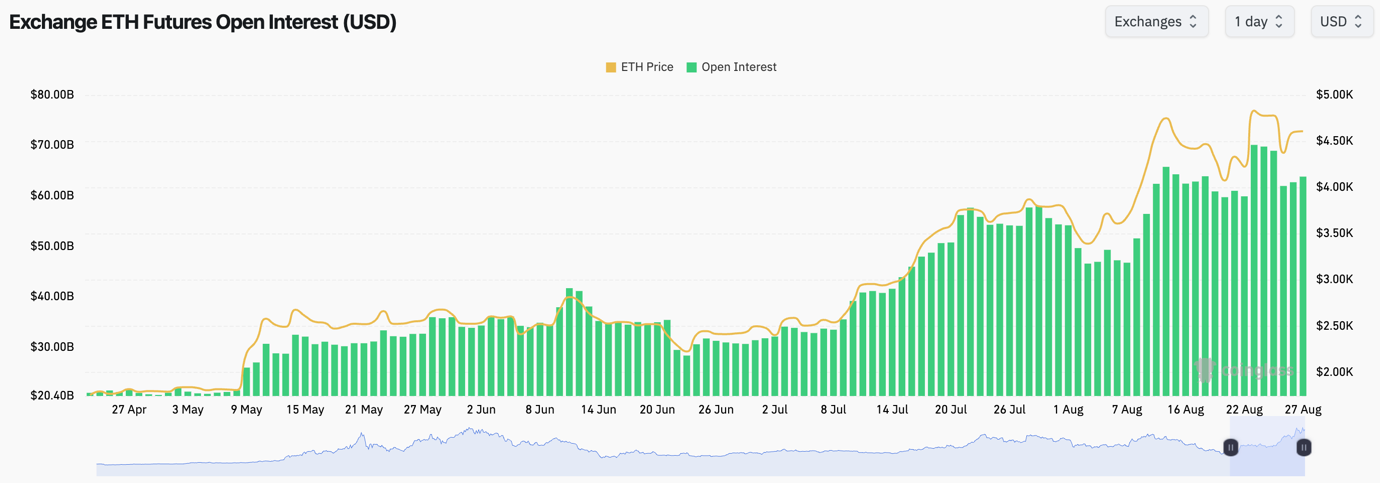
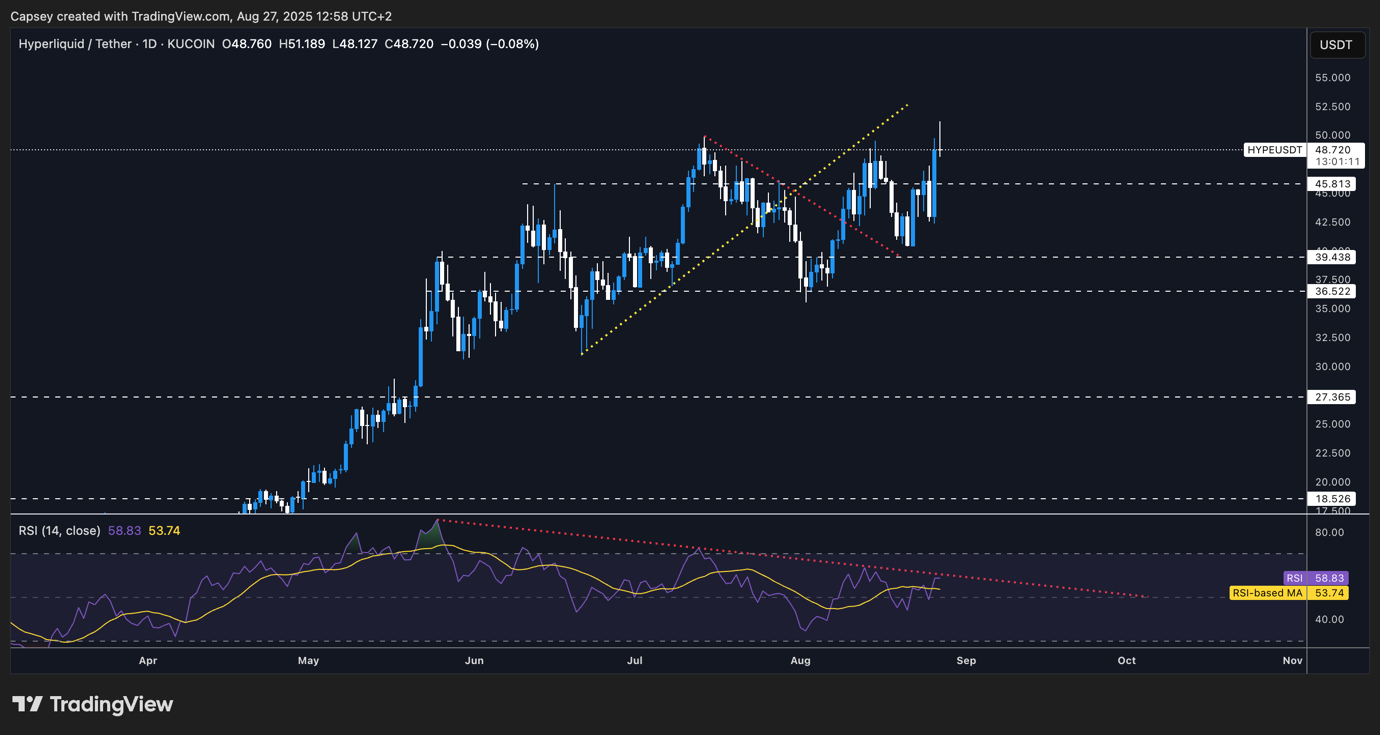
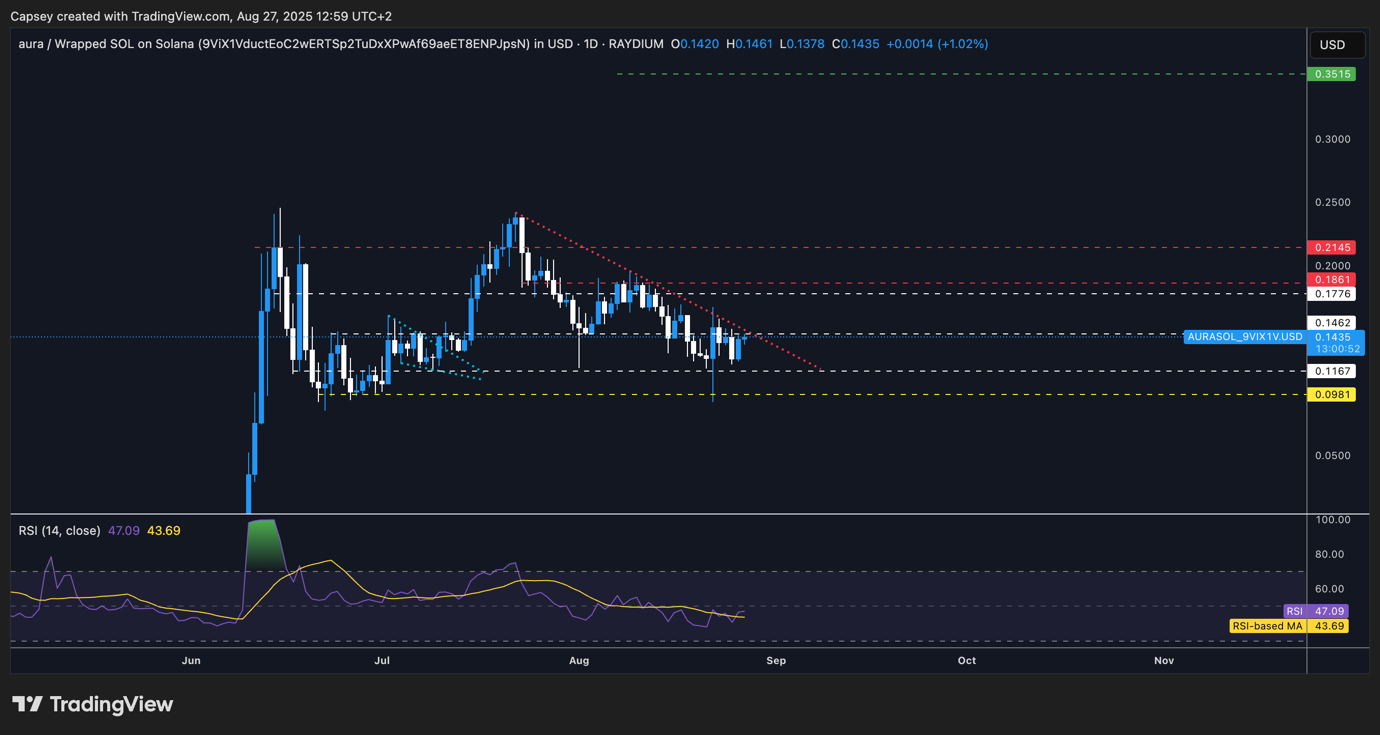
BTC seems to be in a consolidation period, potentially even ETH looks to start to be doing the same here also. But, that has given way to others (HYPE and SOL) to start moving, which we believe we've begun to see.

PS - Nvidia Earnings out today. I will cover this in a Market Pulse later. Expectation is for good Earnings and positive guidance. This would help the market and risk assets to continue remaining buoyant.

LETS GO!!!


Get started for free

Create your free account or log in to read the full article.

​

Germany

By signing up, you agree to our Terms & Conditions
Recommended from Cryptonary
BTC, ETH and More: Bitcoin and Ethereum Tap Key Supports
PRO
Market Direction
BTC, ETH and More: Bitcoin and Ethe...A lot has happened in a short amount of time. Downside liquidity has been swept across majors, and w...
13 min read
Jan 30, 2026
BTC, ETH, SOL and More: Majors Under Key Resistance
PRO
Market Direction
BTC, ETH, SOL and More: Majors Unde...All majors are trading under their lost key support levels, downside liquidity is open for BTC and m...
12 min read
Jan 23, 2026
BTC, ETH and More: Crypto Majors Break Key Supports
PRO
Market Direction
BTC, ETH and More: Crypto Majors Br...Here’s where we are: last week’s breakout attempts failed, downside liquidity got tagged, and now we...
14 min read
Jan 20, 2026
BTC, ETH and More: Relief Rally Stalls, Downside Risks Emerge
PRO
Market Direction
BTC, ETH and More: Relief Rally Sta...Last week’s relief rally played out with precision across majors, but the follow-through never came....
10 min read
Feb 10, 2026
BTC, ETH and More: Downside Targets Hit, All Eyes on the Recovery
PRO
Market Direction
BTC, ETH and More: Downside Targets...Bitcoin flushed into the Monthly OB at $65,650 before bouncing back, while Ethereum and Solana both ...
14 min read
Feb 6, 2026
BTC, ETH and More: Markets Flush to Major Lows
PRO
Market Direction
BTC, ETH and More: Markets Flush to...Markets just snapped lower after BTC lost $80.5K and flushed into the $74K liquidity zone. Now we’re...
13 min read
Feb 3, 2026
BTC, ETH and More: Bitcoin and Ethereum Tap Key Supports
PRO
Market Direction
BTC, ETH and More: Bitcoin and Ethe...A lot has happened in a short amount of time. Downside liquidity has been swept across majors, and w...
13 min read
Jan 30, 2026
BTC, ETH, SOL and More: Majors Under Key Resistance
PRO
Market Direction
BTC, ETH, SOL and More: Majors Unde...All majors are trading under their lost key support levels, downside liquidity is open for BTC and m...
12 min read
Jan 23, 2026
BTC, ETH and More: Crypto Majors Break Key Supports
PRO
Market Direction
BTC, ETH and More: Crypto Majors Br...Here’s where we are: last week’s breakout attempts failed, downside liquidity got tagged, and now we...
14 min read
Jan 20, 2026
Research
Top PicksDeep DivesPassive IncomeAirdrop Reports
Analysis
Market UpdatesMarket DirectionMarket PulseLivestreams
Tools
Market DirectionAssets & PicksAirdropsPortfolio Tracker
Cryptonary
Affiliate programEducationPrivacy PolicyTerms & ConditionsContact UsWrite for usTeam
Stay connected
Disclaimer: The information provided on this website is for educational and informational purposes only and does not constitute financial, investment, legal, or tax advice. Cryptonary is not a licensed financial advisor. All content is shared without any guarantee of accuracy or completeness. You are solely responsible for your investment decisions. Always do your own research and consult with a licensed professional before making financial choices. Past performance is not indicative of future results.

×
popupimage
Our Latest Utility Token Research ReportPreviously locked for Pro members, now available to read in full.
  • tickThe utility token we're tracking closely
  • tickWhy we believe it's still early in the cycle
  • tickWhat we're watching to confirm a structural shift
​
Germany

No spam. No hype. Just the research.