Save 23% ($351) & Get a Free 1-1 Call with our Team ⏰ : 0d 2h 59m 43s
Disclaimer: This analysis is for informational purposes only and not financial advice.
TLDR:
- BTC: Large sell pressure from Galaxy, but structure remains bullish; likely to range between $112k–$120k short-term.
- ETH: Healthy consolidation after strong rally; holding bullish flag with upside potential to $4,500.
- SOL: Lost key support at $185; likely range-bound between $165–$185 unless $185 is reclaimed.
- HYPE: Holding support in $39–$44 zone; showing relative strength despite market pullback.
- AURA: Bullish Cup-and-Handle forming; upside target $0.35–$0.40 as sell pressure fades.
BTC:
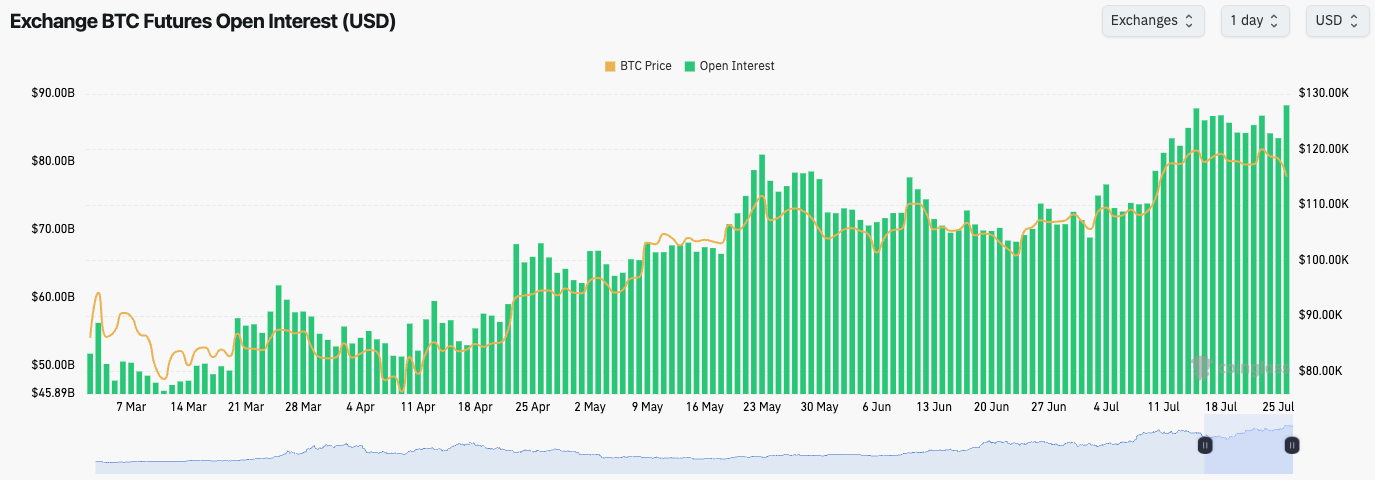
- BTC's Open Interest has kicked up substantially, with Funding Rates at elevated levels (0.016%).
- What's also notable is that the Bid/Ask Delta is majorly positive (currently). This suggests that dip buyers are stepping in as the price comes down.
- This is an interesting setup here. We have large BTC sellers (the 80k BTC from Galaxy), being sold into an orderbook that wants to buy the dip. However, the dip buyers are mostly leverage rather than Spot at the current moment.
Technical analysis
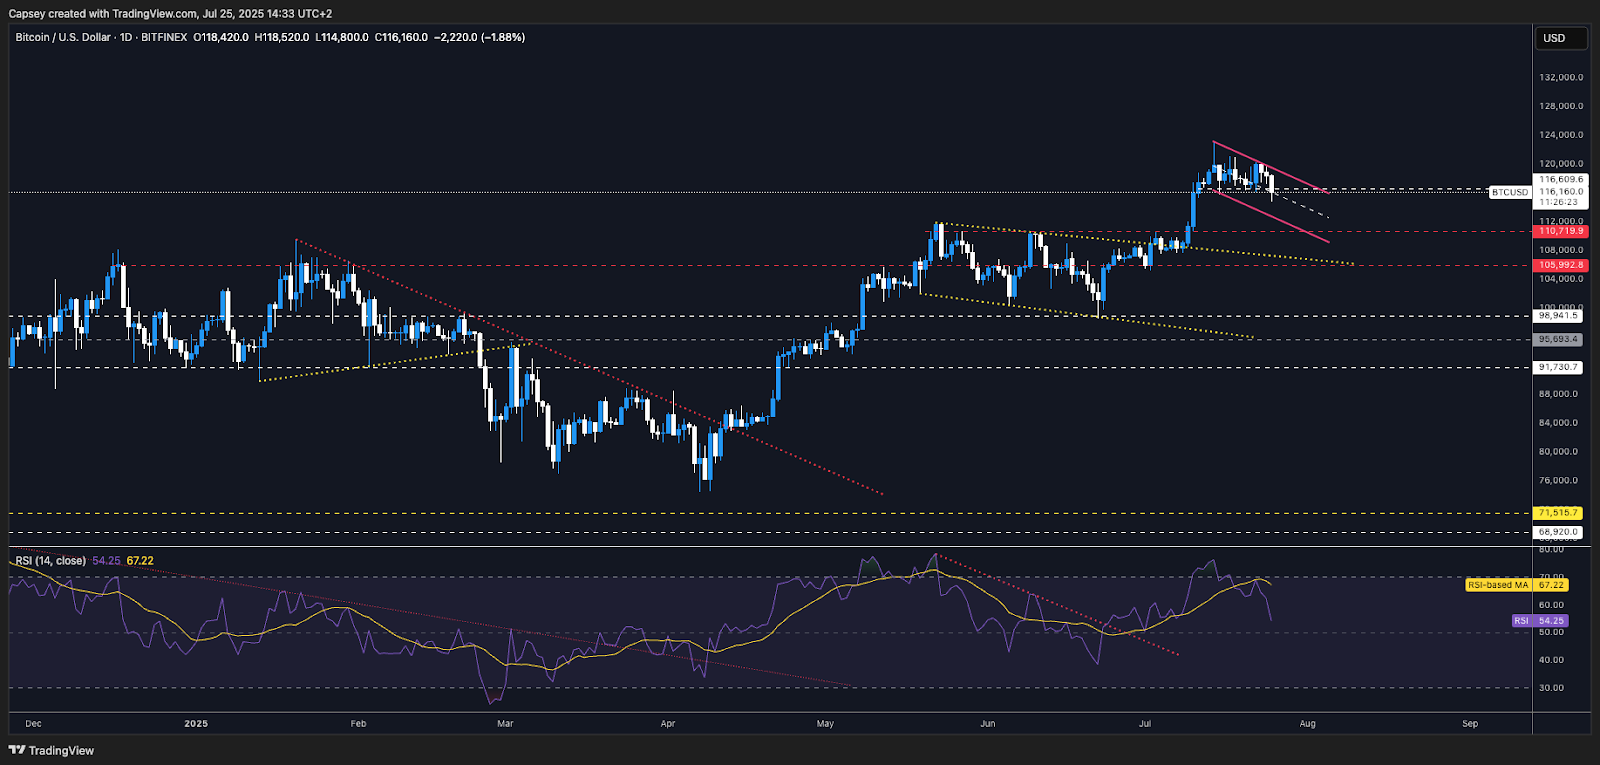
- After breaking out to all-time highs, the price has consolidated and formed a local top.
- Price is currently attempting to break below the local horizontal support of $116,600; however, the broader bull flag structure remains intact.
- The CME gap is between $114,300 and $115,700, so this zone should act as support for the price.
- Below $114k, the major support zone is between $110,700 and $112,000. Our base case is that price doesn't go below this zone, should price even reach it at all.
- To the upside, the local horizontal resistance is at $120,000, with the all-time high of $123,000 being the major horizontal resistance.
- This price pullback has meaningfully reset the RSI, which has now pulled back to middle territory. This is very healthy.
Cryptonary's take
BTC is under pressure from a large seller (80k BTC rumoured to be from Galaxy, who took it off a client to sell). With that said, BTC is down just 5.9% from its all-time high,s and it continues to hold a bullish flag structure.Our base case is that Bitcoin is going to continue to consolidate between $112k and $120k for more weeks before it breaks out later (in the medium term). We would be buyers of BTC below $115k, and we'd be aggressive buyers between $110k and $112k, although we don't expect the price to go below $112k - but if it does, we'll step in.
- Next Support: $115,000
- Next Resistance: $116,600 (then $120,000)
- Direction: Neutral (short-term)
- Upside Target: $130,000
- Downside Target: $112,000
ETH:
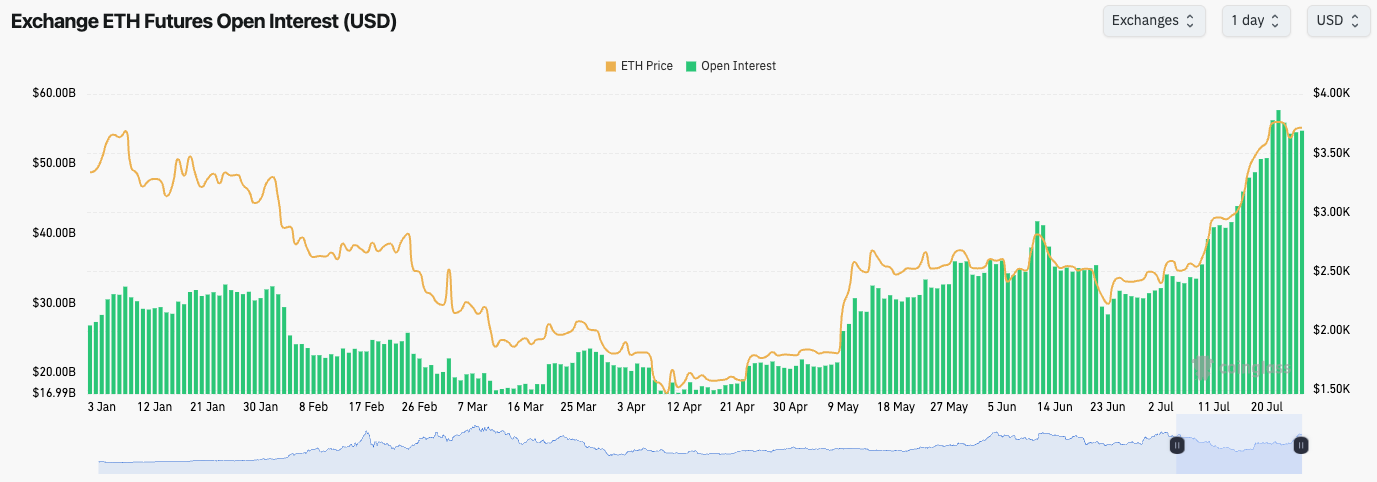
- ETH's Open Interest remains very high, although it has pulled back just slightly in the last days as price has pulled back from the highs in the $3,800's.
- The Funding Rate remains positive (at 0.012%), so there is appetite for leverage Longs. However, in recent days, this has been counteracted by Spot sellers.
Technical analysis
- Following ETH's monumental rally from $2,400 to $3,800, the price has begun to stall in the short-term.
- Price was majorly overbought on the RSI at 88 on the Daily timeframe, so a pullback/period of consolidation is healthy here.
- Price has pulled back and found support at the major horizontal level of $3,480, with price bouncing nicely from that level.
- To the upside, the major horizontal resistance is $3,970. Should price break out of this level, then it would set up a move to $4,500.
- Despite the pullback in price, it's quite minimal when you look at the extent of the rally, and the price is still holding its bullish structure in the bull flag.
- One potential cause for concern will be if the price does break out to the upside and retests $3,970, but can't break out, then it's likely the RSI will put in a bearish divergence in overbought territory. This is something to keep in mind should the price break out but not break above $3,970.
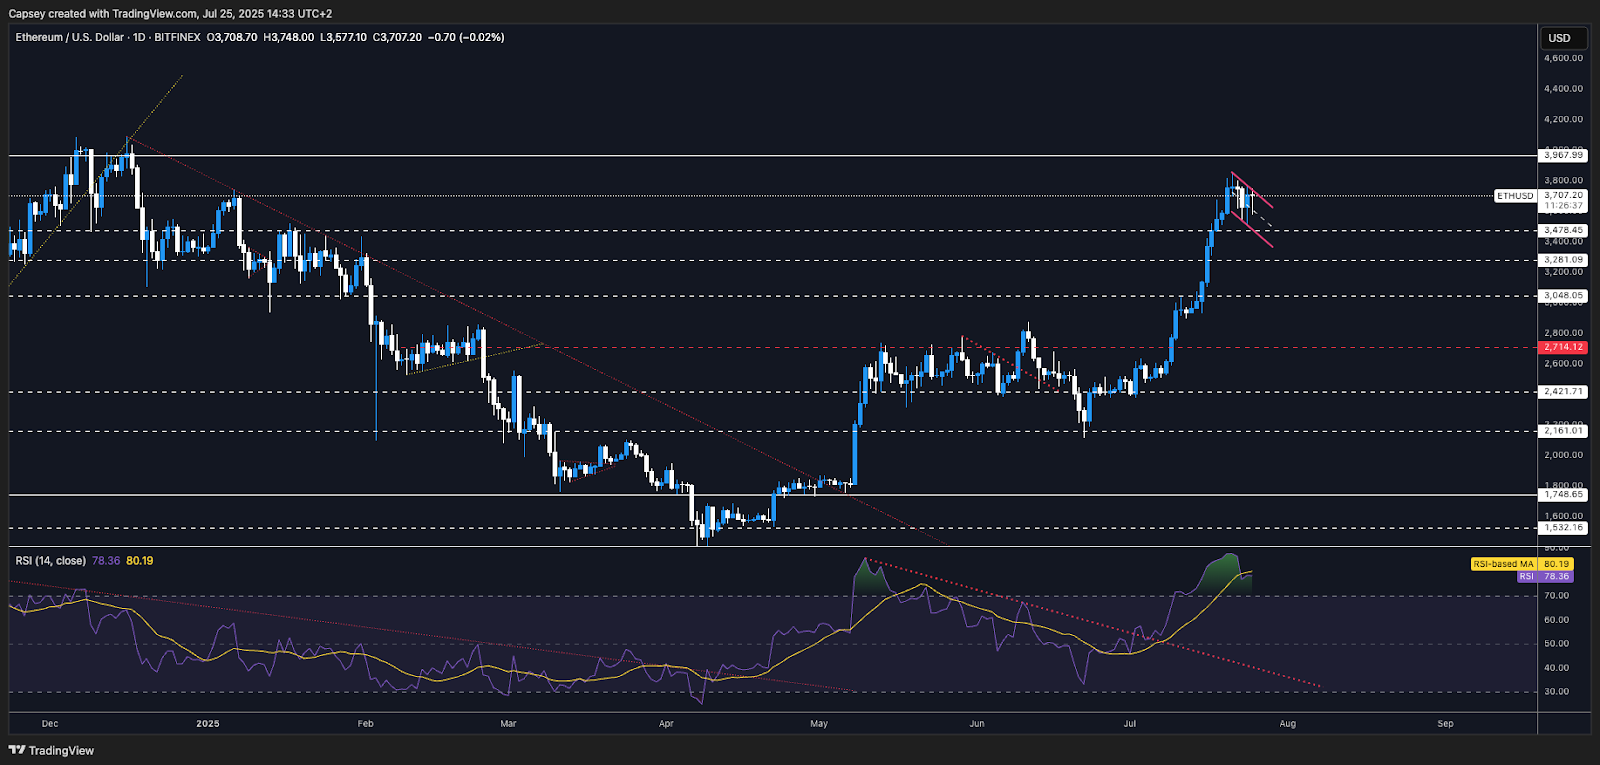
Cryptonary's take
In the last days, ETH has pulled back from the highs, and the price is now consolidating between $3,480 and $3,800. This is a positive development as it resets the indicators which were overbought in the short-term, whilst price also forms a bull flag.Price is essentially range-bound here until it breaks out or down from the bull flag. With the indicators still majorly overbought, we wouldn't be surprised to see the price consolidate further before a more meaningful move.
Our base case is that the price will break out to the upside, rather than down and below the horizontal support of $3,480.
- Next Support: $3,480
- Next Resistance: $3,970
- Direction: Neutral (short-term)
- Upside Target: $4,500
- Downside Target: $3,480
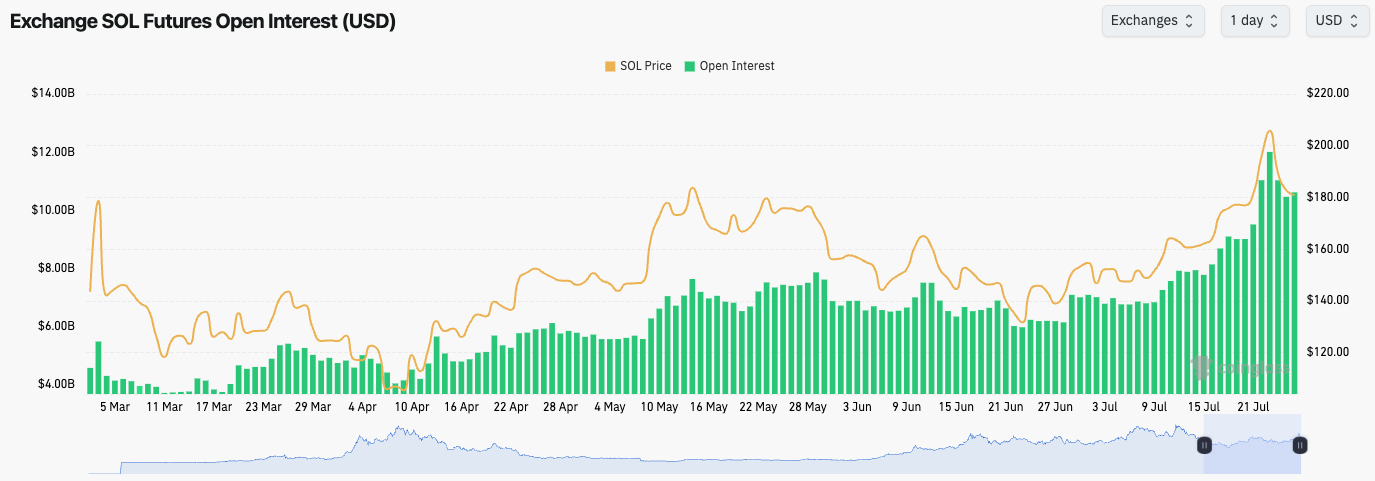
SOL:
- SOL's Open Interest was at all-time highs, but it has now pulled back.
- The Funding Rate is positive but not at elevated levels. This is a healthy leverage setup.
Technical analysis
- SOL rejected into the major horizontal resistance of $203, and the price pulled back to the horizontal level of $185.
- Price was unable to hold the horizontal support of $185. This opens the price up to being range-bound between $165 and $185, assuming $185 can't be recovered in the immediate term.
- It is possible that the price can be supported by the uptrend line. Should the price break below the uptrend line, it would be a bearish development.
- This price pullback has meaningfully reset the RSI, with it previously having been very overbought at 82 and now resetting back to 57.
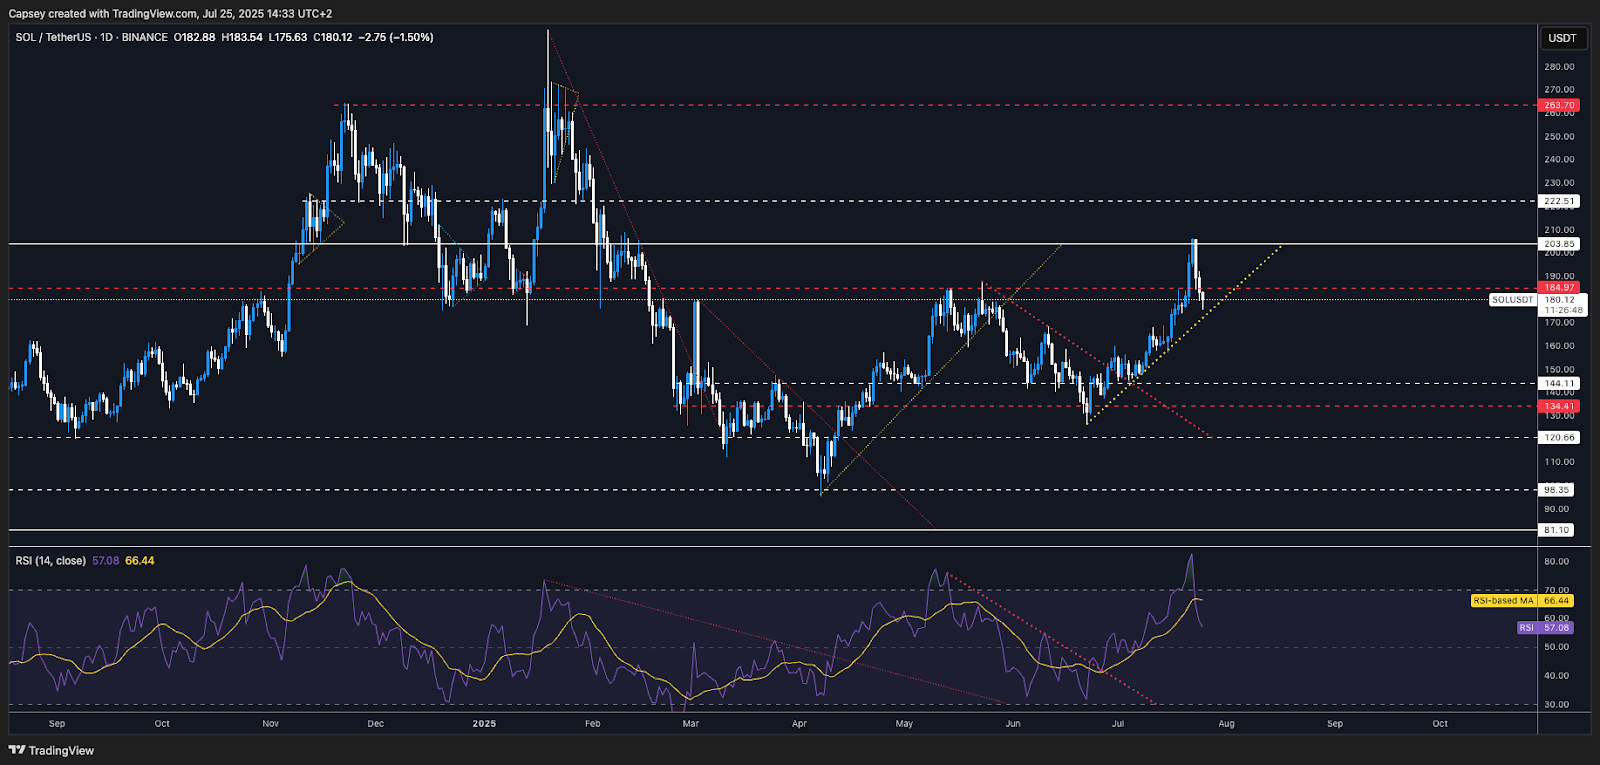
Cryptonary's take
From a leverage perspective, SOL has a healthier setup than other Majors like BTC and ETH. However, from a technical analysis perspective, SOL has broken down and until price can recover the $185 horizontal level, we'd struggle to be bullish.But, if price were to pull back further, and retest the $165 area, we'd consider this an area where SOL looks undervalued and therefore, we'd look to buy SOL at $165 with a view to holding it for the next 12 months (the long-term).
- Next Support: $165
- Next Resistance: $203
- Direction: Neutral (short-term)
- Upside Target: $203
- Downside Target: $165
HYPE:
- HYPE rejected from the psychological level of $50.00, and the price has since pulled back and used the $42.00-$44.00 level as support.
- Price is now battling at the local uptrend line, with pricing having fallen below it and now attempting a reclaim.
- To the downside, the horizontal supports are at $39.40 and $44.00, but the whole range can be considered a zone of support.
- To the upside, $45.80 is a local resistance, with the major horizontal resistance coming at $50.00.
- This price pullback has allowed the RSI to reset, having been in overbought territory when price locally peaked at $50.00 in mid-July.
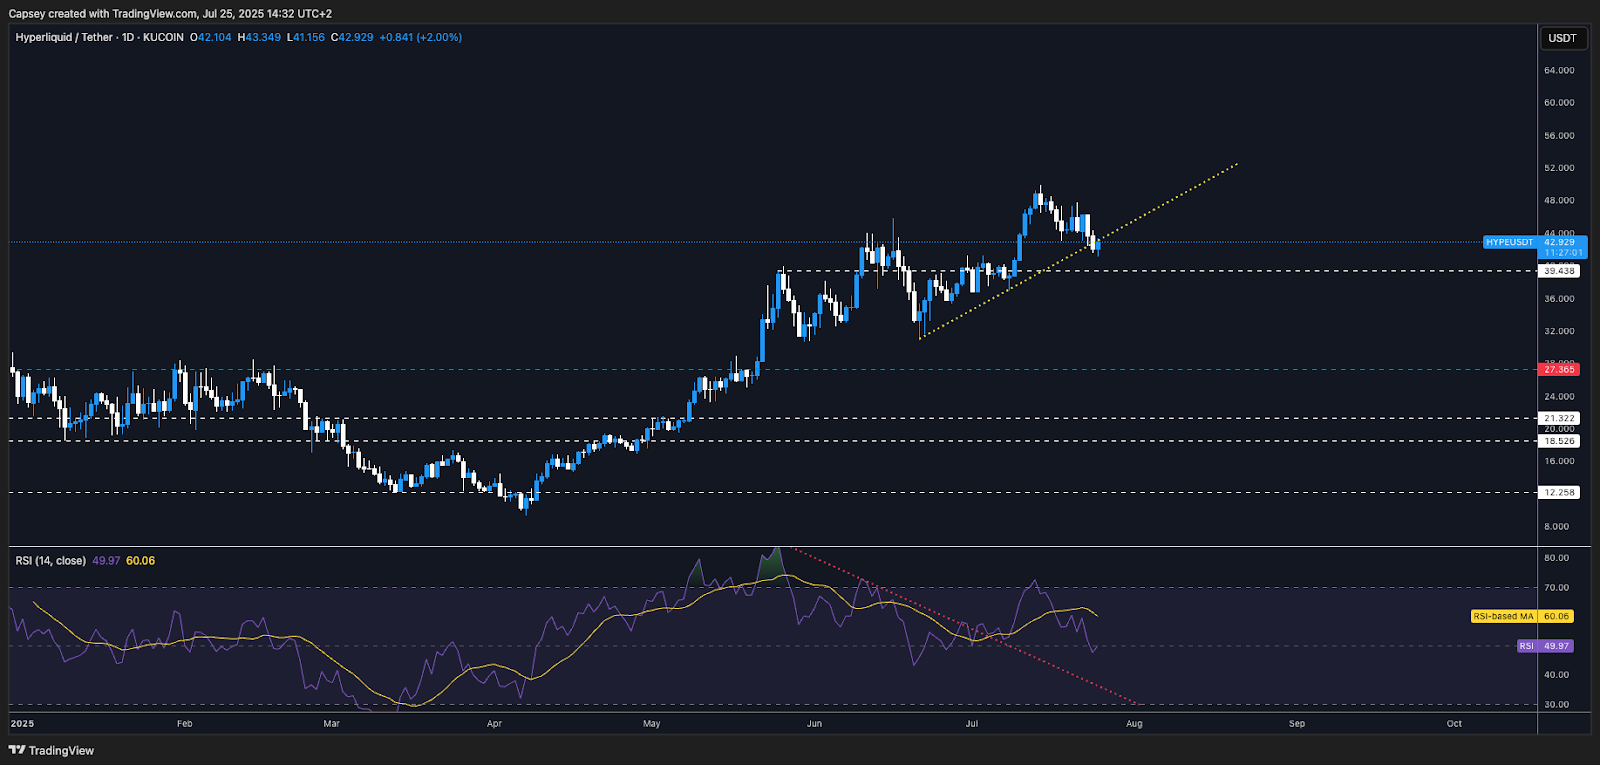
Cryptonary's take
Despite other Majors pulling back more substantially in the last few days, HYPE has performed well in that it has held the low $40's area. This supports our view that the $39.40 to $44.00 zone is a general zone of support. We'd be light buyers of HYPE towards the bottom end of this zone, and we'd become aggressive buyers should HYPE fall below $39.40 down to the mid-$30's.- Next Support: $39.40
- Next Resistance: $45.80
- Direction: Bearish/Neutral
- Upside Target: $50.00
- Downside Target: $39.40
AURA:
- For this analysis, we'll revert to looking at AURA on the 4-hour timeframe rather than the Daily timeframe.
- AURA is well in the process of forming a 'Cup-and-Handle' pattern, with price now putting in the 'Handle' part of the formation. This is a bullish pattern which would have a breakout target of $0.35-$0.40, should the price breach above $0.24.
- To the upside, the local horizontal resistance is at $0.20, which is also a psychological level. The main horizontal resistance is at $0.24; this is the key breakout level.
- To the downside, local support levels are at $0.146 and $0.177.
- Theoretically, if the price were to dip down to $0.146, the 'Cup-and-Handle' pattern would still be valid. However, we currently don't see a move down to $0.146 as likely.
- This price move down from $0.24 to $0.19 has meaningfully reset the RSI on the Daily timeframe (the important timeframe). Considering it's just a 20% pullback (not much for memes), this is a very healthy reset for the indicator.
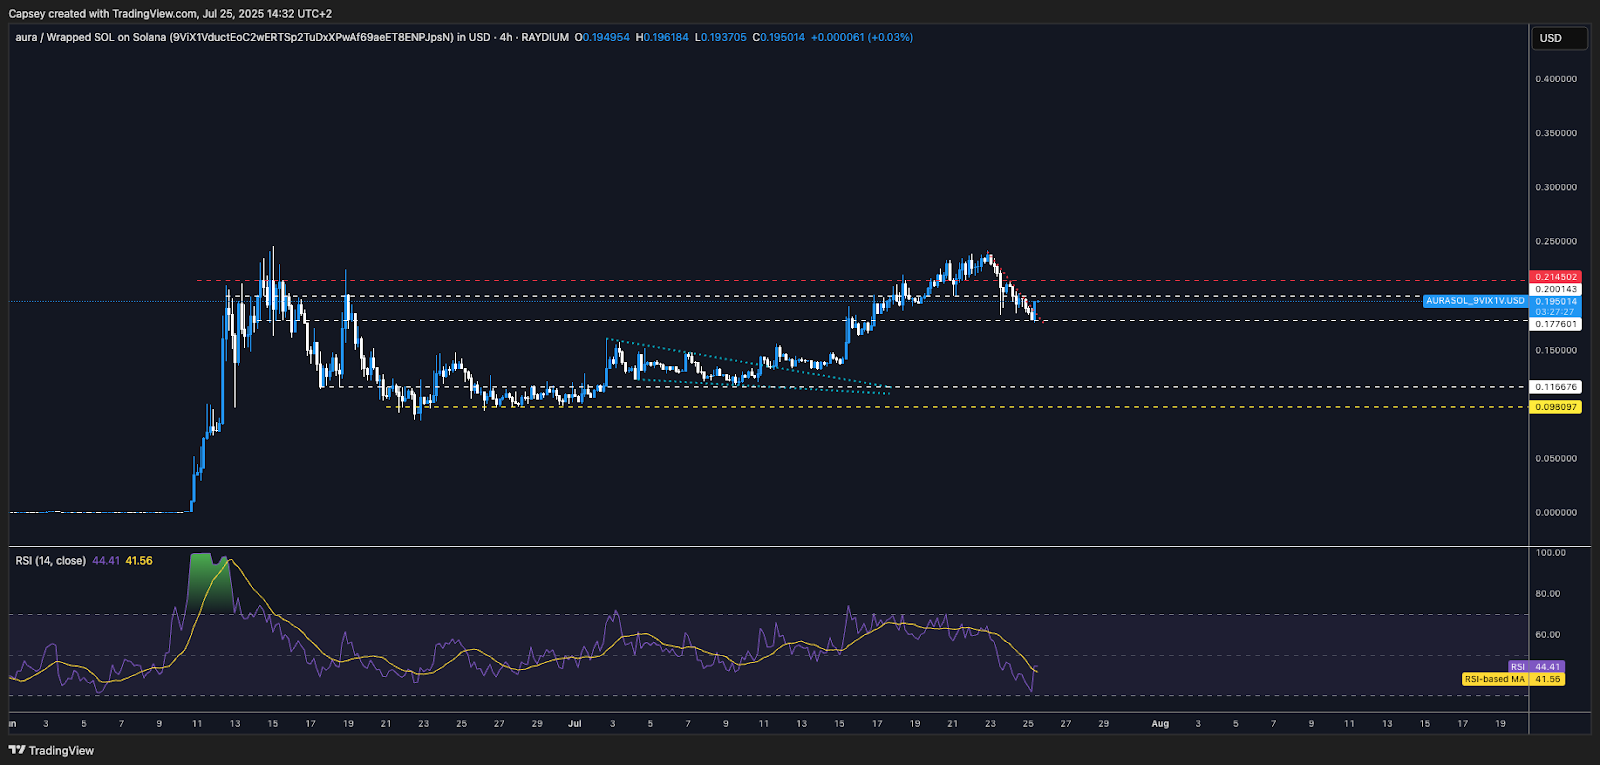
Cryptonary's take
This is a fantastic chart structure, and one we were able to see relatively early in the process. Price has formed the 'Cup' in the 'Cup-and-Handle' pattern, and price is now forming the 'Handle' part of the pattern. At these price levels, and with this chart structure, it would suggest a short to medium term breakout target of $0.35-$0.40.Lastly, as AURA has developed more recently, we've seen large price movements down as those who have wanted to sell their positions have sold. We believe most weak hands have exited, reducing sell pressure and improving conditions for a breakout.
Our base case is that AURA trades between $0.35-$0.40 in the near-term, with longer-term targets well north of $1.00.
- Next Support: $0.177
- Next Resistance: $0.240
- Direction: Bullish
- Upside Target: $0.40
- Downside Target: $0.146
Closing thoughts
This week, we have seen a more substantial pullback, which was necessary after the moves up that we've seen over the last few weeks. These price moves have reset a lot of the metrics that were overbought, which is needed and healthy in a wider bull market rally.Should prices pull back further, we'll look to add to certain positions, with some key levels for re-entry given in the above analysis. Overall, we've been relatively spot on recently, and we'll be looking to keep this up. Enjoy your weekend, all, see you Monday!
LET’S GOOO!!!
Recommended from Cryptonary


