Save 23% ($351) & Get a Free 1-1 Call with our Team ⏰ : 0d 2h 59m 44s

Disclaimer: This analysis is for informational purposes only and not financial advice.
TLDR:
- Macro: Powell’s dovish tilt boosted risk assets; supportive near-term backdrop.
- BTC: Range $112K–$117K; bullish bias, eyeing $120K, invalidation below $108K.
- ETH: Strong spot + narrative; targeting $5K–$5.5K, support $4.2K–$4.4K.
- SOL: Bullish after reclaiming $185; breakout above $203 opens $222–$260.
- HYPE: Consolidating $40–$45.8; breakout above $50 could target $60.
- AURA: Reclaimed $0.145; squeeze into downtrend, aiming $0.177–$0.215.
BTC:
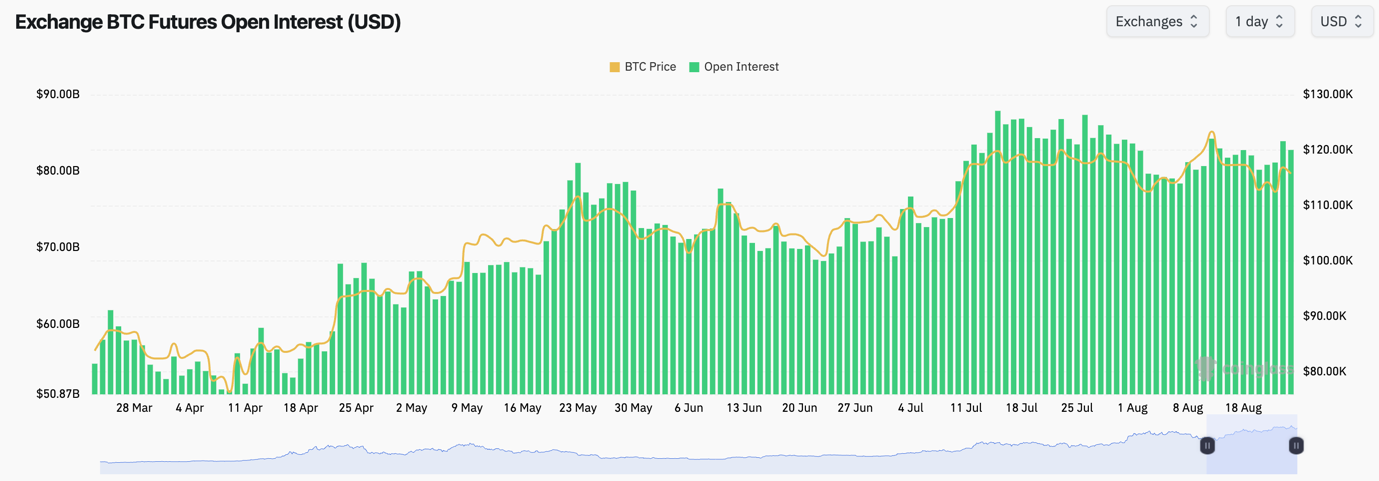
- BTC's Open Interest kicked up slightly from the lows, although it isn't back up to or close to all-time highs.
- BTC's Funding Rate is back to 0.01%, indicating that there is a bias to be Long from traders.
- The above setup described is a healthier leverage setup for BTC, with price bouncing from the lows driven by a Spot bid rather than excessive leverage - this is good to see.
Technical analysis
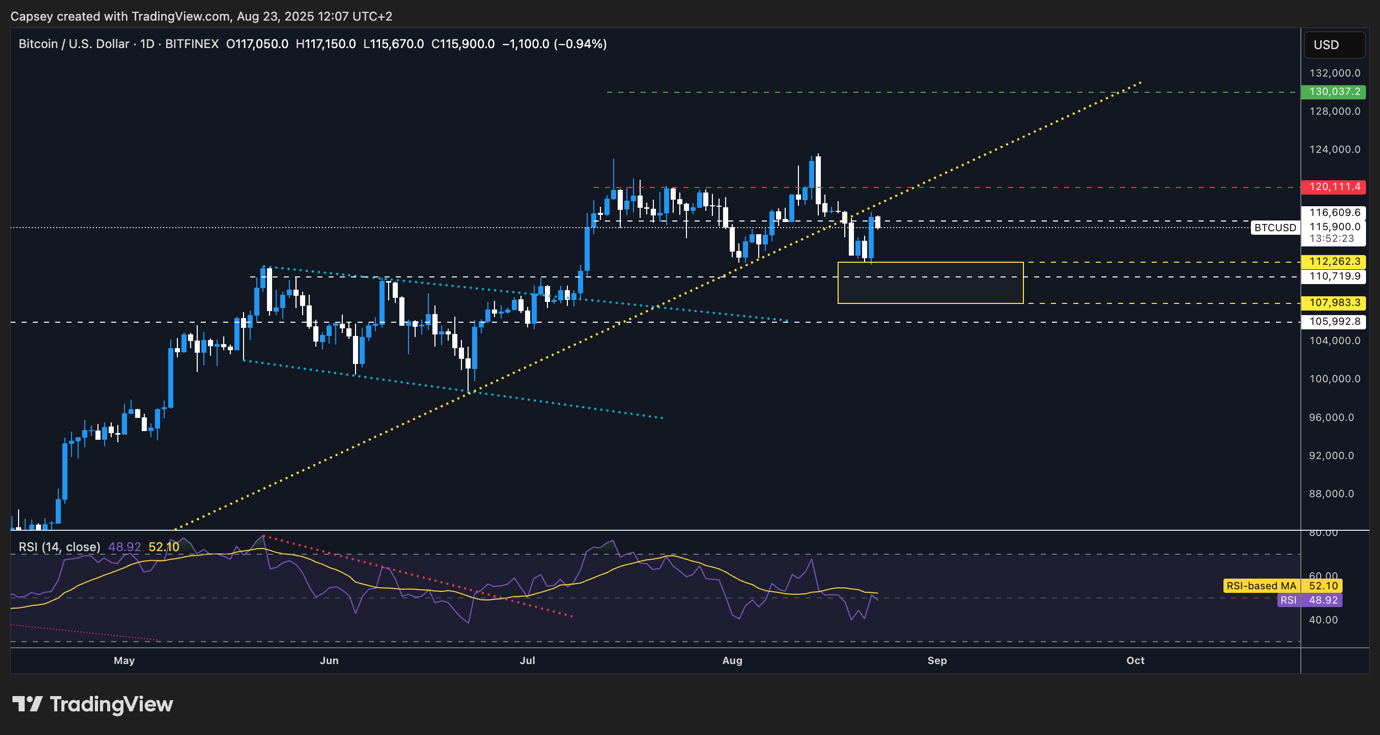
- BTC broke below its main uptrend line, and the price pulled back to the Yellow Box at $112,000, where the price was able to bounce from.
- Following a more dovish than expected Powell at Jackson Hole on Friday, risk assets ripped, and BTC was able to bounce from $112,000.
- Price bounced into the underside of the main uptrend line and the horizontal resistance of $116,600. Both levels are key levels of resistance that the price will need to overcome.
- Should price reclaim these levels to the upside, then the next horizontal resistance is at $120,100.
- Should price reject in the short-term from $116,600, then price may revisit $112,000; however, we would be aggressive buyers at this level should we get it again.
- We'll be dip buyers of BTC between $108,000 and $112,000, but we're not confident we'll be given these levels. But should these levels are given to us, we'll see them as attractive buying levels.
- The RSI has meaningfully reset back to middle territory, but it's underneath its moving average, which may prove to be a resistance in the immediate term.
Cryptonary's take
Markets were fearful going into Powell's Jackson Hole speech this Friday. But following a highly unexpected dovish tilt from Powell, risk assets were able to rally, and we're likely to see a continuation of this supportive environment. However, in the short term, BTC is still in a bearish structure as the price is below its uptrend line and its main horizontal support of $116,600.It's our base case that price might remain range-bound in the short-term (in the next 3-7 days), between $112,000 and $117,000, but that the next meaningful move higher will be up. Therefore, we'll accumulate BTC between $108,000 and $112,000, should we get these levels, although we're not confident that we'll see sub $112,000 levels.
An invalidation of the above would be a breakdown below $108,000, but we do not expect this. We expect a short consolidation period before a breakout of $116,600 and then $120,100.
- Next Support: $112,000
- Next Resistance: $116,600
- Direction: Bullish
- Upside Target: $120,100
- Downside Target: $112,000
ETH:
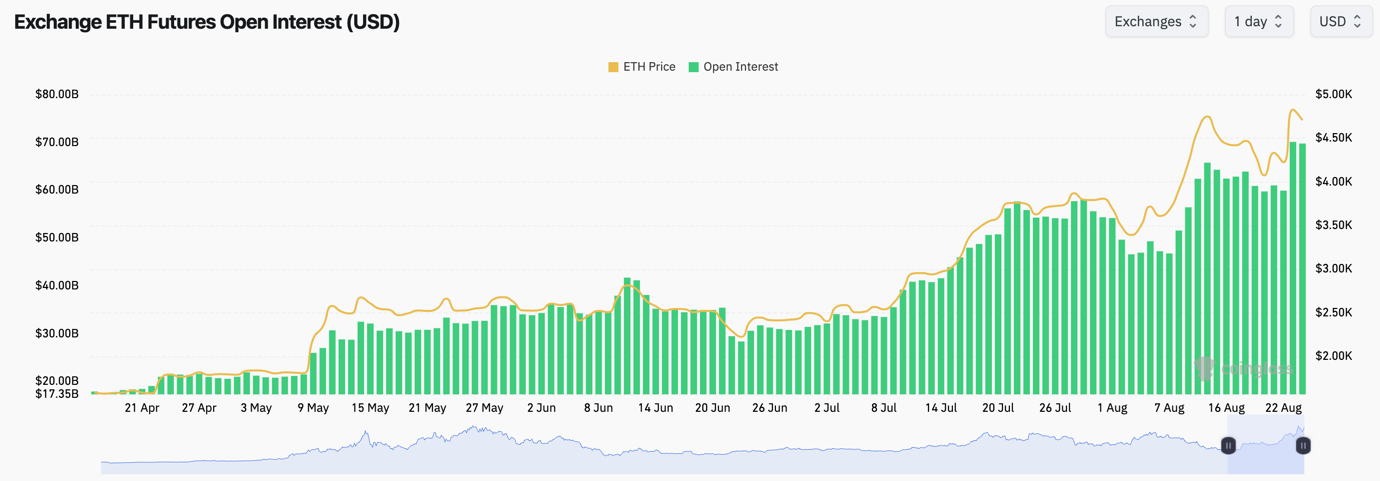
- ETH's Open Interest has soared to new all-time highs, but price rocketed higher yesterday following a strong Spot bid to match the large increase in leverage.
- Funding Rates are positive but not at frothy levels, which is good to see. We would become cautious should we see Funding Rates push into the 0.03%-0.06% range - but for now they're ok at 0.01%.
Technical analysis
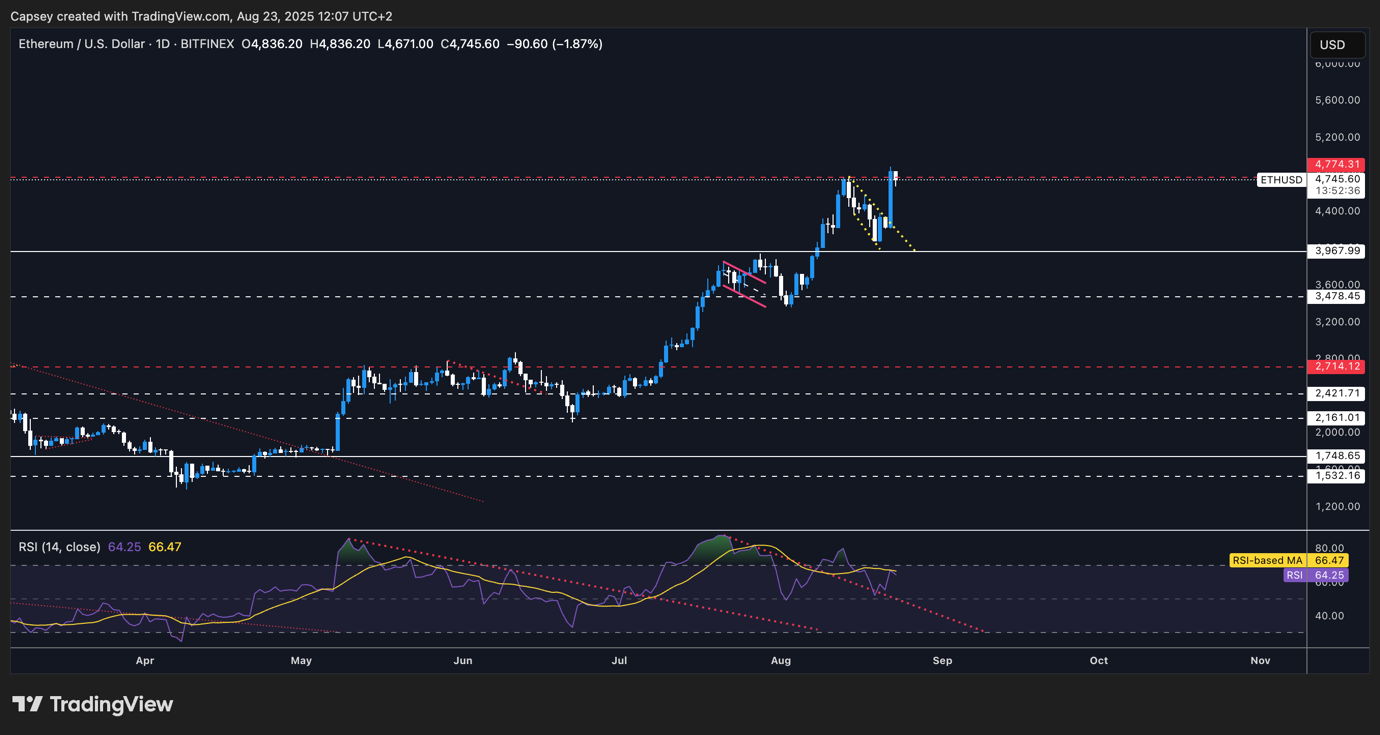
- ETH pulled back from its highs at $4,780, with price pulling back to $4,080.
- Price was in a downwards broadening wedge, which would have a bullish breakout bias. And upon Powell's dovish tilt, ETH broke out of the wedge.
- Price immediately moved straight back up to $4,780, and slightly beyond, supported by a leverage push and a strong Spot bid.
- ETH is now range-bound between $4,600 and $5,000 which will be a key horizontal resistance as well as a psychological resistance for price to overcome.
- Should price pull back, we expect the low $4,000's to be a strong support for price, should it even be retested.
- The RSI is just shy of overbought territory, which isn't a concern. But one small concern is that the RSI is putting in back-to-back bearish divergences (higher highs in price, lower highs on the oscillator).
Cryptonary's take
ETH currently has a strong narrative with the Treasury company buys, which is keeping ETH, its price, and its eco-system, buoyant.Even though there are some bearish technicals like the bearish divergence, we expect the narrative and the significant buying pressure to help ETH push beyond $5,000, with $5,500 the next major horizontal resistance should we see a breakout of $5,000.
For those looking for dip-buying opportunities, we'd look at the $4,200-$4,400 region to add buys, targeting $5,000-$5,500.
- Next Support: $4,200
- Next Resistance: $5,000 (then $5,500)
- Direction: Bullish
- Upside Target: $5,500
- Downside Target: $4,200
SOL:
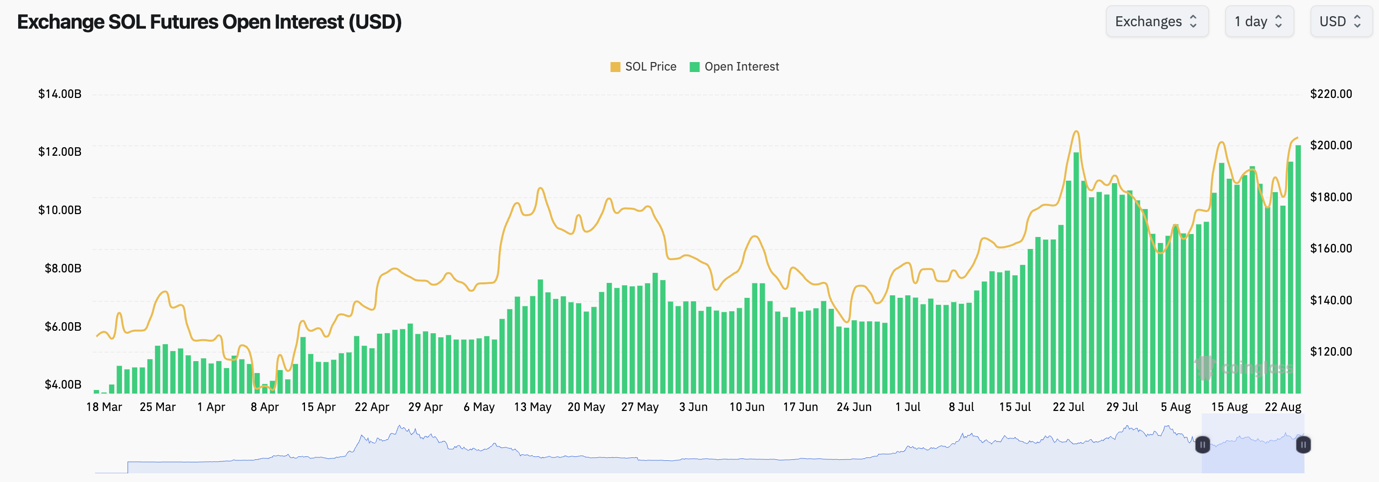
- Upon yesterday's dovish tilt from Powell, SOL's Open Interest soared to new all-time highs, whilst the Funding Rate also increased to just north of 0.01%.
- This is now a slightly frothier setup, with SOL having put in pull backs recently when Funding increased beyond 0.01%.
- For now, this setup is probably ok, but we'll continue to monitor it. Should the Funding Rate really increase further, we would begin to exercise some caution that a leverage flush-out might then be imminent.
Technical analysis
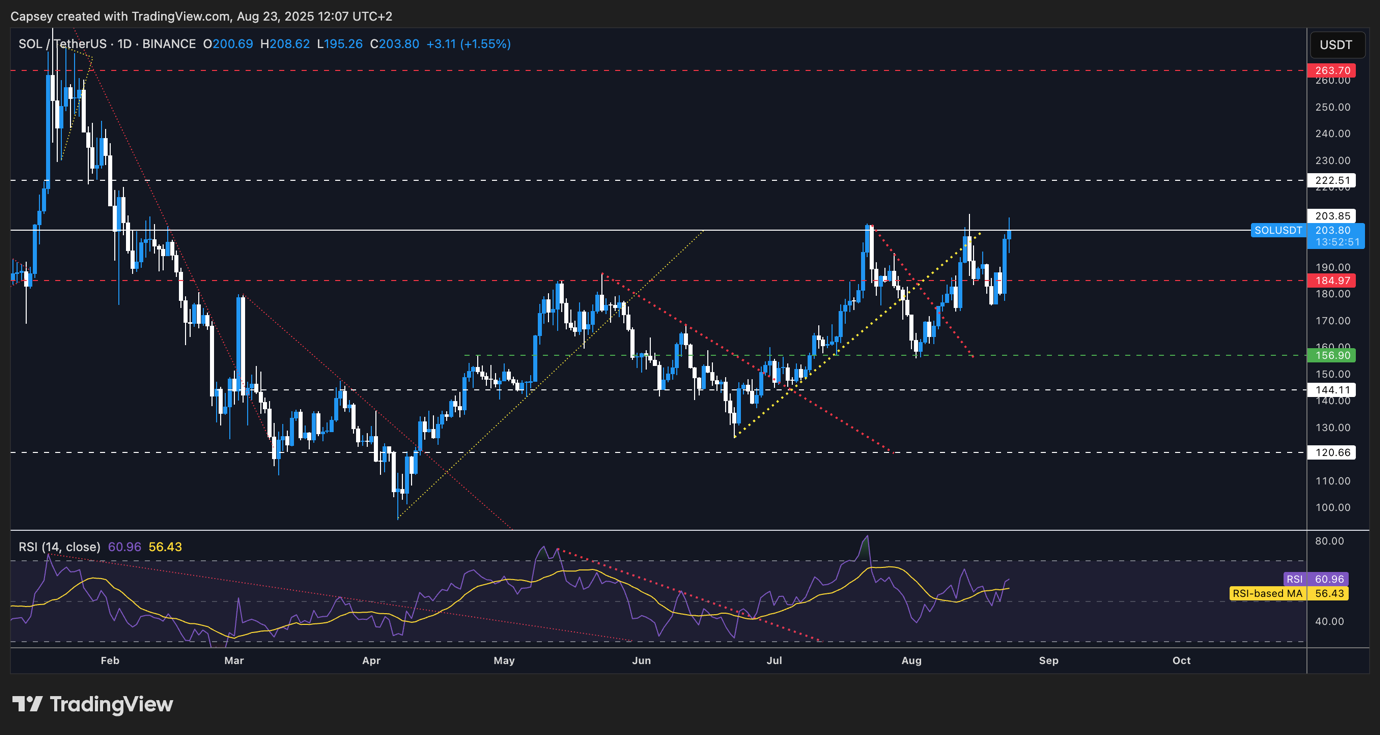
- SOL found support at $175, with the price then managing to reclaim the key horizontal level of $185.
- Following yesterday's dovish tilt from Powell, price quickly moved up into the main horizontal level of $203, where price is currently battling at.
- Should price reclaim $203, then $222 would be the next key horizontal resistance for price.
- Beyond $222, things can get more exciting. Beyond $222, there is little resistance up to $260.
- However, should price pull back from $203, we would expect $185 to maintain as a strong horizontal support.
- The RSI is in the middle territory, and it's just above its moving average. This suggests that upside can be had.
Cryptonary's take
From a technical perspective, SOL looks much better here now that it’s reclaimed the $185 level and it's butting up into $203. Should price pull back to $185-$192, we would look to add there for a breakout move of $203 and a push up to $222.Overall, the chart structure is bullish here. Yesterday was key in that price reclaimed key levels, with this showing strength.
- Next Support: $192
- Next Resistance: $203 (then $222)
- Direction: Bullish
- Upside Target: $222
- Downside Target: $185
HYPE:
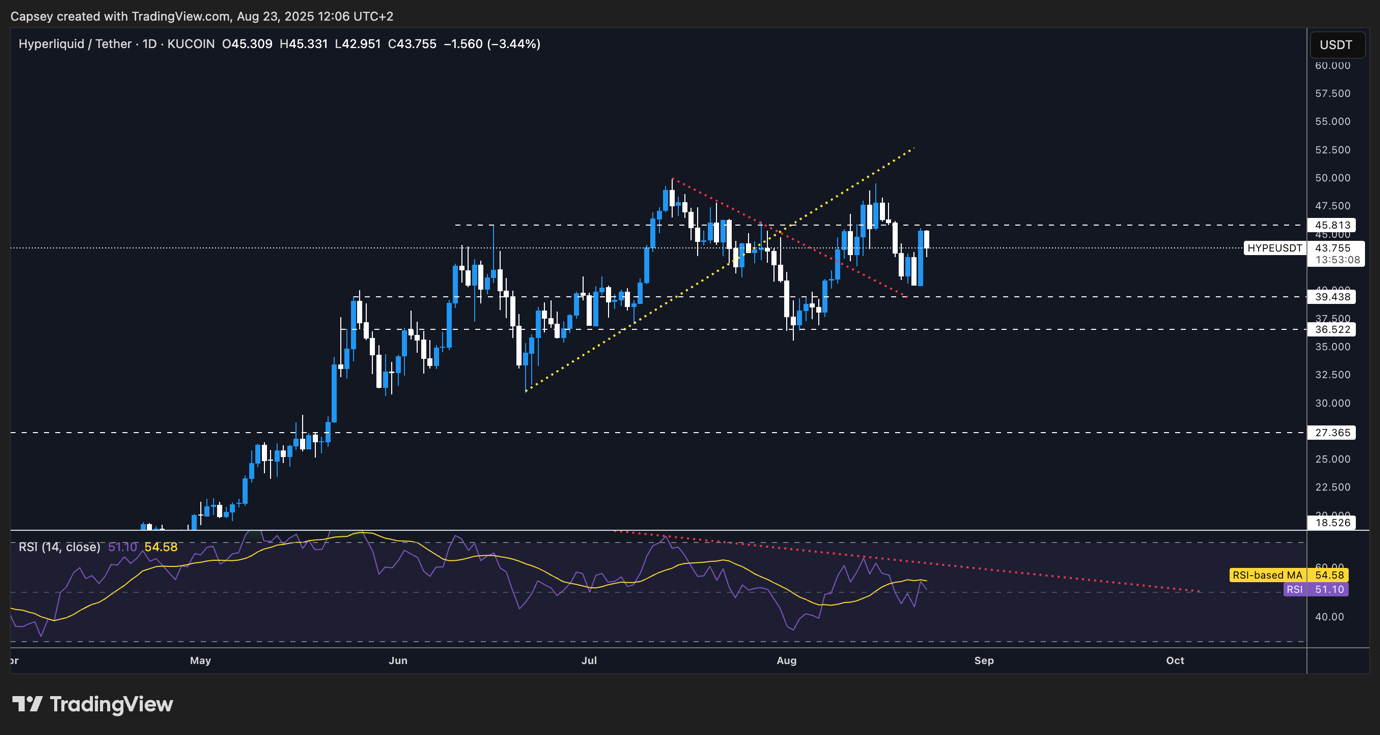
- HYPE moved into $49.50 and rejected into the underside of the prior uptrend line, with price then putting in a double-top pattern.
- Price pulled back but found support at $40.00 before bouncing yesterday.
- Price is now in a range between $40.00 and $45.80, with $45.80 being the main horizontal resistance.
- Should price break out of $45.50, $49.50-$50.00 is the next local horizontal resistance. But should price get above $50.00, then we expect a swift move up to $60.00.
- The support zone for the price is between $36.50 and $39.50. Should price visit this area, we'd be aggressive bidders of HYPE.
- The RSI is in a main downtrend, and it's below its moving average despite being in middle territory. We'd expect that once the RSI breaks out of its downtrend, this'll be the breakout for price above $50.00 that takes price to $60.00.
Technical analysis
- HYPE has consolidated between $40.00 and $45.80 for a considerable period now. This will only help and aid a breakout of $50.00 once $45.80 is convincingly broken to the upside.
- We remain constructive on HYPE, and we'd look to add positions between $36.50 and $40.00 should these levels be revisited. However, we see a revisit of these levels as unlikely currently; therefore, we side with just holding our current Spot bags in preparation for a breakout to the upside.
Cryptonary's take
HYPE has consolidated between $40.00 and $45.80 for a considerable period now. This will only help and aid a breakout of $50.00 once $45.80 is convincingly broken to the upside.We remain constructive on HYPE, and we'd look to add positions between $36.50 and $40.00 should these levels be revisited. However, we see a revisit of these levels as unlikely currently; therefore, we side with just holding our current Spot bags in preparation for a breakout to the upside.
- Next Support: $40.00
- Next Resistance: $45.80 (then $50.00)
- Direction: Bullish
- Upside Target: $50.00
- Downside Target: $36.50
AURA:
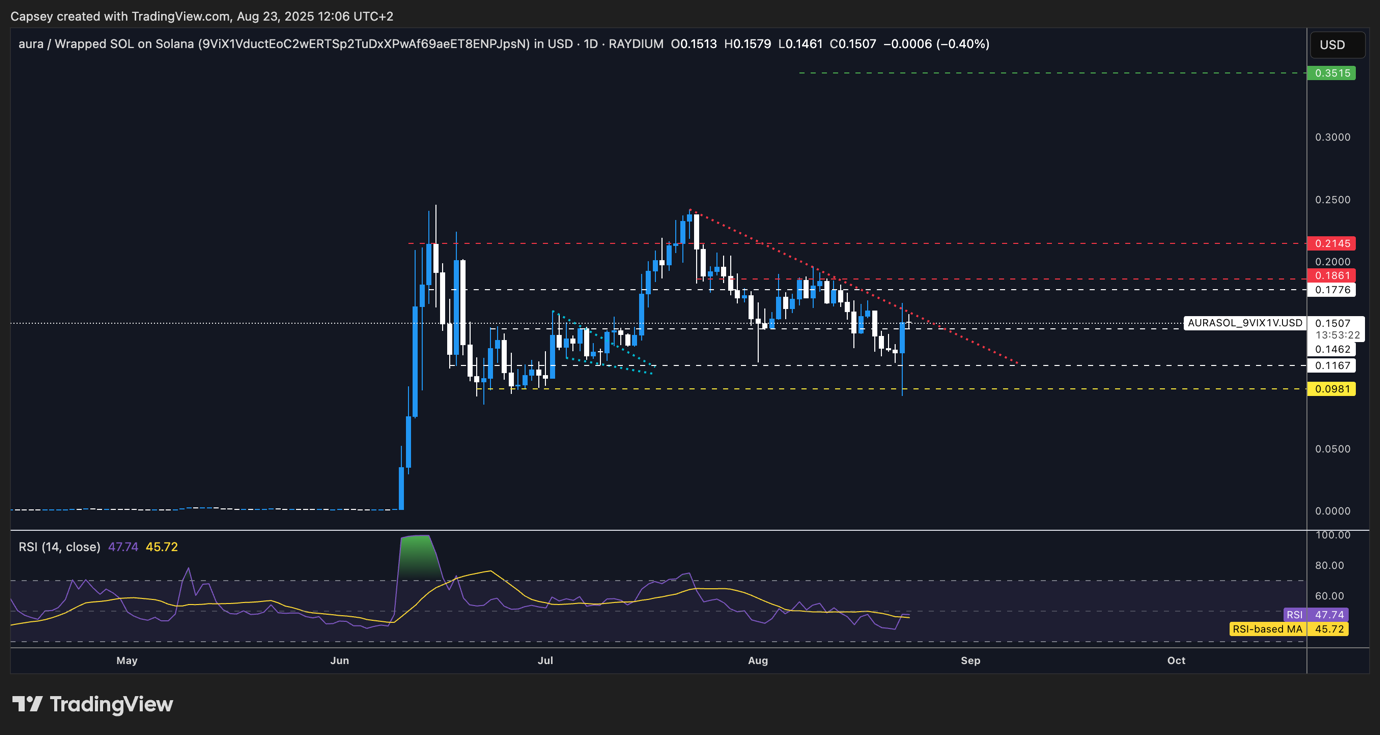
- AURA lost its key horizontal support of $0.145, which then saw price retrace significantly lower, whilst that then invalidated the 'Cup-and-Handle' chart structure.
- However, price dipped into the major horizontal zone of support between $0.098 and $0.116, which saw a monster bid come in, and price bounced aggressively.
- Price was then able to bounce and recover the key horizontal level of $0.145.
- Price is now above $0.145, whilst it's also squeezing into its main downtrend line. A breakout of this downtrend line should result in a significant breakout to the upside, targeting $0.177-$0.186 in the short-term. A new bullish structure.
- Beyond $0.177-$0.186, the next resistance zone would be between $0.215-$0.245.
Technical analysis
- Price lost the $0.145 level, and this invalidated the 'Cup-and-Handle' structure. However, price has quickly recovered with price now squeezing into its main downtrend line, whilst the horizontal level of $0.145 has been reclaimed. This is a bullish setup, and it sets up a potential chart breakout to $0.177-$0.186 in the short-term.
- With Powell tilting dovish yesterday, this provides a constructive environment in the near-term that should aid AURA in breaking out and putting in new all-time highs in the medium term.
Cryptonary's take
Price lost the $0.145 level, and this invalidated the 'Cup-and-Handle' structure. However, price has quickly recovered with price now squeezing into its main downtrend line, whilst the horizontal level of $0.145 has been reclaimed. This is a bullish setup, and it sets up a potential chart breakout to $0.177-$0.186 in the short-term.With Powell tilting dovish yesterday, this provides a constructive environment in the near-term that should aid AURA in breaking out and putting in new all-time highs in the medium term.
- Next Support: $0.145
- Next Resistance: $0.177 (then $0.215)
- Direction: Bullish
- Upside Target: $0.215
- Downside Target: $0.116
Closing words
We had a relatively hectic day yesterday with Powell speaking. To the market’s surprise, Powell’s dovish tilt opened the door to a September cut. In response, we saw risk assets pop meaningfully higher.We have therefore uploaded a new Market Direction above, in the hope that you guys are all informed for the weekend rather than waiting until Monday.
We're in dip buying mode, and we're expecting a really positive next few months, but of course it relies on the data as well, so we'll be on top of that and updating you all daily.
LET'S GOOO!!!!!
Recommended from Cryptonary


