Save 23% ($351) & Get a Free 1-1 Call with our Team ⏰ : 0d 2h 59m 43s

Disclaimer: This analysis is for informational purposes only and not financial advice.
TLDR:
- BTC: Lost $116.6k. If Powell dovish, reclaim possible. If not, expect $110k-$112k retest, that’s our buy zone.
- ETH: Reset at $4,170–$4,330 (major $3,970); wedge setup favours upside if Powell dovish.
- SOL: Dropped below $185; stronger buy zone at $155, but weak narrative.
- HYPE: Range $39.40–$45.80; attractive long-term buy near $39.40–$42.00. Above $50.00, opens a quick move to $60.00.
- AURA: Demand zone $0.116–$0.145 with bullish divergence. Breakout to $0.177–$0.186 short-term, then $0.215-$0.245, and $0.35-$0.40 longer-term.
BTC:
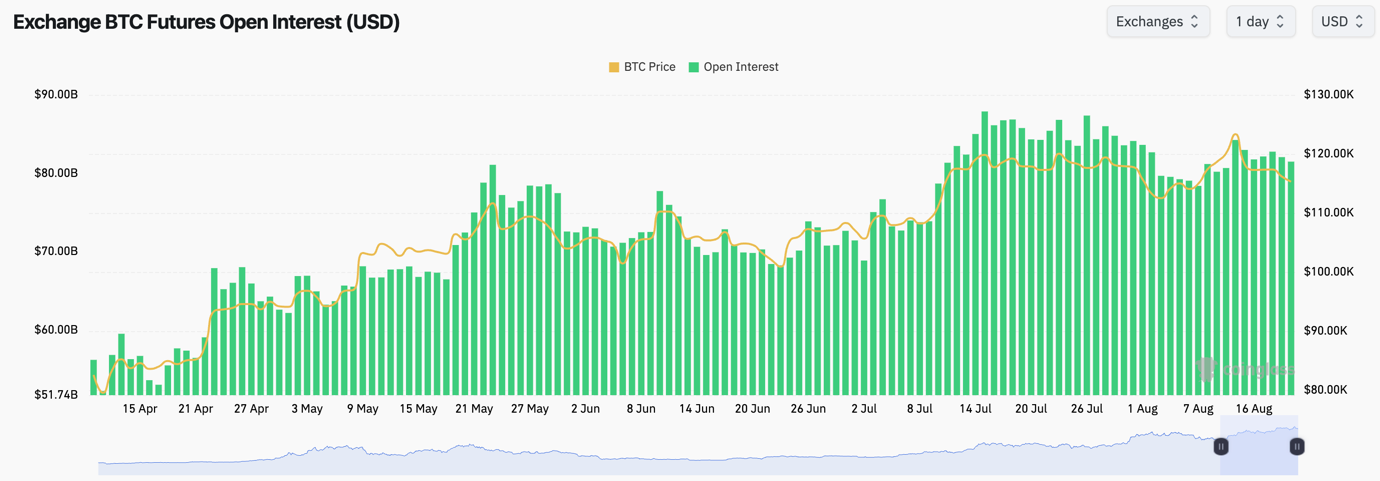
- BTC's Open Interest has had a healthy pull back from its recent price highs at $123k.
- The Funding Rate has also reset from just north of 0.01%, with it now ranging between 0.00% and 0.01%.
- The price move down for Bitcoin here wasn't a leverage flush out, but rather price was driven lower due to Spot selling.
Technical analysis
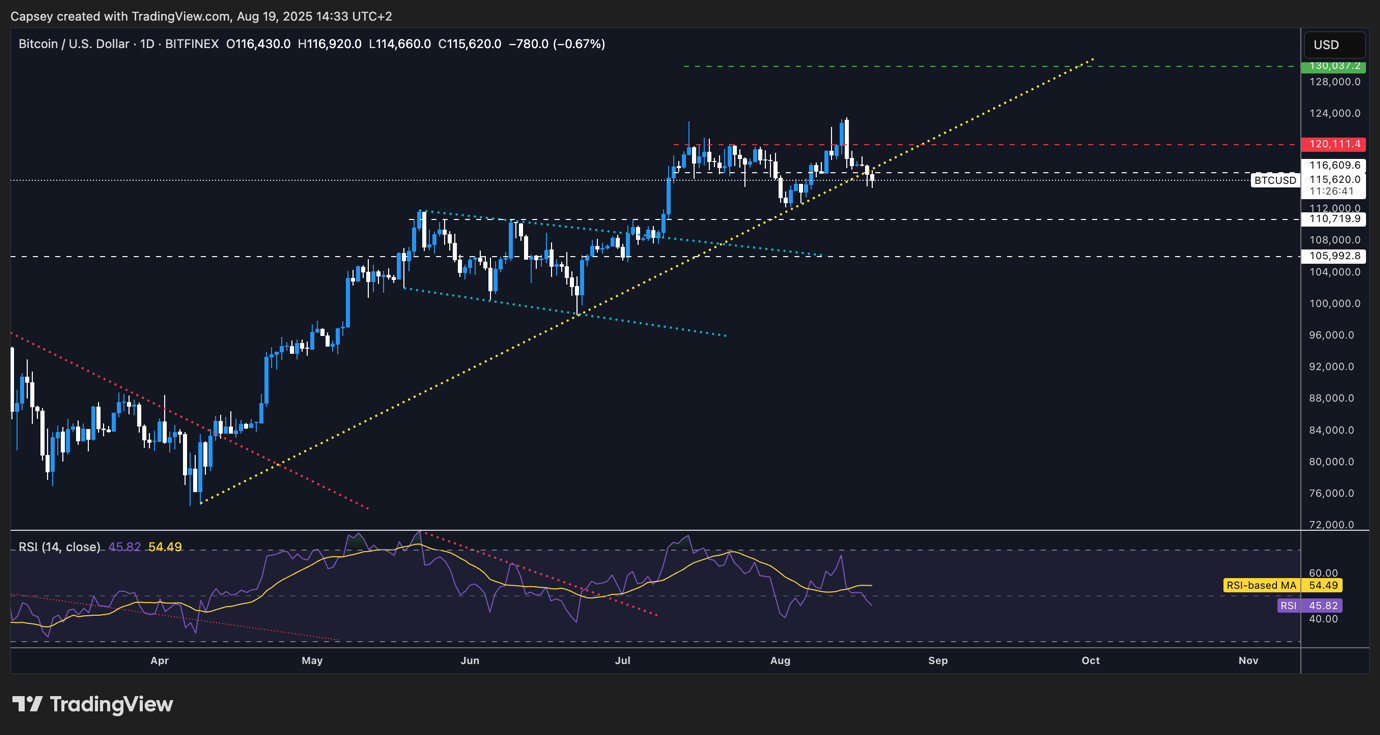
- From the technical perspective, BTC is at a key juncture here.
- Price is battling at the main horizontal support of $116,600 and the main uptrend line, with price currently just below both.
- Should price be unable to reclaim the uptrend line and $116,600, then the next key support zone is between $110,000-$112,000.
- If price can move higher, it'll likely use the underside of the uptrend line as a resistance level, along with the major horizontal level of $120,100.
- The RSI has reset on this price pull back with it in middle territory, but it's also below its moving average.
Cryptonary's take
BTC is at a crucial level here with price breaking below its main support of $116,600 whilst price is also losing its main uptrend line which has been intact since the early-April lows. Unless price can quickly recover these key levels (and it would likely take a dovish Powell this Friday to do so), then we'd expect BTC to retest the key support zone of $110,000-$112,000. Should BTC retest this level, we'd be strong buyers of Bitcoin, with a view to holding for the next 6-12 months, and potentially even longer.Markets and BTC are likely to remain range-bound and hesitant as we go into Powell's speech at Jackson Hole this Friday. From there is where we'll likely see the more major moves, either price breaking to the upside or downside. Our base case is that Powell remains data dependent but that he'll forward guide an interest rate cut for the September meeting assuming that the data continues to corroborate. Therefore, we expect BTC can breakout to the upside following Powell's speech on Friday.
- Next Support: $112,000
- Next Resistance: $116,600
- Direction: Neutral
- Upside Target: $120,100
- Downside Target: $110,000
What's next?
ETH and SOL are testing critical support zones as Jackson Hole nears. Watch for breakouts above $4,600 on ETH and $185 reclaim on SOL if Powell’s tone is dovish Friday.ETH:
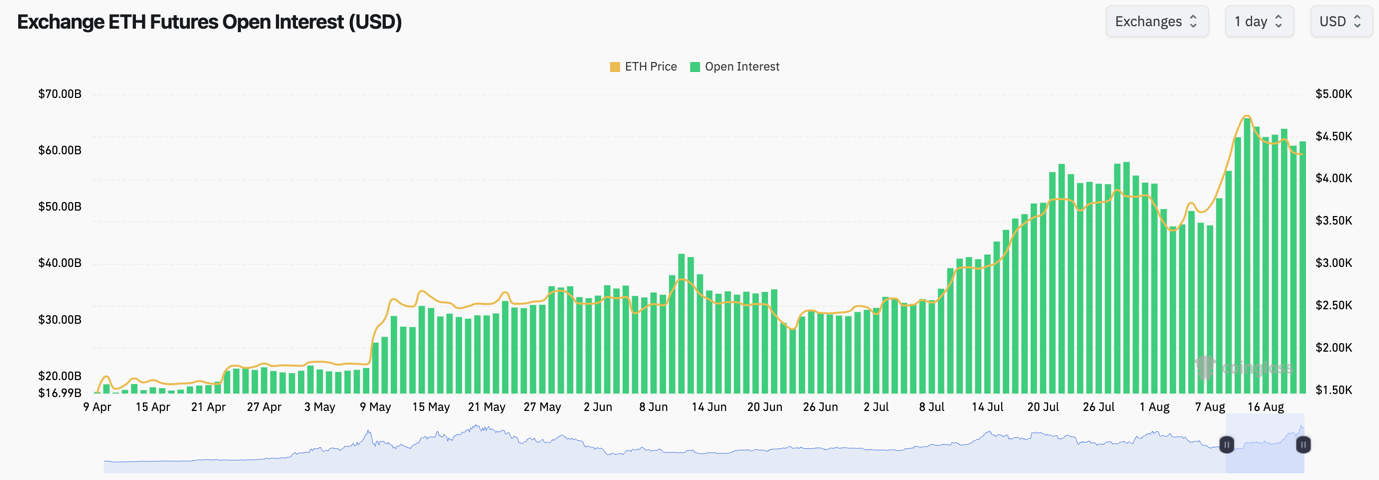
- ETH's Open Interest has slightly pulled back from its recent highs, however the overall level of Open Interest remains elevated.
- The Funding Rate also remains elevated at 0.01% but it's not at alarmingly high levels.
- Despite ETH's Open Interest remaining high, the price pullback was more due to Spot selling rather than a leverage flush out.
Technical analysis
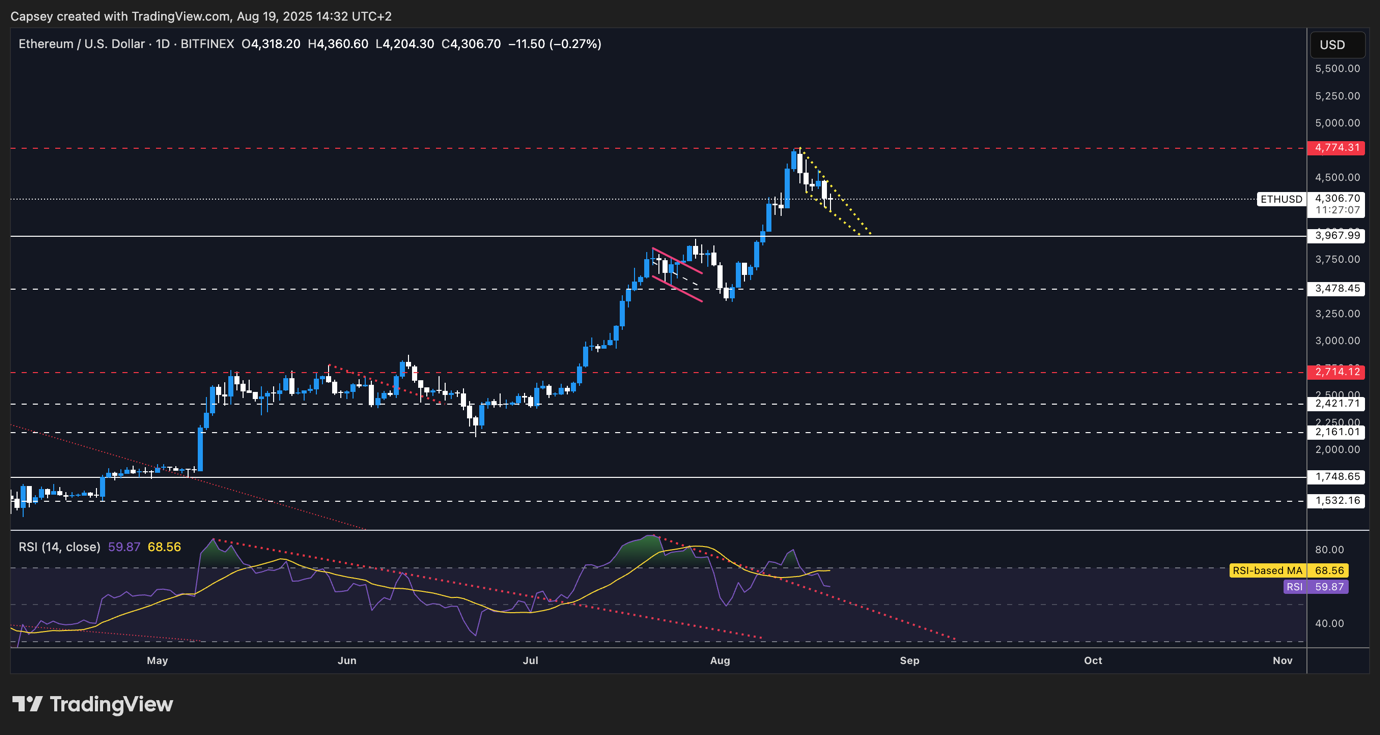
- ETH rejected at the main horizontal resistance of $4,770, which was a prior resistance area back in 2021.
- Price has now pulled back to a local support zone between $4,170 and $4,330. We expect price to find support in this zone, but should price break below it, we expect $3,970 to be a strong horizontal support.
- Should the price move below $4,170, we'd be buyers of ETH down to $3,970.
- Price is currently in a descending wedge pattern, which is a bullish structure. A breakout of the descending wedge would take the price back to $4,600, as a minimum target.
- This reset for price is positive. The RSI has pulled back to middle territory having put in back-to-back bearish divergences in overbought territory.
Cryptonary's take
ETH needed this pullback. Leverage was high (and whilst it remains high), the chart structure had several bearish indicators that have now more meaningfully reset. The key support for ETH is between $4,170-$4,330, with a major horizontal support at $3,970. Should price dip/deviate below the support zone, we'd be buyers of ETH between $3,970 and $4,170.Like the rest of the market, ETH is likely to be driven towards the end of this week by Powell's Jackson Hole speech. Should Powell be dovish, then we'd expect a breakout for ETH back to $4,600. Should he be hawkish, then we likely see a retest of $3.970.
- Next Support: $4,170
- Next Resistance: $4,600
- Direction: Neutral/Bullish
- Upside Target: $4,770
- Downside Target: $3,970
SOL:
- SOL's Open Interest has pulled back substantially from the highs it put in when price moved into $200.
- The Funding Rate has also meaningfully reset with it now close to flat at 0.00%.
- The above suggests that some of the leverage has been flushed out and this is a healthier leverage setup for SOL.

Technical analysis
- SOL rejected into the underside of the uptrend line, and the horizontal level of $203.
- Price has since pulled back and found some support at the local horizontal support of $185, where price briefly bounced, before price pulled back again and broke below the key $185 level.
- The key supports below price now are at $172 and then $155, although we wouldn't become interested in adding to our Spot SOL until/if we saw $155 be touched.
- On this price pull back, the RSI has meaningfully reset and it's back in middle territory having put in a bearish divergence.
- If price can recover, the first signal of this will be a reclaim of $185. However, it's hard to be super bullish on SOL whilst it's lacking a narrative, and it remains below some significant technical levels - the $203 horizontal resistance.

Cryptonary's take
It remains difficult to become overly constructive on SOL with this chart structure, and perhaps the time we would become constructive again would be if SOL pulled back far enough that it then looks "cheap" again from a valuation perspective. That level would be $155.Until SOL retests $155, or we see a purposeful reclaim of $185, we’ll stay patient. Long-term support at $155 is where SOL would look attractive again.
- Next Support: $172
- Next Resistance: $185
- Direction: Neutral
- Upside Target: $203
- Downside Target: $155
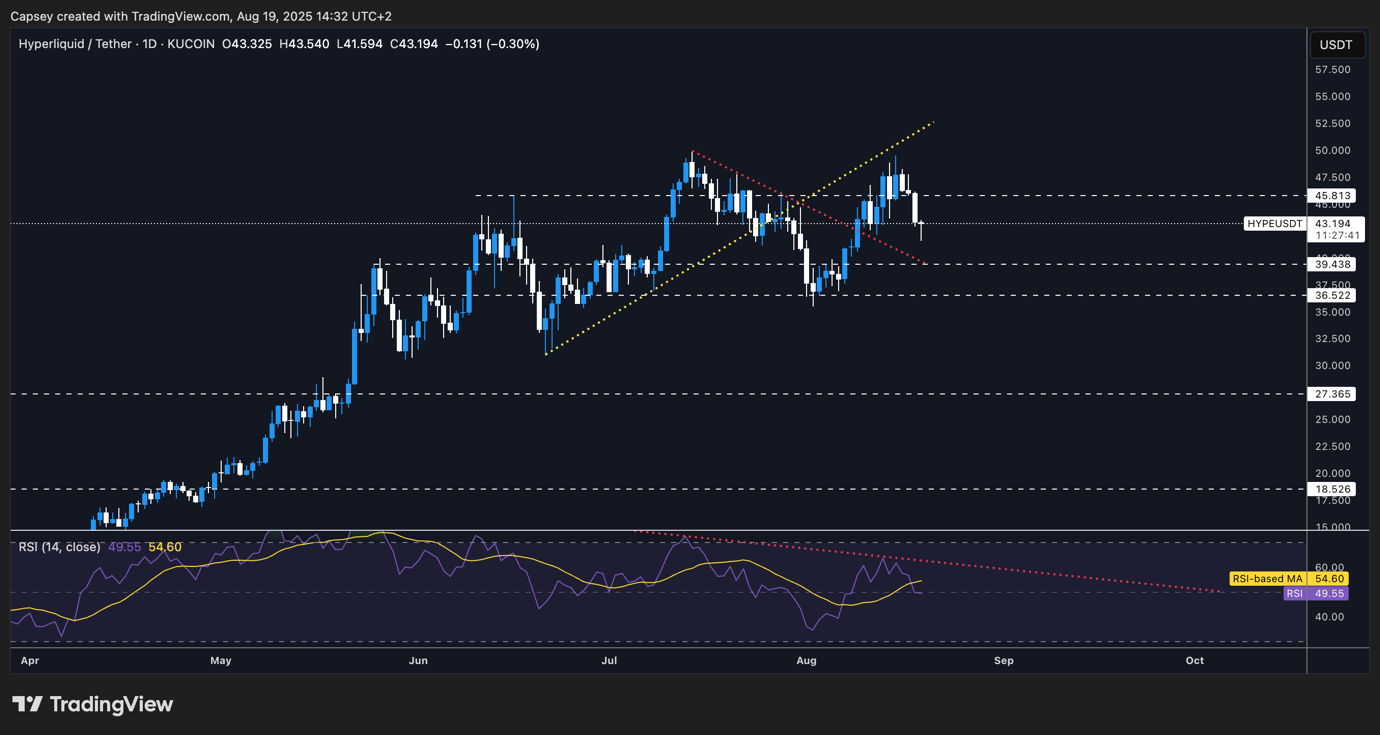
HYPE:
- HYPE struggled to consolidate above the key horizontal level of $45.80, which led to a more material breakdown with price having previously also rejected into the main uptrend line.
- Price pulled back and found support into the horizontal level of $42.00.
- Below $42.00, the main horizontal support is at $39.40. We expect this level to be a significant support for price and it's a level where we'd look to add HYPE at for the long-term.
- To the upside, the key horizontal resistances are at $45.80 and then $49.80 ($50.00). Should the price breakout of $50.00, then we'd expect a swift breakout move to $60.00.
- With HYPE consolidating now for several months in the $40's, this has allowed the RSI to meaningfully reset, putting it back to middle territory.
Technical analysis
- Should HYPE pull back to $39.40-$42.00, HYPE would potentially look the most attractive Major to bid from a valuation perspective. We expect prices to remain range-bound for this week between $39.40 and $45.80, until we get more clarity out of Jackson Hole on Friday. Therefore, should we see price pullback to the lower end of the range ($39.40-$42.00), then we'd look to add Spot HYPE for the long-term in this range with a view to holding the position for the next 6-12 months.
Cryptonary's take
Should HYPE pull back to $39.40-$42.00, HYPE would potentially look the most attractive Major to bid from a valuation perspective. We expect prices to remain range-bound for this week between $39.40 and $45.80, until we get more clarity out of Jackson Hole on Friday. Therefore, should we see price pullback to the lower end of the range ($39.40-$42.00), then we'd look to add Spot HYPE for the long-term in this range with a view to holding the position for the next 6-12 months.- Next Support: $42.00
- Next Resistance: $45.80
- Direction: Neutral
- Upside Target: $49.80
- Downside Target: $39.40
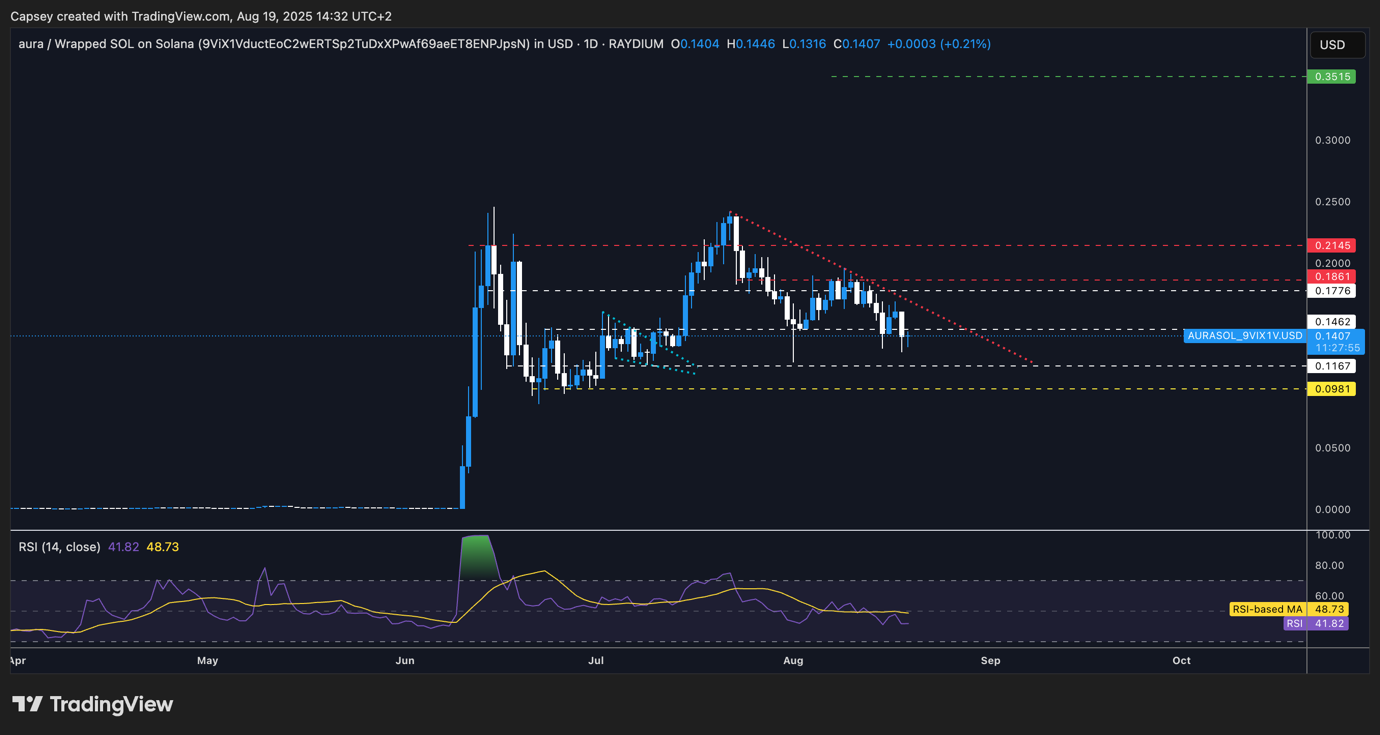
AURA:
- AURA broke out of the downtrend line and the $0.177 horizontal resistance.
- Unfortunately, price rejected into the next horizontal resistance at $0.186.
- Price has since pulled back and battled at the horizontal support of $0.145.
- Price is now in a strong demand zone between $0.116 and $0.145, where we can see many wicks showing that strong buying pressure comes in in this range.
- Price is also grinding perfectly into the downtrend line. Should we see a breakout of the downtrend line and the $0.145 level, that would likely take price swiftly back to $0.177-$0.186 range.
- Should price breach above $0.186, then that would set up a move into $0.215-$0.245. A breakout of this level would potentially take the price to $0.35-$0.40.
- The RSI has also meaningfully reset with now a bullish divergence forming (lower low in price, and a higher low on the oscillator). This is a bullish biased formation.
Technical analysis
- In terms of a pure trading chart structure, AURA is one of the best here, alongside ETH in its down trending wedge pattern.
- AURA is now in a strong demand zone between $0.116-$0.145, which we expect price to hold with strong buying pressure likely continuing to come in. Should we get this, which then could push a breakout of the downtrend line, we would likely get a breakout move into $0.177-$0.186 in the short-term. However, in the long-term, it's still our base case that AURA prices are substantially higher, well into the multi-Billion $ MCap range.
Cryptonary's take
In terms of a pure trading chart structure, AURA is one of the best here, alongside ETH in its down trending wedge pattern.AURA is now in a strong demand zone between $0.116-$0.145, which we expect price to hold with strong buying pressure likely continuing to come in. Should we get this, which then could push a breakout of the downtrend line, we would likely get a breakout move into $0.177-$0.186 in the short-term. However, in the long-term, it's still our base case that AURA prices are substantially higher, well into the multi-Billion $ MCap range.
- Next Support: $0.145
- Next Resistance: $0.186
- Direction: Neutral/Bullish
- Upside Target: $0.215
- Downside Target: $0.116
Closing thoughts:
We're expecting a choppy week as we move into Jackson Hole on Friday, where risk assets will be awaiting J Powell to give the dovish signal and therefore the green light for risk assets to go higher.Our expectation is that he'll be dovish and suggest he's open to cutting rates in September. We would then expect that commentary to stabilise risk assets which can then move higher, meaning that this week is likely a week for bidding.
Let's see what we get!
Recommended from Cryptonary


