Disclaimer: This analysis is for informational purposes only and not financial advice.
TLDR:
- BTC: Stuck in $107K–$112K range, descending wedge with bullish bias; support $106K, resistance $112.7K.
- ETH: Consolidating $3,970–$4,950; leverage reset; likely sideways before breakout.
- SOL: Stronger performer; reclaim $203 to target $222; key support $185.
- HYPE: Testing $45.8 resistance; eyeing $60; downside interest $36.5–$39.4.
- AURA: Holding lows, near breakout; target $0.177–$0.186; strong support $0.098–$0.116.
BTC:
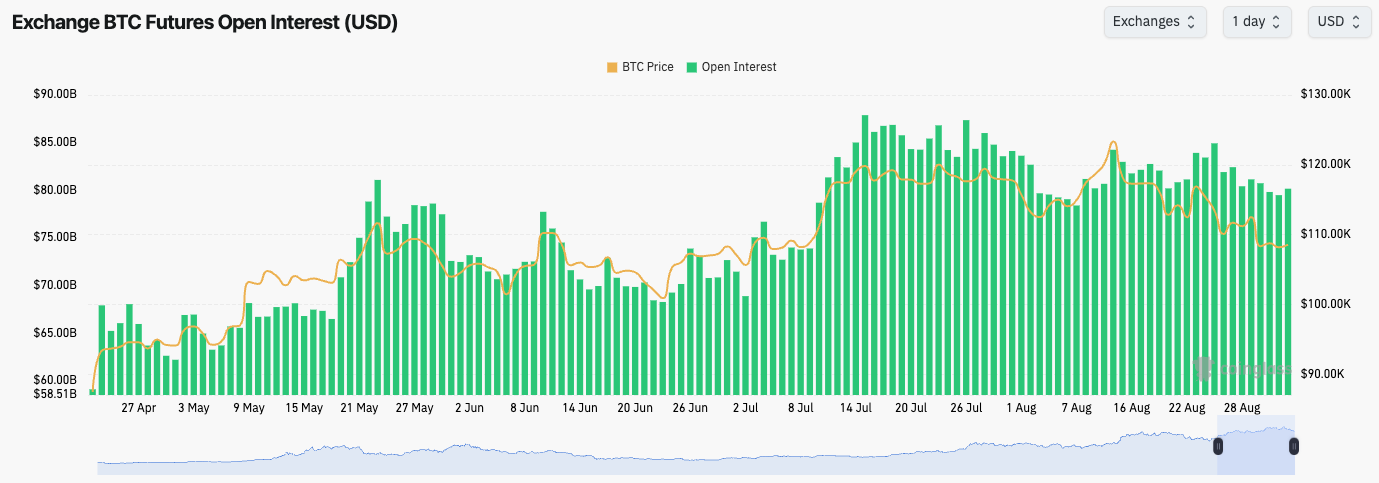
- As BTC has been range-bound between $107k-$112k its Open Interest has pulled back from its highs in a healthy manner.
- Open Interest does remain relatively high still, but it's not at alarming levels, and with the Funding Rate contained, there isn't an imminent threat of a leverage flush out.
BTC's Open Interest (by USD value):
Technical analysis
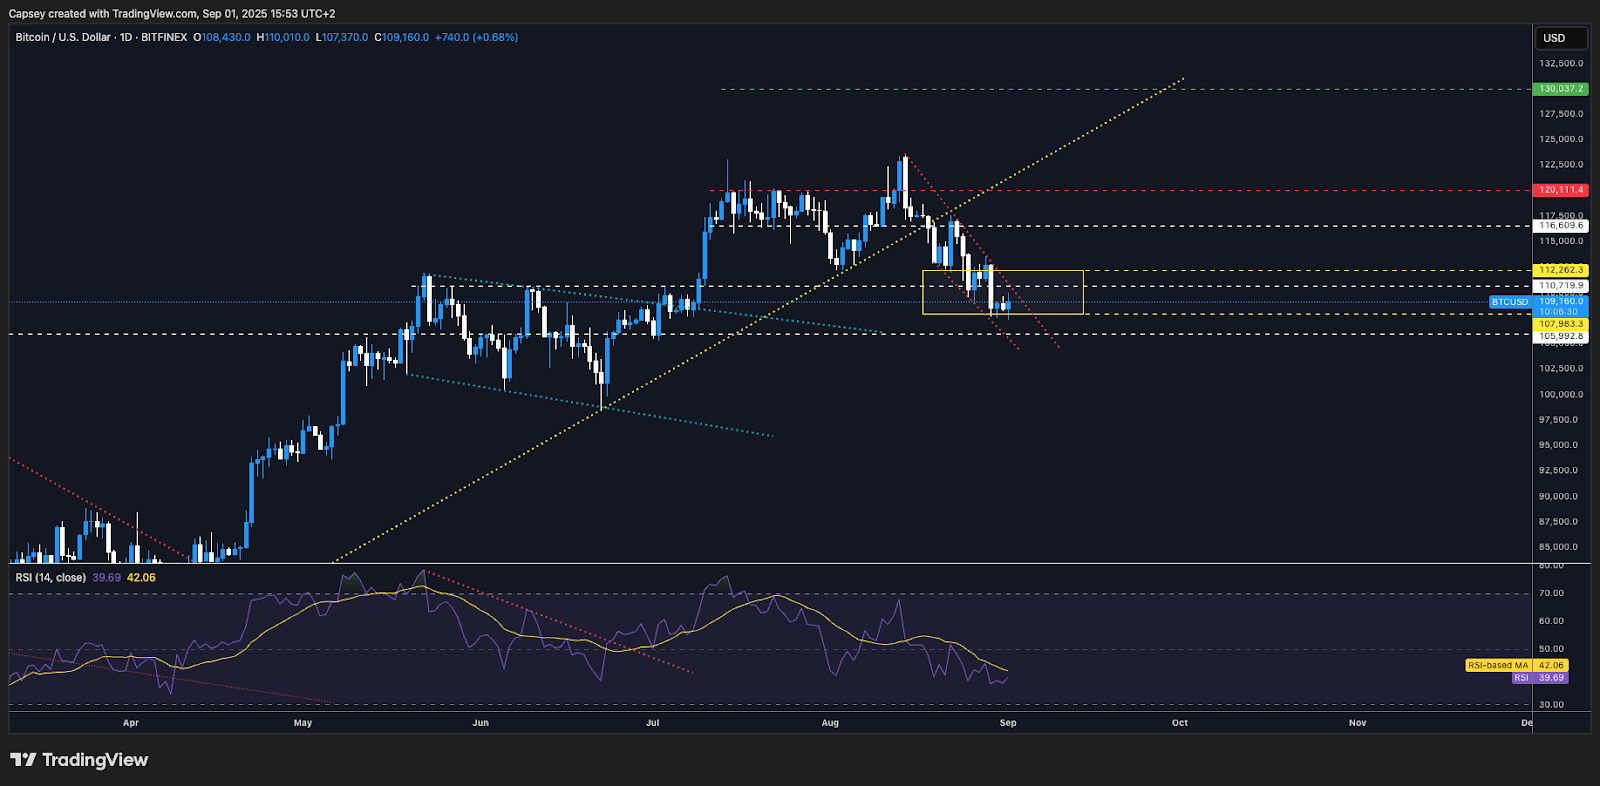
- BTC bounced from $109k back into the prior lows, and now the new local resistance at $112,700, however price rejected from $112,700 and price has since put in new lows in the $107k's.
- $107k is the Short-Term Holder Cost Basis level which has been a prior support in bull markets. But it also wouldn't be uncommon for price to fall below this level, however, if it did, it would be value territory.
- BTC is currently in a descending wedge pattern. This chart structure has a bullish breakout bias. A breakout of the wedge would likely see BTC retest at least $112,700, and possibly $116,600.
- To the upside, the key horizontal resistances for price now are at $112,700 and $116,600.
- To the downside, we expect $106k-$108k to be a strong zone of support.
- The RSI has meaningfully reset with it now being below its moving average and only just above oversold territory. This metric suggests that we might not be too far away from a bottom in terms of time length.
Cryptonary's take
BTC has pulled back to its old all-time highs and prior resistance range of $106k-$112k, whilst price is in a descending wedge pattern and pulling back into support. This is a bullish setup should we see a breakout of the wedge/downtrend line, however it is possible that BTC can pull back further first to the $106k-$107k range. Should BTC see pull backs south of its Short-Term Holder Cost basis at $107k, we'd be strong buyers of BTC at those value levels. It's our expectation that BTC can chop and consolidate for another 1-2 weeks as we move into the mid-September FED Meeting. However, as we move towards the end of the month and into Q4, we'd expect BTC to see a new bullish leg that breaks out of this wedge (in the next 1-2 weeks) and then potentially retests all-time highs towards month end.
- Next Support: $106,000
- Next Resistance: $112,700
- Direction: Neutral/Bullish
- Upside Target: $116,600
- Downside Target: $106,000
ETH:
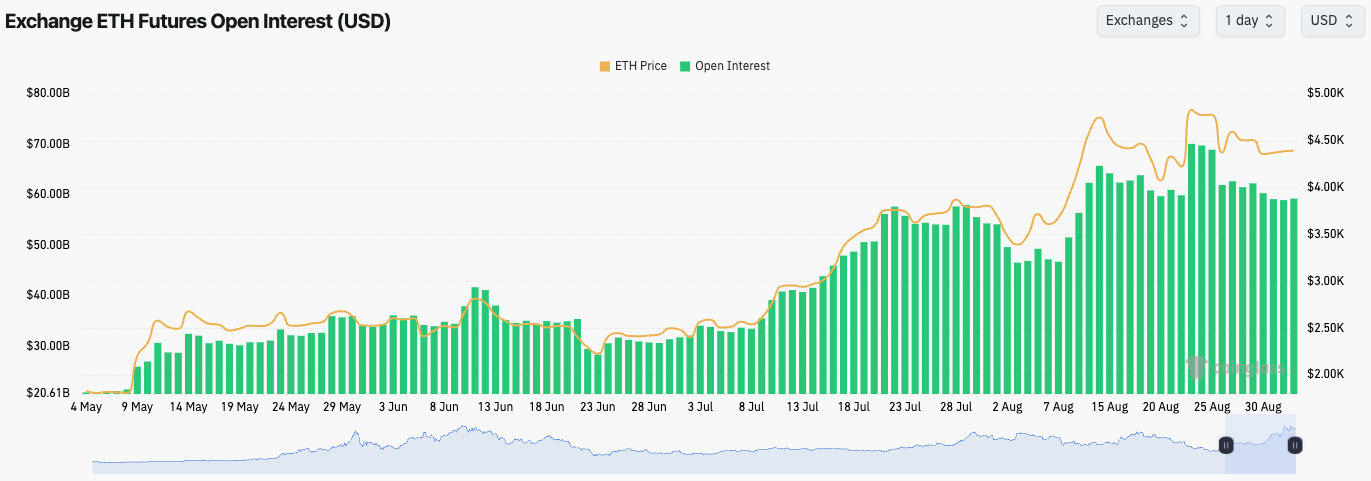
- ETH's Open Interest remains at elevated levels despite pulling back meaningfully from its all-time highs.
- ETH's Funding Rate has also reset with it now just north of 0.00%.
- The last week has seen a leverage reset for ETH, which needed to happen considering it was at frothy levels 1-2 weeks ago.
ETH's Open Interest (by USD value):
Technical analysis
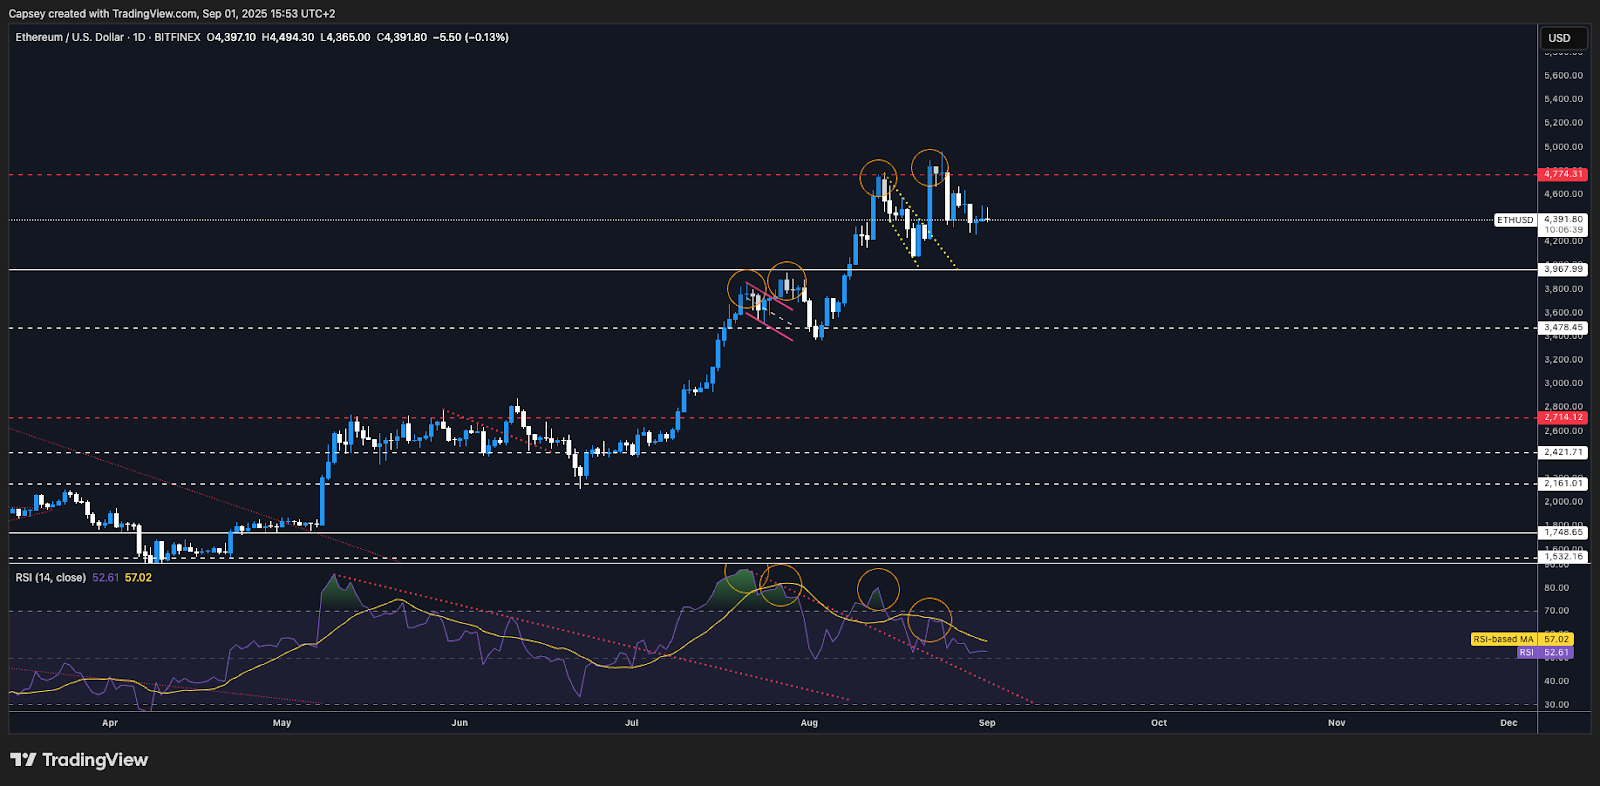
- ETH rejected into its all-time high and horizontal resistance area of $4,770-$4,950 after putting in multiple back-to-back bearish divergences (higher highs in price, lower highs on the oscillator).
- ETH has now pulled back to the mid-level of the range at $4,340, with the wider range being $3,970 (the major horizontal support) to $4,950 (the major horizontal resistance).
- Should price breakout of $4,950, then we'd expect the next target to be $5,500, although we don't expect a breakout to be imminent.
- The RSI is in middle territory and it's below its moving average, so it is possible that it continues lower.
- Whilst BTC is likely to remain choppy, ETH is also likely to remain range-bound between $3,970 and $4,950. We'd be buyers of the bottom of the range ($3,970), should price get there.
Cryptonary's take
Last week we saw positive ETF flows again which was supportive of ETH's price although it wasn't enough to sustain a breakout. However, whilst BTC is range-bound, it's likely ETH doesn't break out and remains range-bound itself. We'd look to buy ETH should it retest the bottom of its range at $3,970, with a view to selling it into $5,000-$5,500. Other than that, we wouldn't be too interested in ETH in the short-term as we expect it to now have a period of consolidation after it ran from $2,160 to $4,770 in just 7 weeks.
- Next Support: $3,970
- Next Resistance: $4,950
- Direction: Neutral
- Upside Target: $5,500
- Downside Target: $3,970
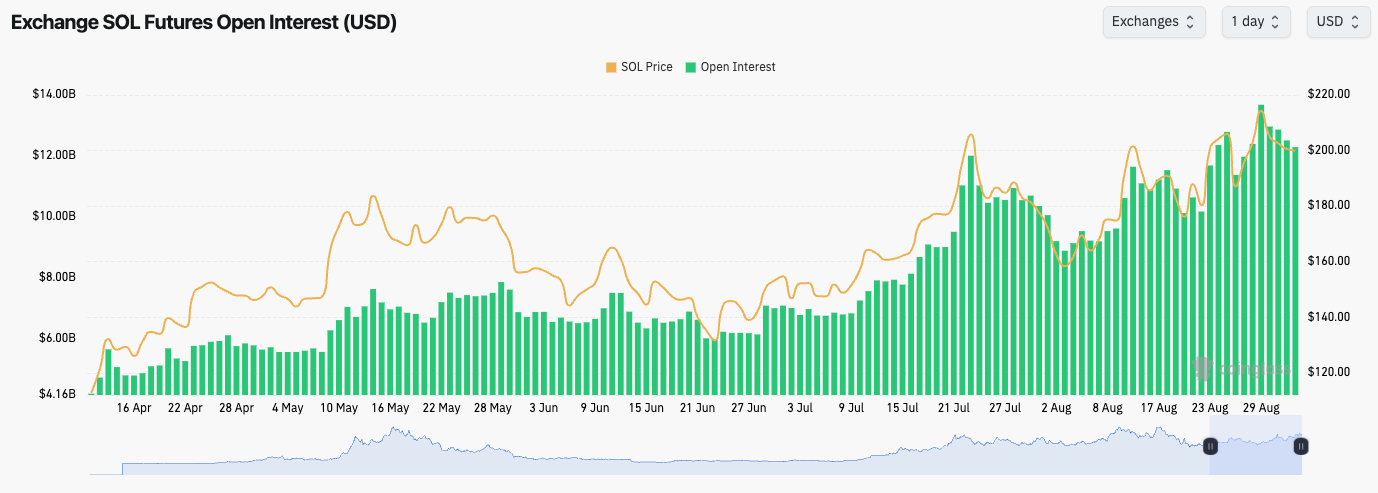
SOL:
- SOL's Open Interest has seen a more substantial pull back, particularly today, whilst its Funding Rate has remained relatively neutral throughout the price move higher.
- SOL's leverage setup is relatively healthy here with there being close to no signs of froth.
SOL's Open Interest (by USD value):
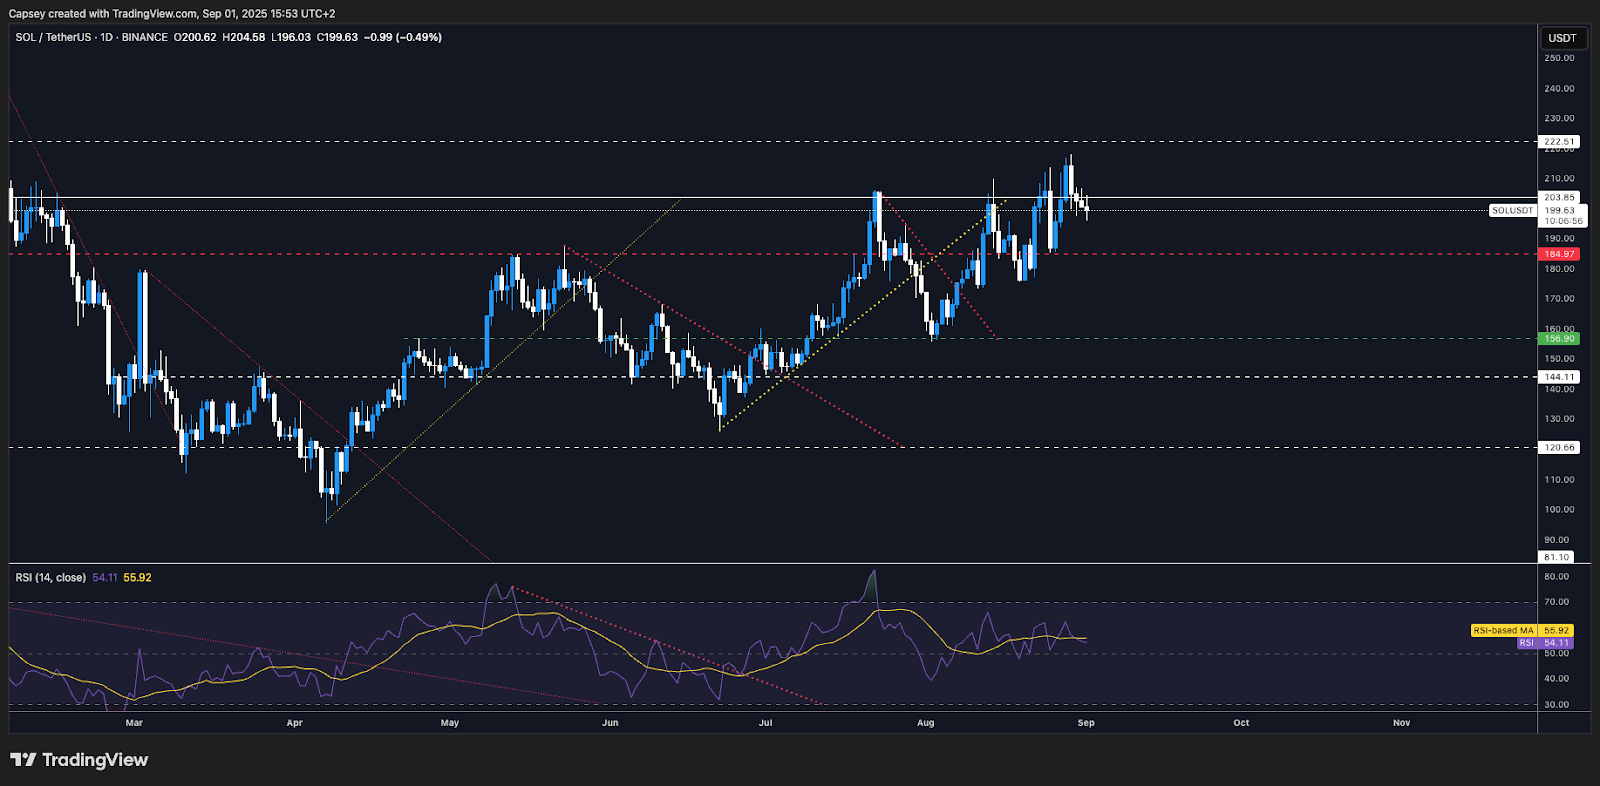
Technical analysis
- SOL bounced perfectly off its horizontal support of $185 before it made another attempt at breaking out of the major horizontal resistance of $203.
- SOL did manage to break out of $203, but price hasn't been able to sustain above it for now. Should price reclaim $203, then we'd expect a further move up again, and a test of the next horizontal resistance of $222.
- Beyond $222, the next major horizontal resistance is at $260. Should price clear $222, then there is relatively clear headroom up to $260 for SOL.
- Should SOL extend its break down here, then we'd be eyeing $185 to hold as support again, with $192 being a local support level.
- If the $185 level is lost, then the next levels are at $172 and $165.
- The RSI is in middle territory and it's above its flat at its moving average.
Cryptonary's take
SOL has held up at its highs well and it has looked relatively solid in comparison to the other Majors which have had more significant pull backs, although granted they did outperform to the upside in the initial move. SOL will likely follow the rest of the market here, but potentially outperform. For instance, should BTC and ETH both consolidate at their current levels, then SOL can reclaim $203 and look to push on to $222. However, should BTC and ETH pull back to $105k and $3,970 - not our base case, but we're certainly not ruling it out either - then SOL will likely pull back to $185. For now, we're patient in SOL Spot bags and we wouldn't look to add unless SOL were to see a more meaningful pull back. The zone we would look to get interested in again to add to SOL Spot would be between $165-$172.
- Next Support: $185
- Next Resistance: $203
- Direction: Bullish
- Upside Target: $222
- Downside Target: $172
HYPE:
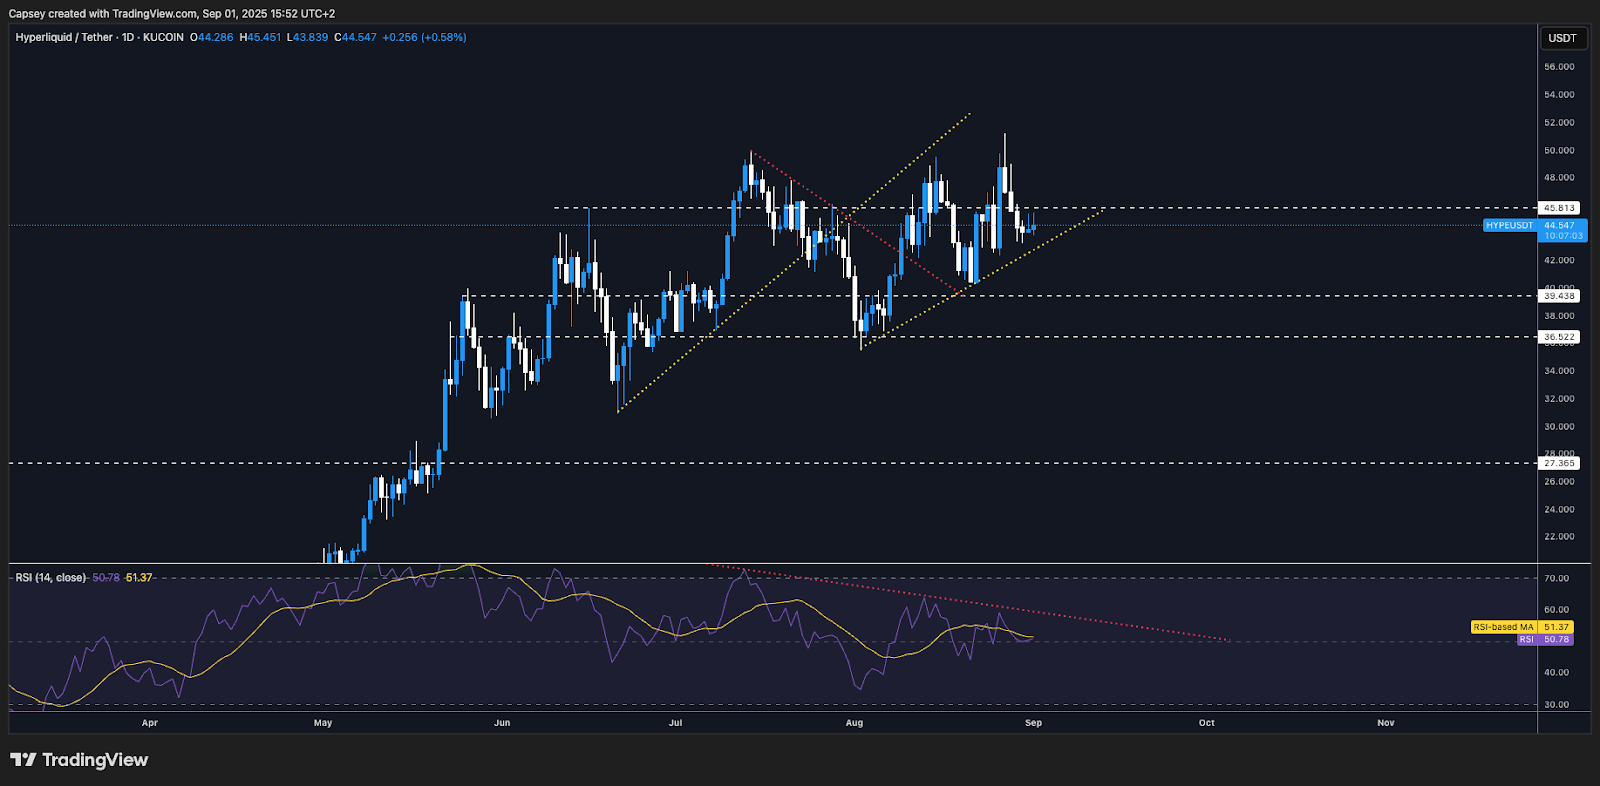
- HYPE was another Major that broke out of its all-time highs although it swiftly rejected, and price has since fallen back beneath the horizontal resistance.
- Price is now battling at the horizontal resistance of $45.50, having broken below $49.80.
- To the downside, the key horizontal support for price is now at $42.50, with the $36.50-$39.40 also being a key support zone for price should $42.50 be lost.
- Price is also in a local uptrend as it squeezes into the $45.80 horizontal resistance. This suggests that HYPE will meet a decision point soon, and we'll likely get a volatile move.
- The RSI is in middle territory with it butting up into its moving average whilst it remains in its overall downtrend.
HYPE's Open Interest (by USD value):
Technical analysis
- HYPE has held the mid-$40's level for several months now with the key resistance zone being $49.80-$50.00 and the key support being $36.50-$39.40. Like the rest of the market a decision point will likely come soon, and in our view, we expect that to be a breakout to the upside, that eventually see's price test $60.00.
- However, should we be wrong and price break down, we would add to our HYPE Spot bags between $36.50 and $39.40, although we're not expecting price to pull back this far, if it even pulls back at all. So, for now, we remain comfy in Spot positions, and we're eyeing a breakout to the upside.
Cryptonary's take
HYPE has held the mid-$40's level for several months now with the key resistance zone being $49.80-$50.00 and the key support being $36.50-$39.40. Like the rest of the market a decision point will likely come soon, and in our view, we expect that to be a breakout to the upside, that eventually see's price test $60.00. However, should we be wrong and price break down, we would add to our HYPE Spot bags between $36.50 and $39.40, although we're not expecting price to pull back this far, if it even pulls back at all. So, for now, we remain comfy in Spot positions, and we're eyeing a breakout to the upside.
- Next Support: $42.50
- Next Resistance: $49.80
- Direction: Bullish
- Upside Target: $60.00
- Downside Target: $39.40
AURA:
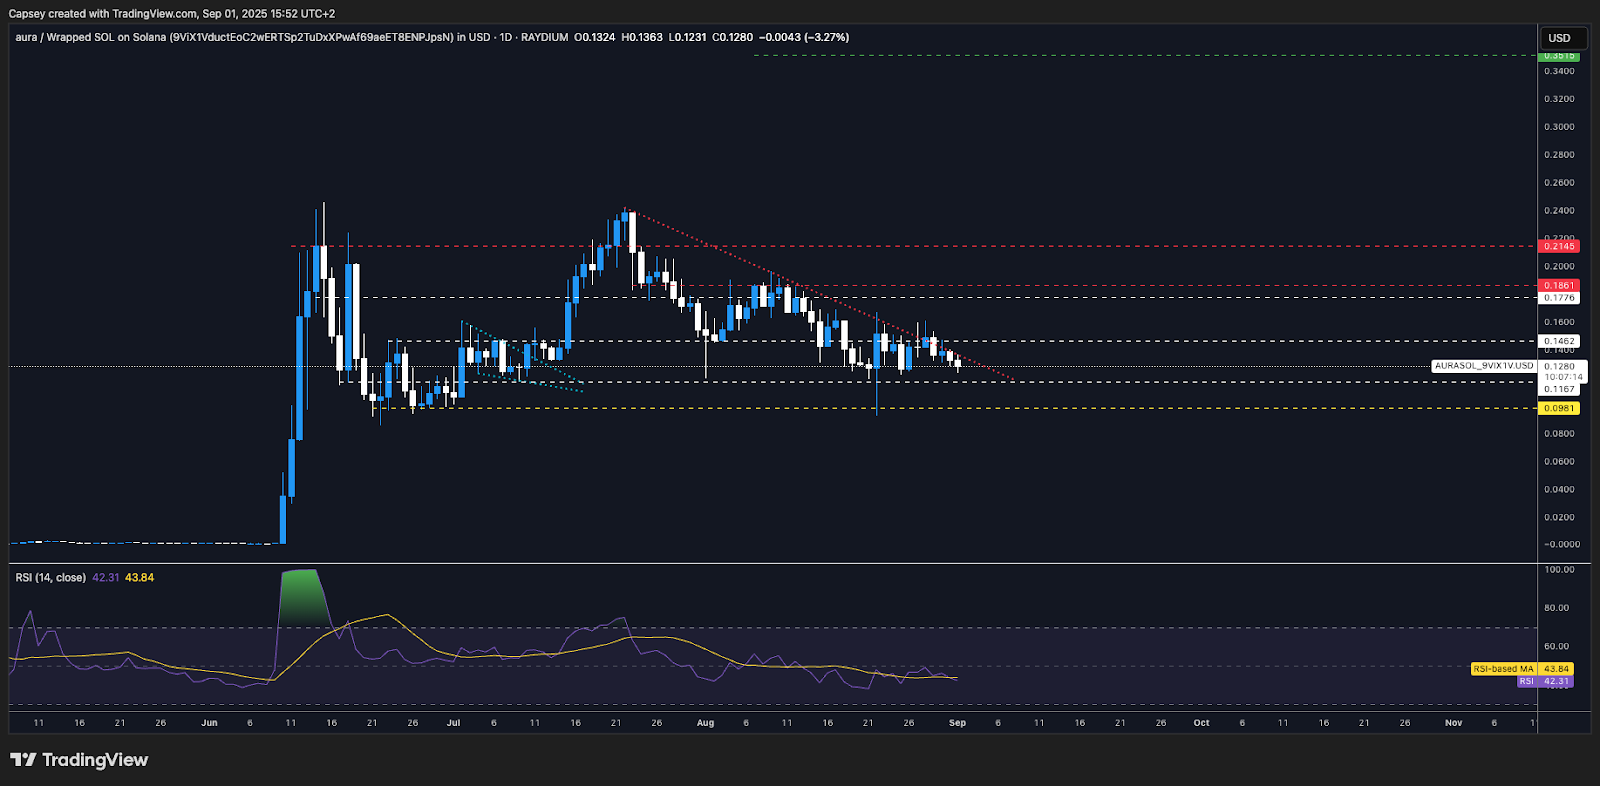
- Towards the back end of last week, AURA reclaimed the horizontal resistance of $0.145, which then led to a breakout attempt of the main downtrend line, however price was not able to breakout.
- Price has since returned to the main range area between $0.116 - $0.145, although price is still squeezed into the downtrend line.
- To the downside, should $0.116 be lost them we'd expect a retest of $0.098.
- However, should price breakout of the downtrend line, we'd expect $0.145 to be quickly reclaimed before price attempts to move up to the horizontal resistance zone between $0.177-$0.186.
- The RSI is in middle territory with it currently sat on its moving average.
AURA's Open Interest (by USD value):
Technical analysis
- AURA, like many other SOL memes, has struggled for performance in recent weeks. The positive for AURA is that it has held its lows very well whilst maintaining its range between $0.116-$0.145, with it still forming a bullish chart structure - price squeezing into the downtrend line.
- It's possible that SOL memes continue to struggle until we see Interest Rates get cut and a FED that forward guides to more cuts in the future. It may therefore take more time for AURA to break out. This potentially opens the door for a move into $0.098-$0.116, although we expect this to be strong support where we have previously seen AURA be bought up.
- It is still our view that AURA reclaims $0.177-$0.186 upon a downtrend line break out, which can then help price to target its all-time highs.
Cryptonary's take
AURA, like many other SOL memes, has struggled for performance in recent weeks. The positive for AURA is that it has held its lows very well whilst maintaining its range between $0.116-$0.145, with it still forming a bullish chart structure - price squeezing into the downtrend line. It's possible that SOL memes continue to struggle until we see Interest Rates get cut and a FED that forward guides to more cuts in the future. It may therefore take more time for AURA to break out. This potentially opens the door for a move into $0.098-$0.116, although we expect this to be strong support where we have previously seen AURA be bought up. It is still our view that AURA reclaims $0.177-$0.186 upon a downtrend line break out, which can then help price to target its all-time highs.
- Next Support: $0.098-$0.116
- Next Resistance: $0.177-$0.186
- Direction: Neutral
- Upside Target: $0.186
- Downside Target: $0.098
Closing Thoughts: