Save 23% ($351) & Get a Free 1-1 Call with our Team ⏰ : 0d 2h 59m 44s

TLDR:
- BTC: Broke key support and uptrend; targeting $95.7k-$98.9k. Bearish outlook.
- ETH: Holding $2,420 support within range; neutral but relatively stronger.
- SOL: Lost $162 support; likely heading toward $130-$120 zone.
- HYPE: Bear flag forming; downside target $28, possibly $23.70.
BTC:
- Bitcoin's Open Interest has pulled back from its highs as the price has pulled back.
- BTC's Funding Rate was towards the 0.01% mark, but upon the OI pullback, the Funding Rate has moved closer to 0.00%.
- This is a relatively healthy setup from a mechanics perspective ,with no signs of froth or excess.

Technical analysis
- Bitcoin has fallen out of its main uptrend line, with price also losing the horizontal level of $106,900.
- There is a support zone between $102,500 and $105,000. Price has so far found support in this zone.
- If price breaks below $102,500, then the next zone of support is likely to be between $95,700 and $98,900.
- To the upside, the key level for BTC to reclaim is $106,900, and then beyond that, it's the all-time high of $111,900.
- BTC does look to be forming a 'Head & Shoulders' pattern (which we have marked out on the chart). These formations have a bearish bias, with the likely breakdown target being at least $98,900.
- This price pullback has allowed the RSI to reset, pulling back to middle territory from having been close to overbought.

- Next Support: $102,500
- Next Resistance: $106,900
- Direction: Bearish
- Upside Target: $106,900
- Downside Target: $95,700
Cryptonary's take
BTC is at a critical juncture here. Price has broken below its main uptrend line and it's now below its first major line of support, whilst it's now forming a bearish candle formation. It's possible that $103k is the extent of the pullback however, our expectation is that there's much further to go here, with the first major pullback target area being between $95,700 and $98,900.For now, we're remaining patient as our expectation is that we'll see the price move lower in the coming 1-2 weeks, with the mid-90k's being that target area. At that time, we'll reassess the data to see if we'll begin re-accumulating BTC again in the mid-90k's.
What's next?
ETH, SOL, and HYPE are all sitting on make-or-break levels. We’ve mapped the exact price zones where we’ll go long—and where we'll short hard if support gives way. High-probability moves are coming in the next 72 hours.
ETH:
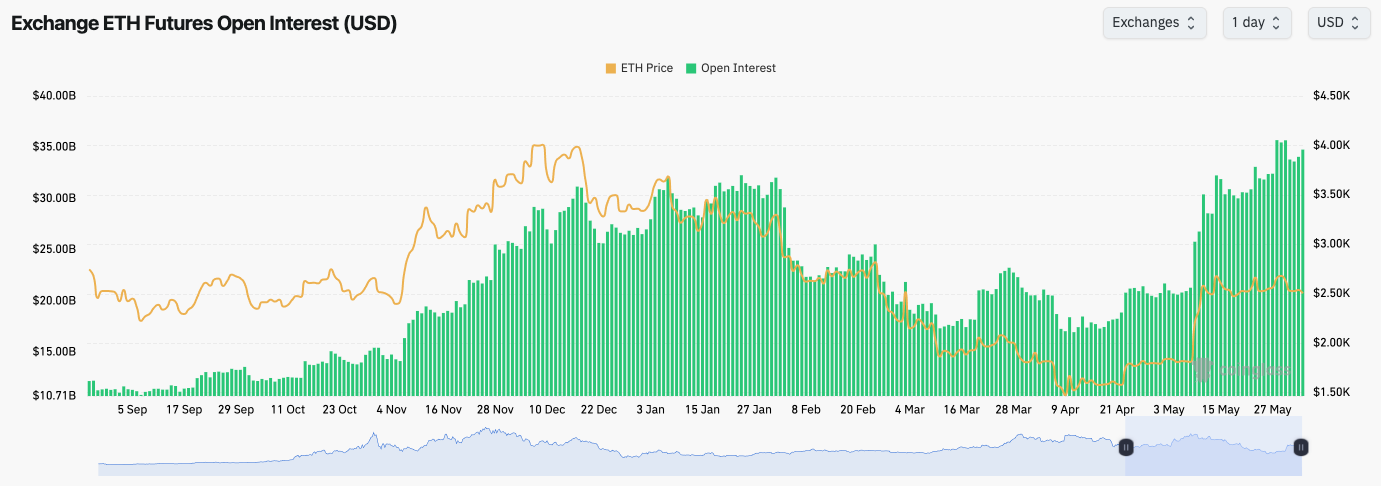
- ETH's Open Interest still remains incredibly high, and it's increased as price has remained range-bound.
- ETH's Funding Rate has pulled back from 0.01%, but it's still positive, which suggests that there is a relatively even balance between Longs and Shorts.
Technical analysis
- Price has rejected through the upper bound of the range at the $2,720 horizontal resistance.
- Price has been range-bound over the last few weeks between the horizontal support at $2,420 and the horizontal resistance at $2,720.
- Price is now at the horizontal support (of $2,420) with the RSI having meaningfully reset back to neutral territory, which is healthy to see.
- If $2,720 can be broken to the upside, then $3,050 is the next major horizontal resistance.
- If $2,420 (the horizontal support) is lost, then $2,160 is the next level on the cards.

- Next Support: $2,420
- Next Resistance: $2,720
- Direction: Neutral
- Upside Target: $2,720
- Downside Target: $2,160
Cryptonary's take
We've had a monster rally across the board on all assets, so it wouldn't be bad to see a slight pullback or a period of consolidation, which is what we expect to see over the coming 1-2 weeks.BTC and SOL have both broken below their main uptrend lines, and they're balancing on key supports. ETH, on the other hand, is holding a key range, and granted it is at its main support of $2,420, but from a charting perspective, it does look better than the other Majors - if you're going to bet on upside. But as we said, we are expecting 1-2 weeks of pullback or chop, and therefore it might be hard for ETH to rally strongly in that environment. For now, we're watching the key level of $2,420 for ETH. We may consider longer-term Spot positions for ETH should it revisit $2,160.
SOL:
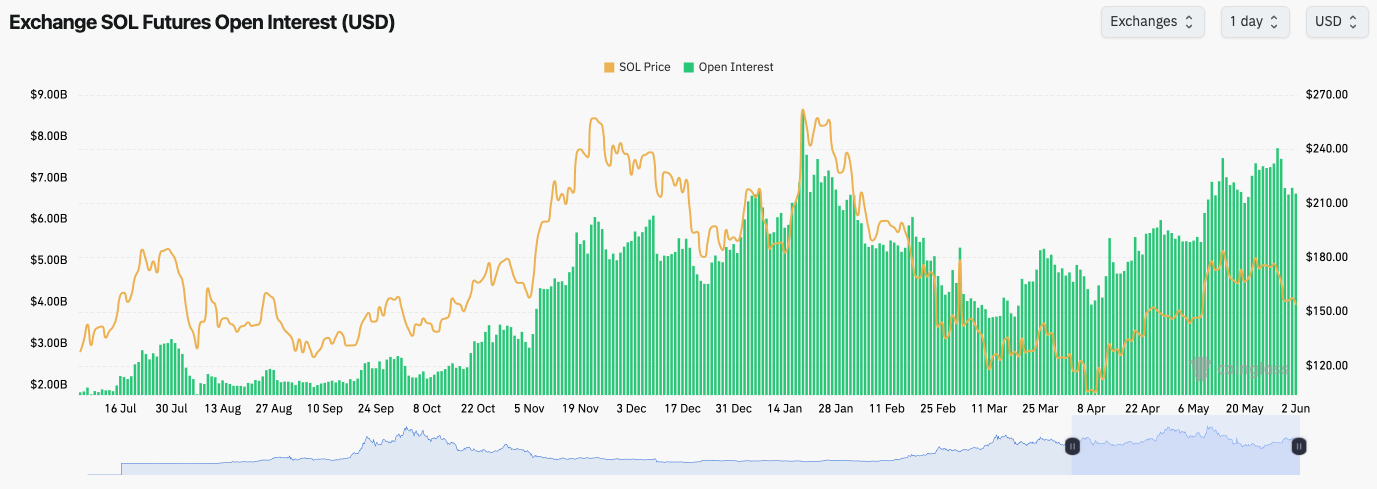
- SOL's Open Interest has pulled back slightly over the last few days following the price pullback, with Funding Rates holding close to neutral, but whipsawing.
- Ultimately, this shows indecision amongst traders.
Technical analysis
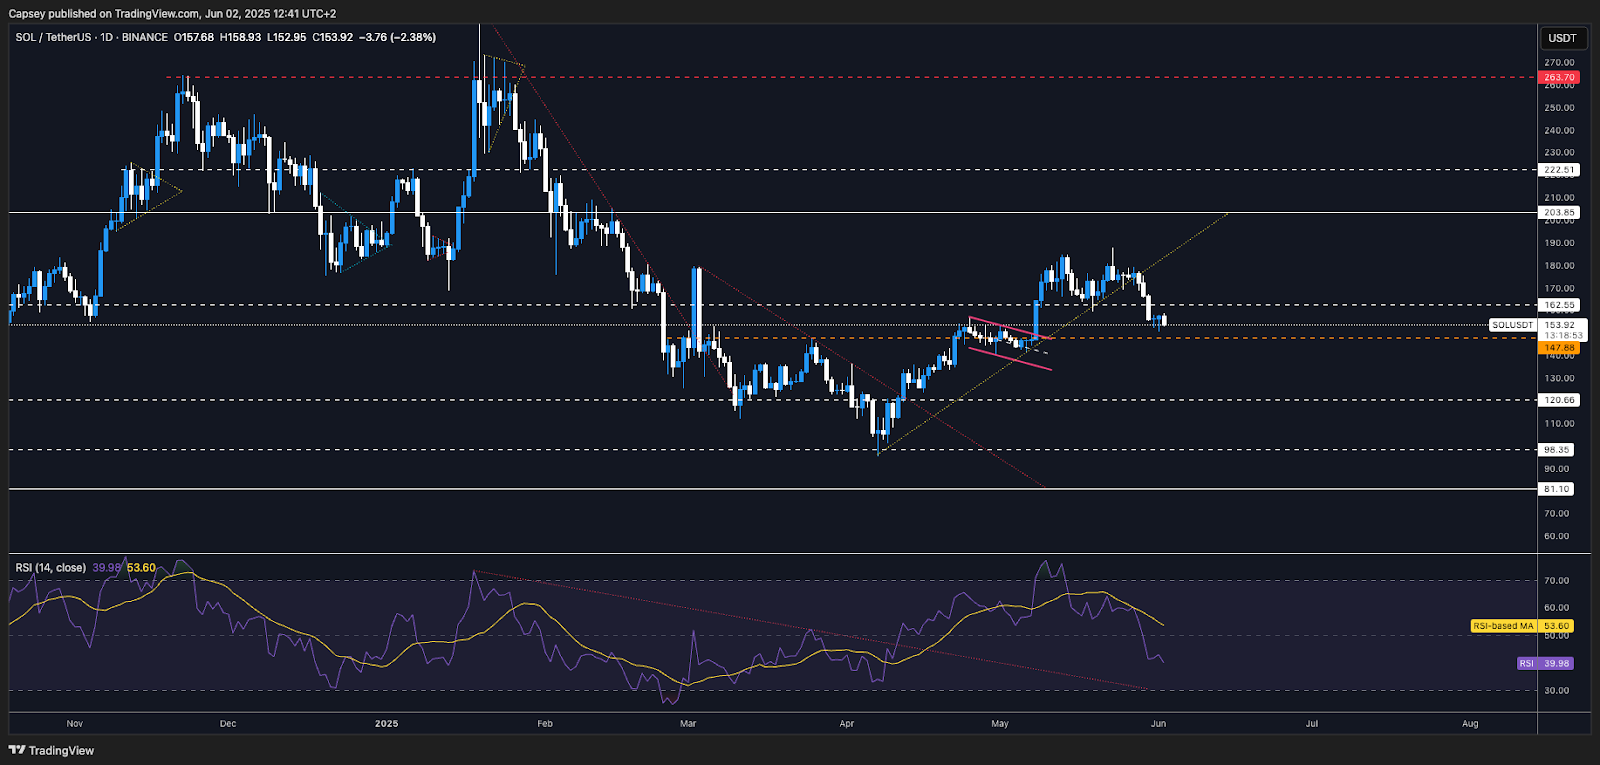
- SOL broke below its horizontal support of $162 as we expected it would do, following the loss of its main uptrend line.
- Price is now holding at the prior highs at the $150 level, whilst there is also a main horizontal support just below $150 and $147.
- If price were to lose to the horizontal level at $147, then price would likely pull back to the $120 to $130 zone. If this were to happen, we would consider buying SOL for the long run in that range ($120 to $130).
- It's possible in the immediate term that SOL bounces and retests $162 as a new horizontal resistance. We expect the price to reject there in the short term, and pull back further.
- If price can break above $162, though (as we said, we don't expect it to), then $180 is the next horizontal resistance.
- The RSI has meaningfully reset on this pullback, and it's now in middle territory, so not overbought or oversold.
- Next Support: $147
- Next Resistance: $162
- Direction: Neutral/Bearish
- Upside Target: $180
- Downside Target: $130
Cryptonary's take
SOL has pulled back more substantially, as we expected it would, following the breakdown of the main uptrend line. SOL is now in a critical zone between $147 and $162, where price will need to show strength if a general uptrend is to be continued. We expect that the price may chop for a few days (potentially even retesting the underside of the horizontal resistance at $162) before breaking below the horizontal support of $147, and moving back down to $130.In terms of our positioning, we'll remain sat in USD for now, although a retest of $120 to $130 would likely encourage us to begin lightly stepping back in (buying). But for now, we're patient and we see little reason needed to rush in here.
HYPE:
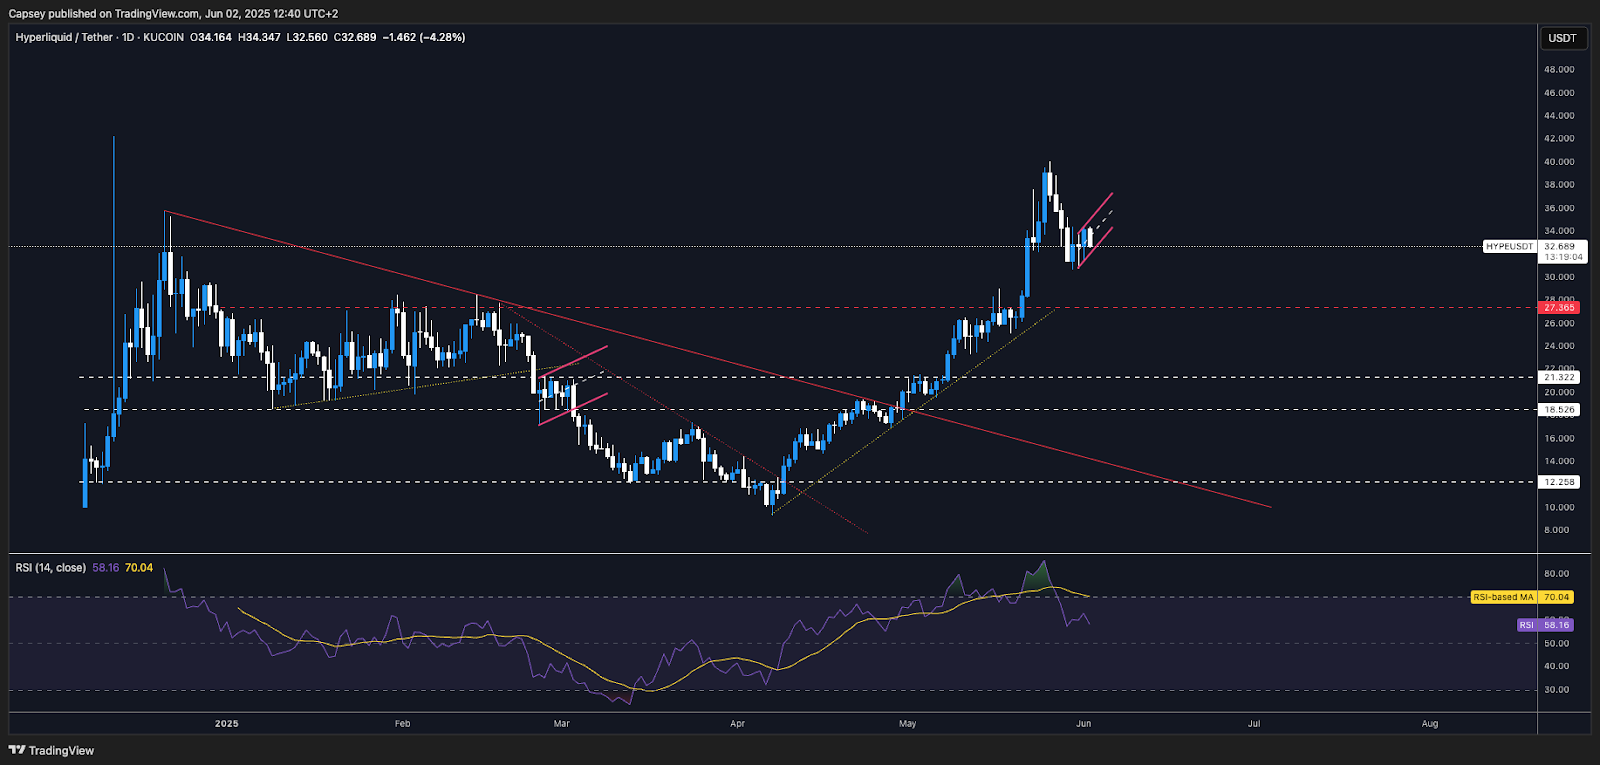
- HYPE has pulled back from the all-time highs of $40.00. $40.00 remains the major horizontal resistance for the price going forward.
- Price has now found some local support at the prior highs of $31.00.
- Price is now forming a bear flag that would have a breakdown target of $28.00.
- Should price break below $28.00, although we think it can hold there initially, then $24.70 would be the next major horizontal support.
- The RSI has pulled back from overbought territory, however, its moving average is still overbought, which would suggest that this needs more time to come down/reset.
- Next Support: $28.00
- Next Resistance: $40.00
- Direction: Bearish
- Upside Target: $40.00
- Downside Target: $23.70
Cryptonary's take
HYPE has had a phenomenal run, however, we have now seen a small pullback, and we do expect this to be the start of a new downtrend over the medium term for HYPE. Our expectation is that HYPE will break down from its bear flag pattern and the price will revisit $28.00 in the short term. Ideally, we'd like to see HYPE hold that $28.00 support and build a floor for the price there. We will reassess this, assuming we're right and price revisits $28.00 in the short term.In terms of positioning, we're remaining patient, and we're not looking to buy this price pullback just yet. We'll reassess upon a retest of $28.00, although it's likely that our buying zone will be sub $23.
Disclaimer: This is not financial or investment advice. You are responsible for any capital-related decisions you make, and only you are accountable for the results.
Recommended from Cryptonary


