Save 23% ($351) & Get a Free 1-1 Call with our Team ⏰ : 0d 2h 59m 43s
Disclaimer: This is not financial or investment advice. You are responsible for any capital-related decisions you make, and only you are accountable for the results.
BTC:
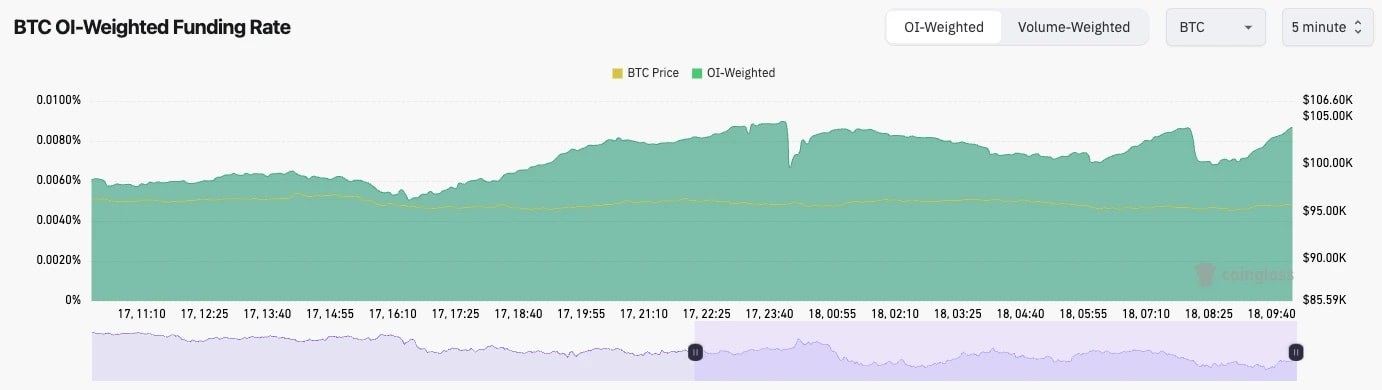
- Bitcoin's Open Interest has generally downtrended since mid-December, however, it has risen 6% from the lows in late January.
- The Funding Rate has remained positive and fluctuated between 0.004% and 0.01%. This suggests some indecision amongst traders, but still with a slight bias towards Longs.
- Overall, this is a more healthy leverage environment.
Technical analysis
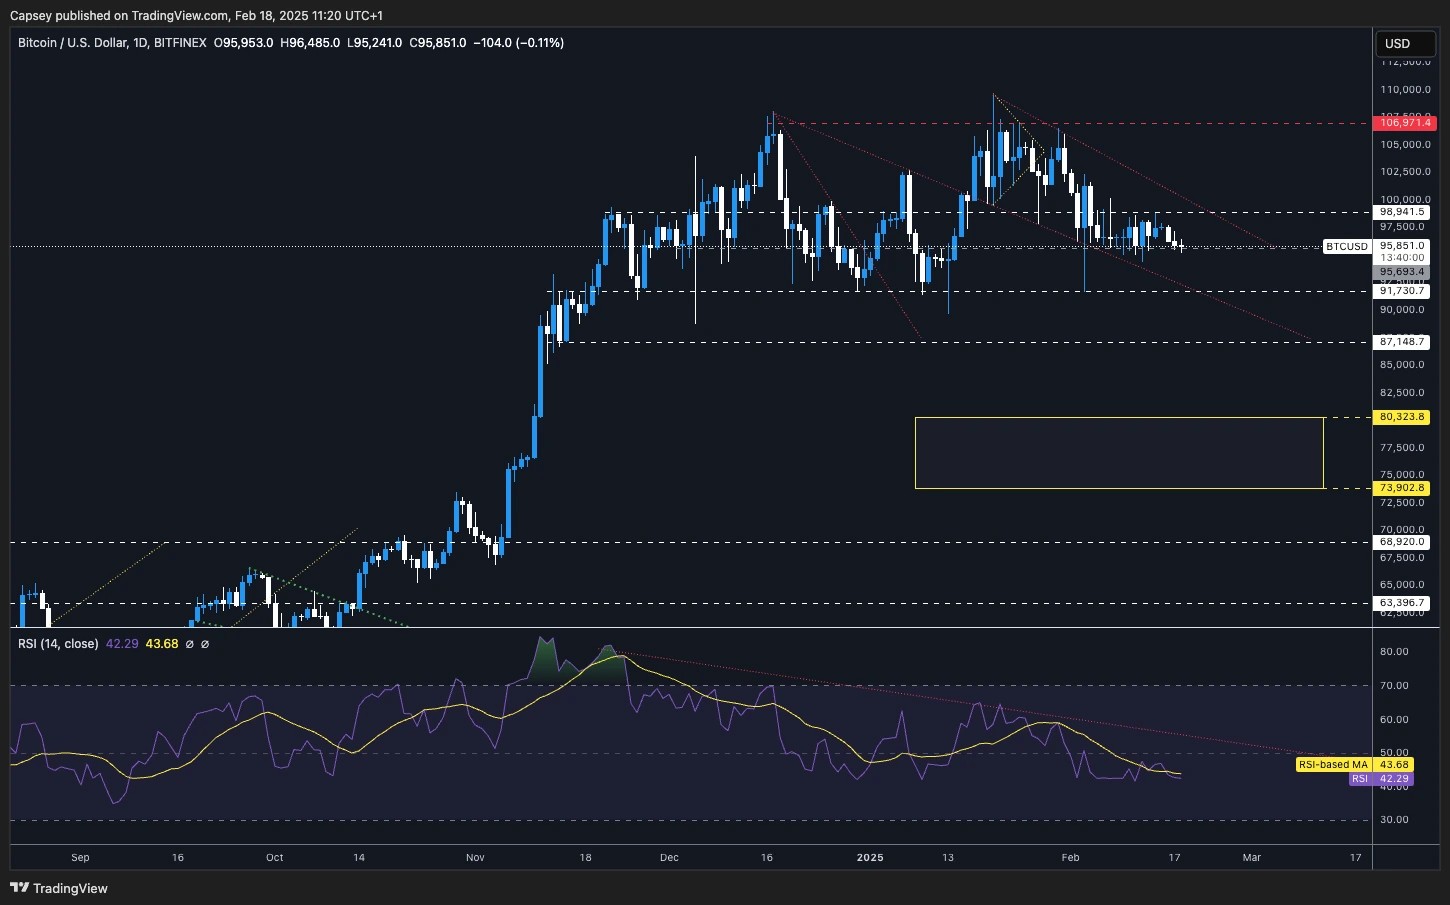
- BTC has remained in a really tight range between its local support of $95,600 and its local resistance of $98,900.
- Beyond $98,900, the $100k level should act as a tricky psychological level, whilst the main horizontal resistance is at $106,900.
- To the downside, we expect $91,700 to act as key support as this also closely matches the short-term holder cost basis price ($92k).
- Sub $91,700, and the key levels are $87,100 and $80,300.
- The RSI is in relatively middle territory, so it has a downside if the price wants to go lower. The RSI is also beneath its moving average and finding that to be resistance currently.
- Next Support: $95,600
- Next Resistance: $98,900
- Direction: Bearish
- Upside Target: $98,900
- Downside Target: $91,700
Cryptonary's take
Bitcoin has been in this tight range now since early February. We are expecting a break at some point soon, and we're expecting this to be to the downside. For now, we remain risk-off, however, we will look to lightly add to our long-term BTC bags between $87k and $91k. Whilst we'll more aggressively add between $80k and $87k.ETH:
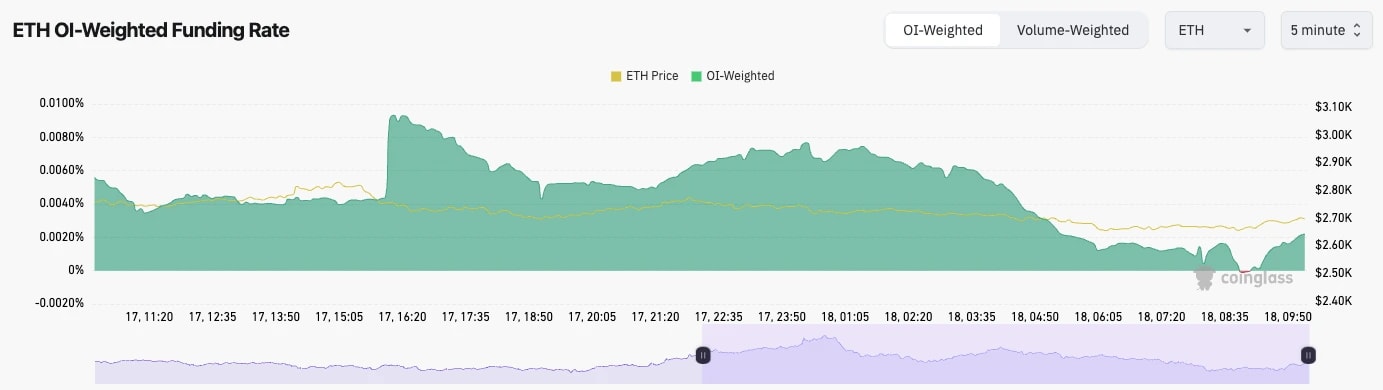
- ETH's Open Interest pulled back substantially on the price puke out in early February. Open Interest then bottomed off and has started rising again.
- ETH's Funding Rate isn't negative, but it is only just positive. This suggests that a fair portion of the open interest that has been recently added is in Shorts.
Technical analysis
- ETH has been range-bound at the new lows between $2,500 and $2,900.
- The horizontal resistance is at $2,875. We would need to see this level flipped and reclaimed in order to flip bullish again. However, just beyond this level, $3,050 is also a large resistance. So ETH has two big resistances within just a 10% move higher for price.
- Currently, there is local support at $2,700, but the main horizontal support is at $2,420.
- The RSI is the most positive aspect of ETH. It's broken out of its downtrend line, and it's also now nicely above its moving average.
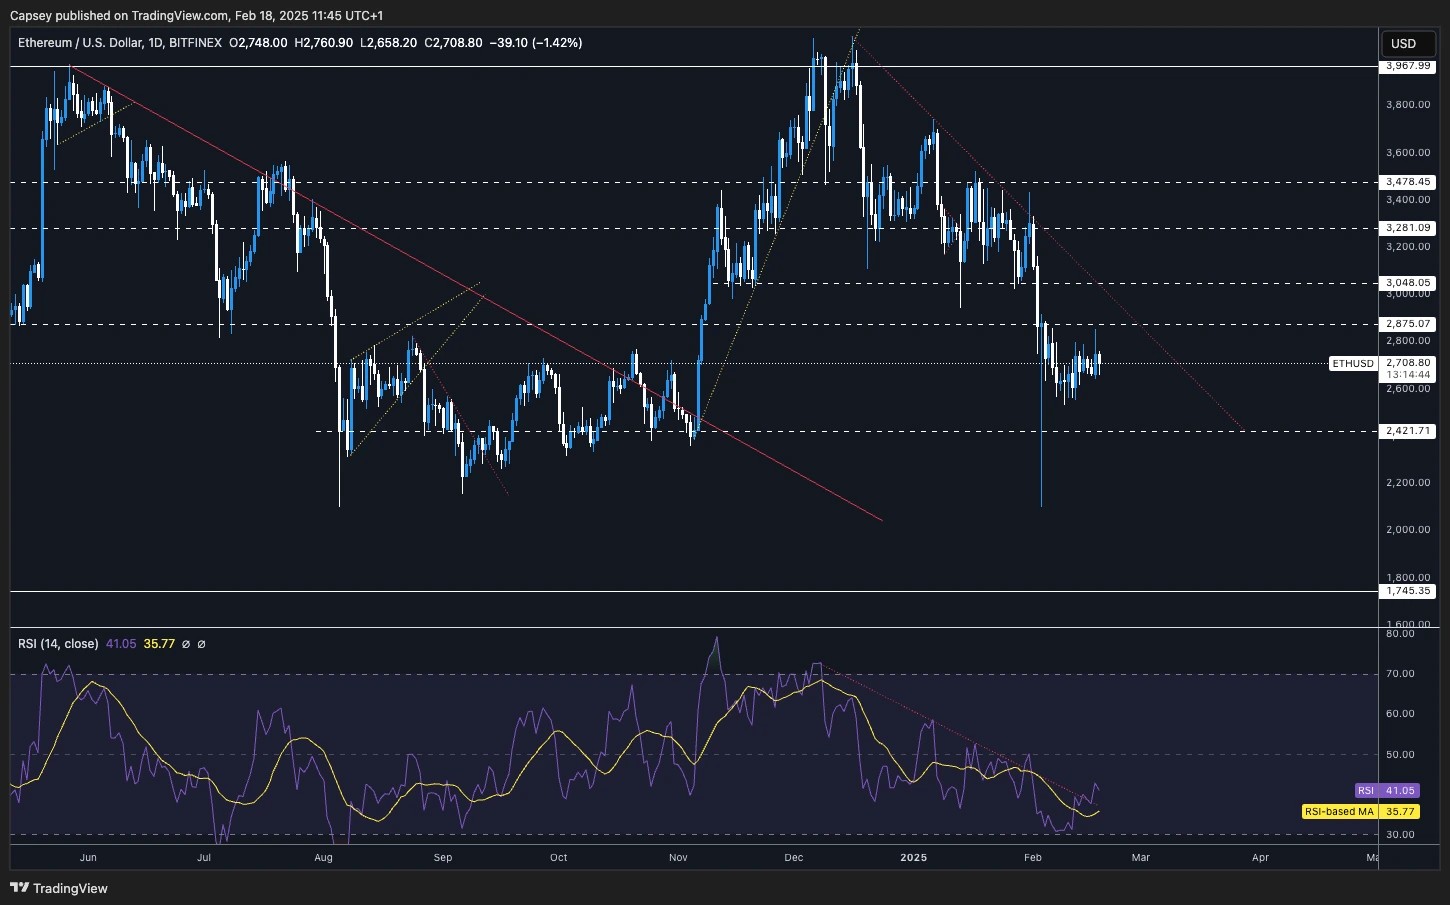
- Next Support: $2,500
- Next Resistance: $2,875
- Direction: Neutral/Bearish
- Upside Target: $2,875
- Downside Target: $2,420
Cryptonary's take
It's hard to get bullish on ETH here. We're now just generally used to lacking performance, and then when you look at the chart, ETH is below two heavy horizontal resistances; $2,875 and $3,050.For now, we'd just remain patient with ETH, and whilst we still don't see the macro as majorly supportive, this would suggest to us that ETH can revisit the $2,420 area as a minimum in the coming weeks/months.
SOL:
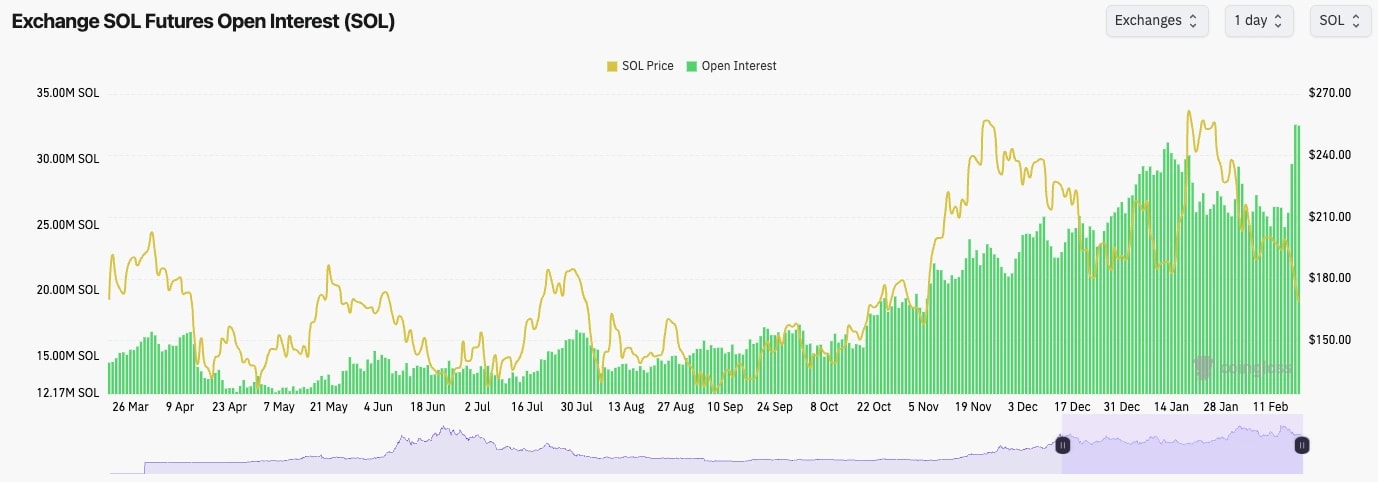
- SOL's Open Interest has gone from 24m SOL to now 32m SOL, as the price has gone from $200 down to $165.
- SOL's Funding Rate has fluctuated between negative and positive.
- Overall, this may need more reset, and this will likely be a time capitulation/reset rather than a price reset.
Technical analysis
- SOL broke out from its main downtrend line, but it couldn't reclaim the horizontal level of $203. The price was then rejected from there and the price immediately moved down to the next horizontal support at $165. This is a good example of how crucial key horizontal levels can be for price.
- The price is now at the next horizontal support of $162.
- Beneath the current support, we have $145 and $120 as the next two key levels to the downside.
- The RSI on the Daily and on smaller timeframes is now in oversold territory, whilst it's also well below its moving average.
- To the upside, $188 is likely to be the next local resistance.
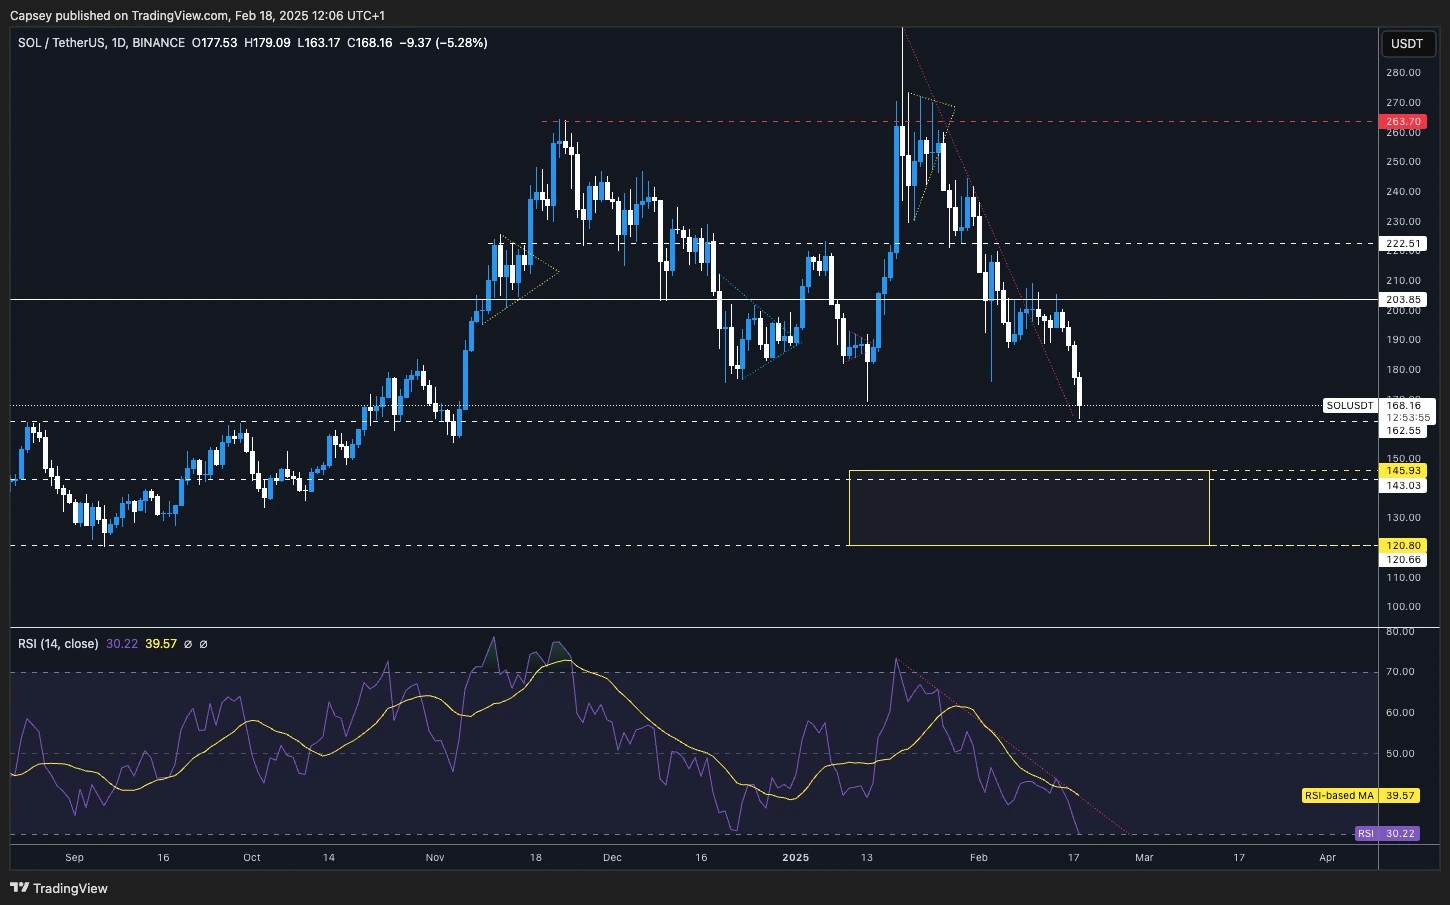
- Next Support: $162
- Next Resistance: $188
- Direction: Neutral
- Upside Target: $188 (maybe $203)
- Downside Target: $145
Cryptonary's take
If BTC doesn't break down here, then SOL might be due for a small bounce in the short term. We're at a key horizontal support, with the indicators being quite oversold. However, we wouldn't expect $188 to say $203 to be flipped. It's possible we get into that zone, but we don't expect the price to reclaim $203 and move higher from there in the short term.HYPE:
- HYPE attempted to break out of the large pennant pattern, but it was unfortunately sold at the high of $ 28.
- Price is now back in the pennant, and it's moving down to the horizontal support zone between $20 and $22.
- If the key support of $20 is lost, then this opens the door for the $14 to $16 area to be tested.
- The RSI is in the middle territory, but it's also just below the moving average. If the price wants downside, there's the downside to be had here. You'd feel more comfortable seeing the RSI already oversold, but it's just nowhere near.
- To the upside, the key level for the price to get above is $28. If this level can be flipped, then new all-time highs will be likely. However, we're not confident that this will happen in the short term.
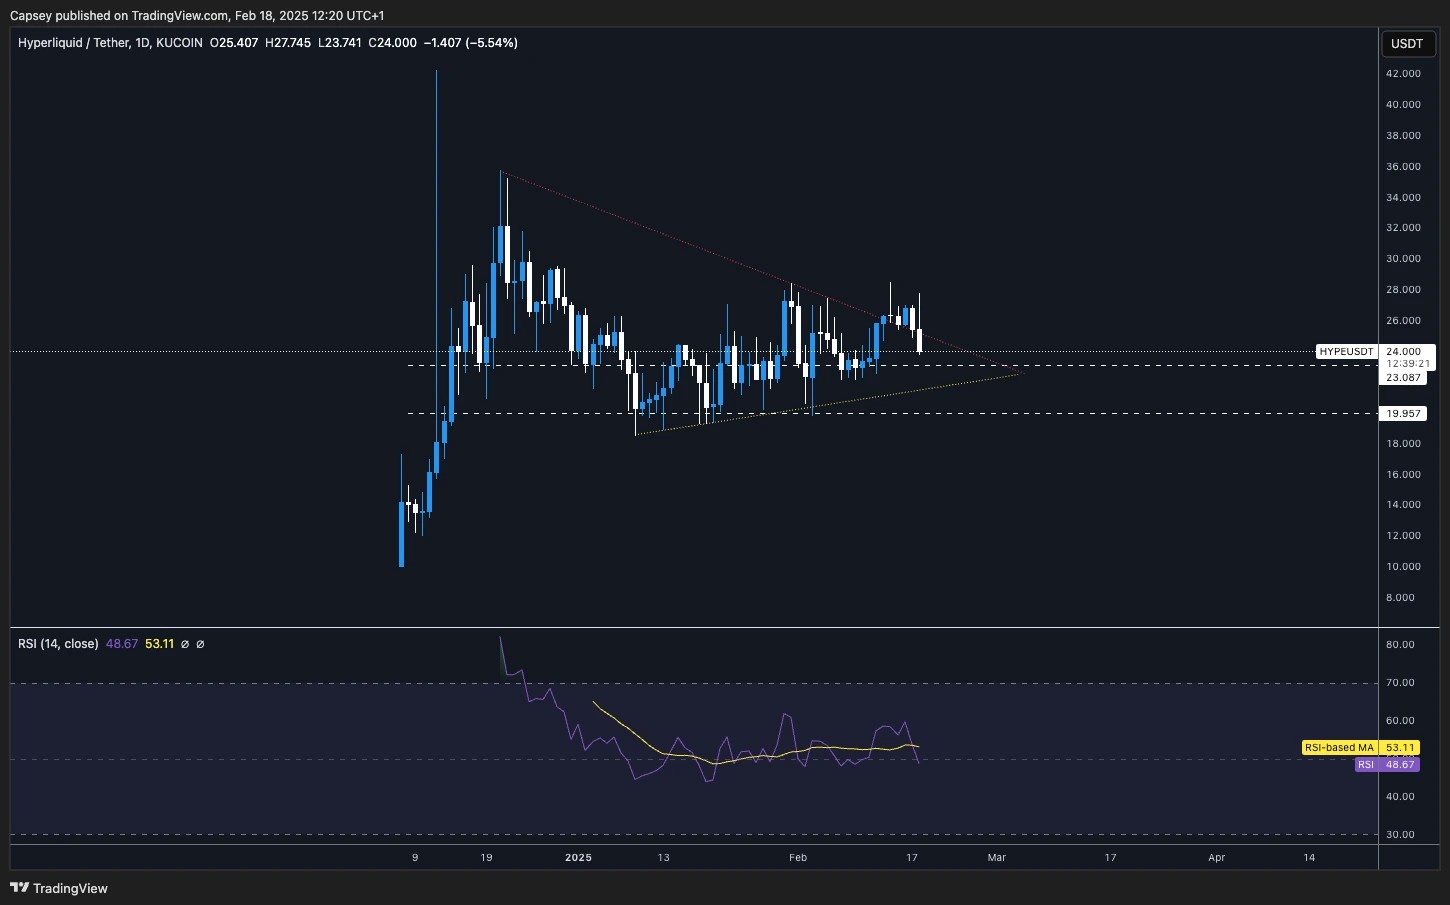
- Next Support: $22
- Next Resistance: $28
- Direction: Neutral/Bearish
- Upside Target: $28
- Downside Target: $16
HYPE has mostly just traded in a range, but without going through any major breakdowns, unlike the rest of the market. It is possible that HYPE can break down on its own, but it's much more likely if BTC were to break down.
In the short term, we don't expect any major breakouts to the upside, and we do expect a breakdown to be more likely. A target zone for us would be $14 to $16. To us, the likelihood of this increases drastically if BTC also breaks down.
DOGE:
- DOGE has remained in its downtrend since the start of the year, and the rice broke out to the upside recently.
- Price couldn't sustain a breakout and probably rejected the first potential stumbling block, which was the local horizontal resistance at $0.285. The price is now back towards the lows.
- If $0.24 can't hold as local support, then the support area of $0.20 to $0.21 will likely be tested in the coming weeks and months. We're expecting this to happen.
- The RSI is still in a downtrend, and it's not far away from being oversold, whilst it's also sat on top of its moving average. This may mean we can see some upside. But, it's not a strong enough signal, until we see a breakout of the RSI downtrend line, which is still a while away.
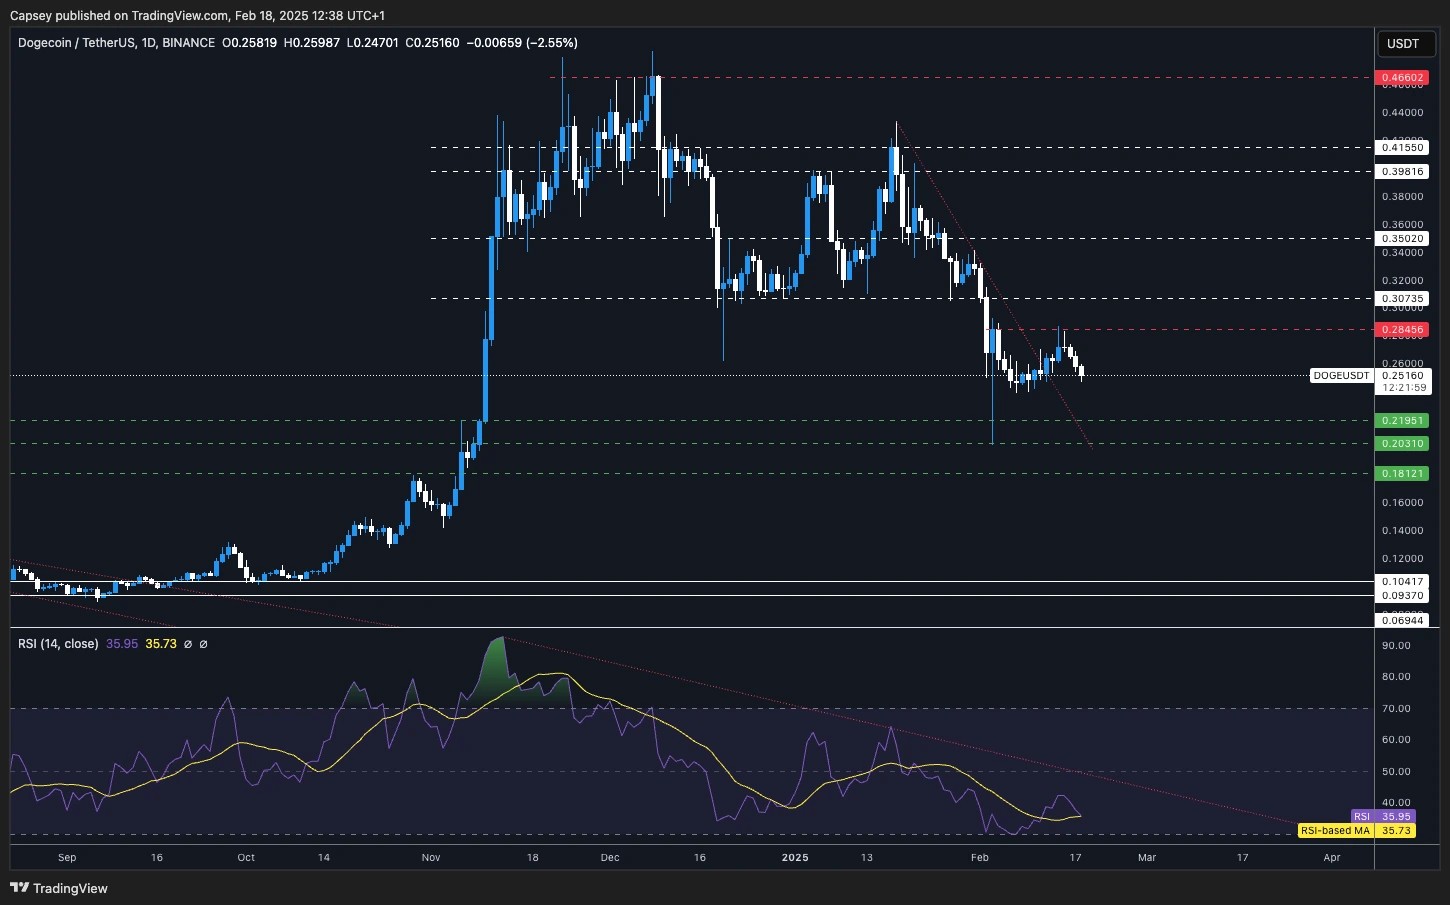
- Next Support: $0.219
- Next Resistance: $0.285
- Direction: Bearish
- Upside Target: $0.285
- Downside Target: $0.20
Cryptonary's take
We're watching DOGE closely as this is one of our main gauges as to whether Alts/memes can start moving more aggressively again. In the short term, we are expecting more downside, and we do see the $0.20 to $0.22 levels as likely to be retested.For now, we'll remain patient and see if we're right on our thesis. And if we are, we'll come back and reassess as to whether we take action on DOGE in and around the $0.20 levels.
Recommended from Cryptonary


