Save 23% ($351) & Get a Free 1-1 Call with our Team ⏰ : 0d 2h 59m 43s
BTC, ETH, SOL, HYPE face pivotal zones
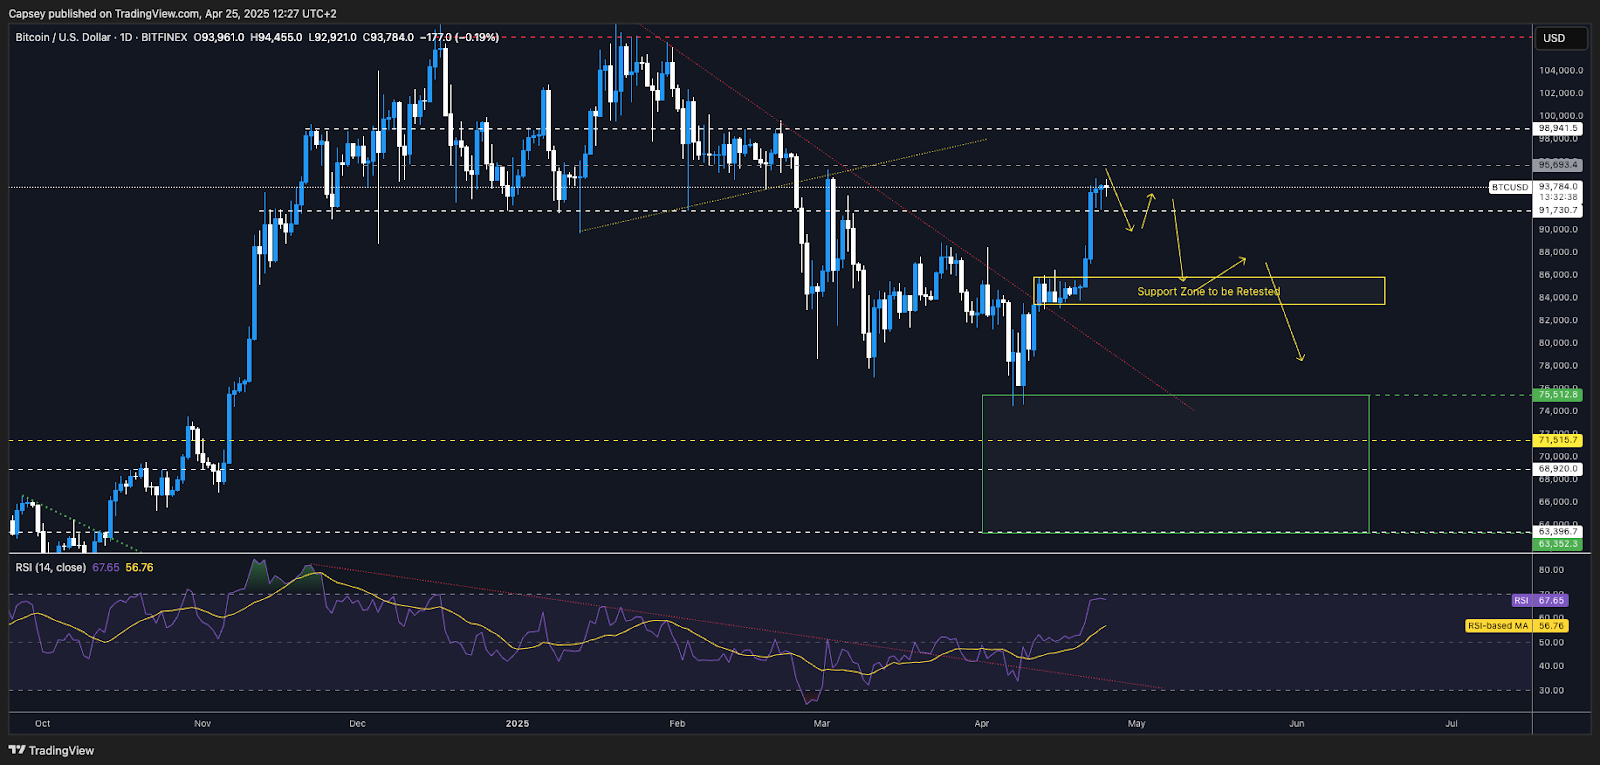
To us, that'll be the key. If we get a correction down to $90,000/$91,700 and bounce there, then that'll be a big sign of strength. However, if the $90,000 level is lost, then we'd expect a revisit to the Yellow box at $86,000.
Disclaimer: This is not financial or investment advice. You are responsible for any capital-related decisions you make, and only you are accountable for the results.
BTC
- BTC's Open Interest spiked significantly with Longs piling in as Shorts were squeezed. Open Interest remains high, and Funding Rates are back to positive, suggesting the Short squeeze is mostly over.
- BTC will now need a strong Spot bid to continue higher.

Technical analysis
- BTC is battling to reclaim its old range between $91,700 and $98,900, and so far it's holding above $91,700 well.
- A key on-chain level is $92,500, this is the Short-Term Holder cost basis, so that's a key level for BTC to maintain above if it can.
- We're currently looking at the main zone of support is between $90,000 (psychological level) and $91,700. A break below $90,000 would likely lead to a retest of the Yellow Box at $86,000.
- The local resistance is likely to be at $95,700 with $98,900 as the main horizontal resistance for the price.
- The price is close to overbought territory on the RSI. It could push higher here, but further upside in the short term is likely limited.
- Next Support: $90,000
- Next Resistance: $95,700
- Direction: Neutral
- Upside Target: $98,900
- Downside Target: $86,000
Cryptonary's take
Overall, a really strong move higher, breaking out of the downtrend line and reclaiming the $91,700 horizontal level. However, in the short term, we do expect the next move to be a correction, but to what level?Our conviction here in the next move isn't high and we're relatively unsure of what we'll get in terms of short-term price action. We'll be flexible on our entry levels depending on how price action responds over the coming week. For now, we're still patient.
What’s next?
BTC, ETH, and SOL are pushing higher into key resistance zones — but momentum is showing early signs of stalling. HYPE looks close to exhaustion, and we're preparing for a shift in market dynamics over the coming days.ETH
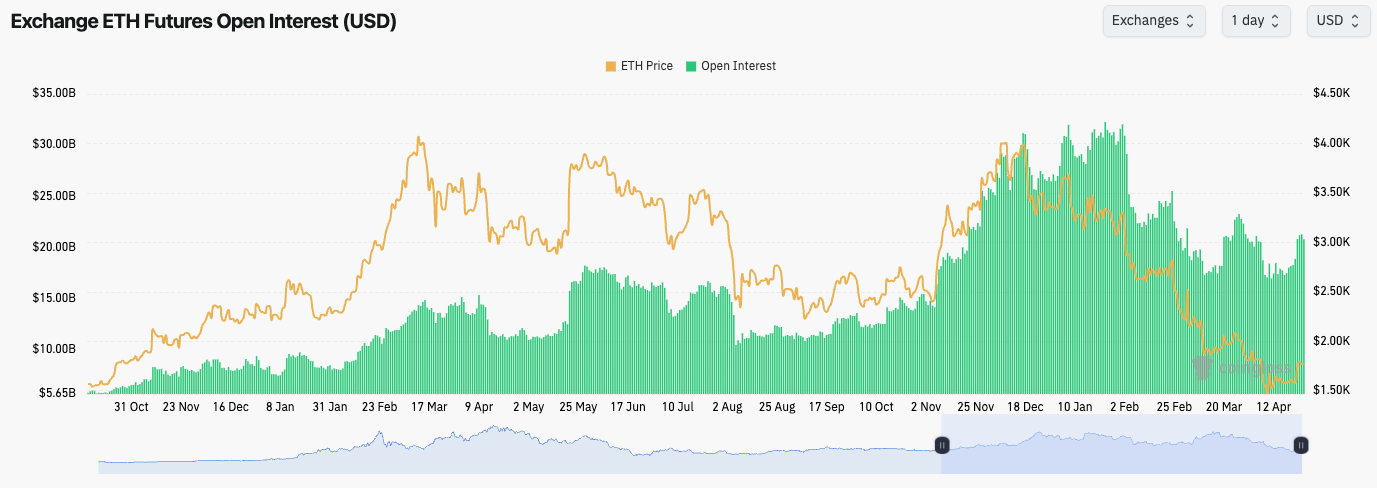
- ETH's Open Interest has also kicked up slightly with Funding staying quite positive, although it has remained positive throughout. There hasn't necessarily been much of a Short-squeeze in ETH.
Technical analysis
- ETH has shot higher from the $1,530 horizontal support, and the price is now battling to reclaim the next horizontal level at $1,745, and so far, it's holding up well.
- Price broke out from the local downtrend line, and the price is moving closer now to the main downtrend line.
- The next major set of horizontal resistances are at $2,000 and $2,160. If ETH can hold $1,745, and push towards a breakout of the main downtrend line, then $2,000 would be the first target.
- To the downside, if $1,745 is lost, we'd expect $1,530 to be a relatively strong level of support.
- The RSI has broken out of the downtrend and it's in middle territory, suggesting that there is plenty of room for further upside.

- Next Support: $1,745
- Next Resistance: $2,000
- Direction: Neutral/Bullish
- Upside Target: $2,000
- Downside Target: $1,530
Cryptonary's take
This is the first sign of some decent life from ETH here. Price held $1,530 (relatively), and the price has now moved higher and reclaimed the horizontal level of $1,745 - this is the first positive bit of price action we've seen for a while.Of course, ETH would need to hold $1,745. In the short term, this does look positive, and if ETH can hold $1,745, then a move to $2,000 is likely.
The key will be whether ETH can hold $1,745, so we'll give this a few more days and see how price action develops, and we'll look to formulate a more concrete view following the weekend.
Simply put, the key level for ETH is $1,745 and how the price reacts here.
SOL
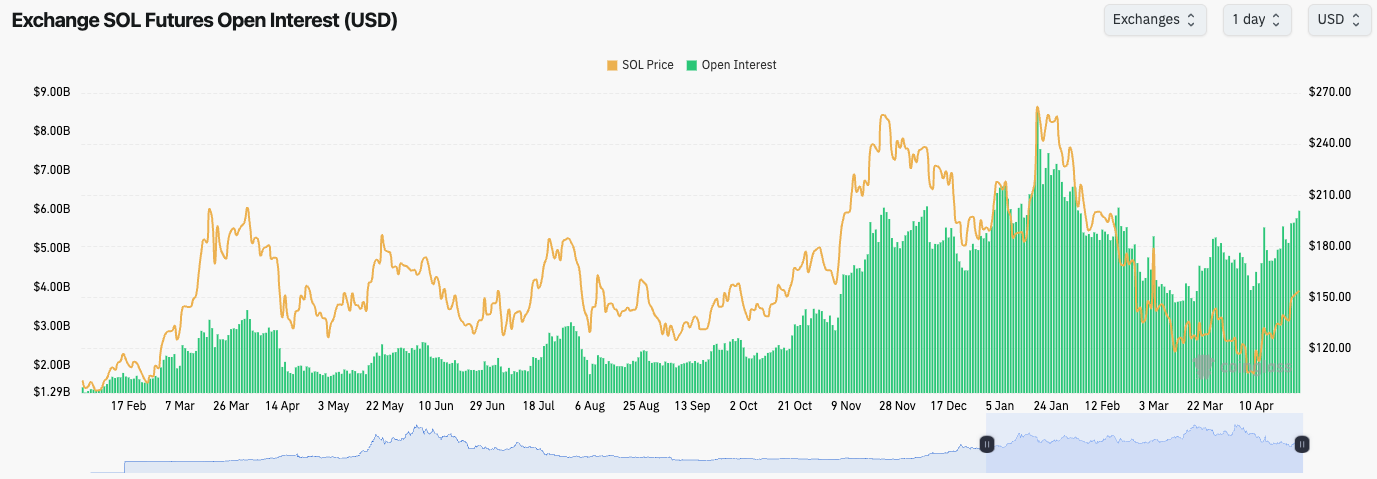
- SOL's Open Interest is also up substantially with Funding resetting to more meaningfully positive. This suggests that Shorters have been blown out, and the leverage market has returned to a more Longs-dominated market again.
Technical analysis
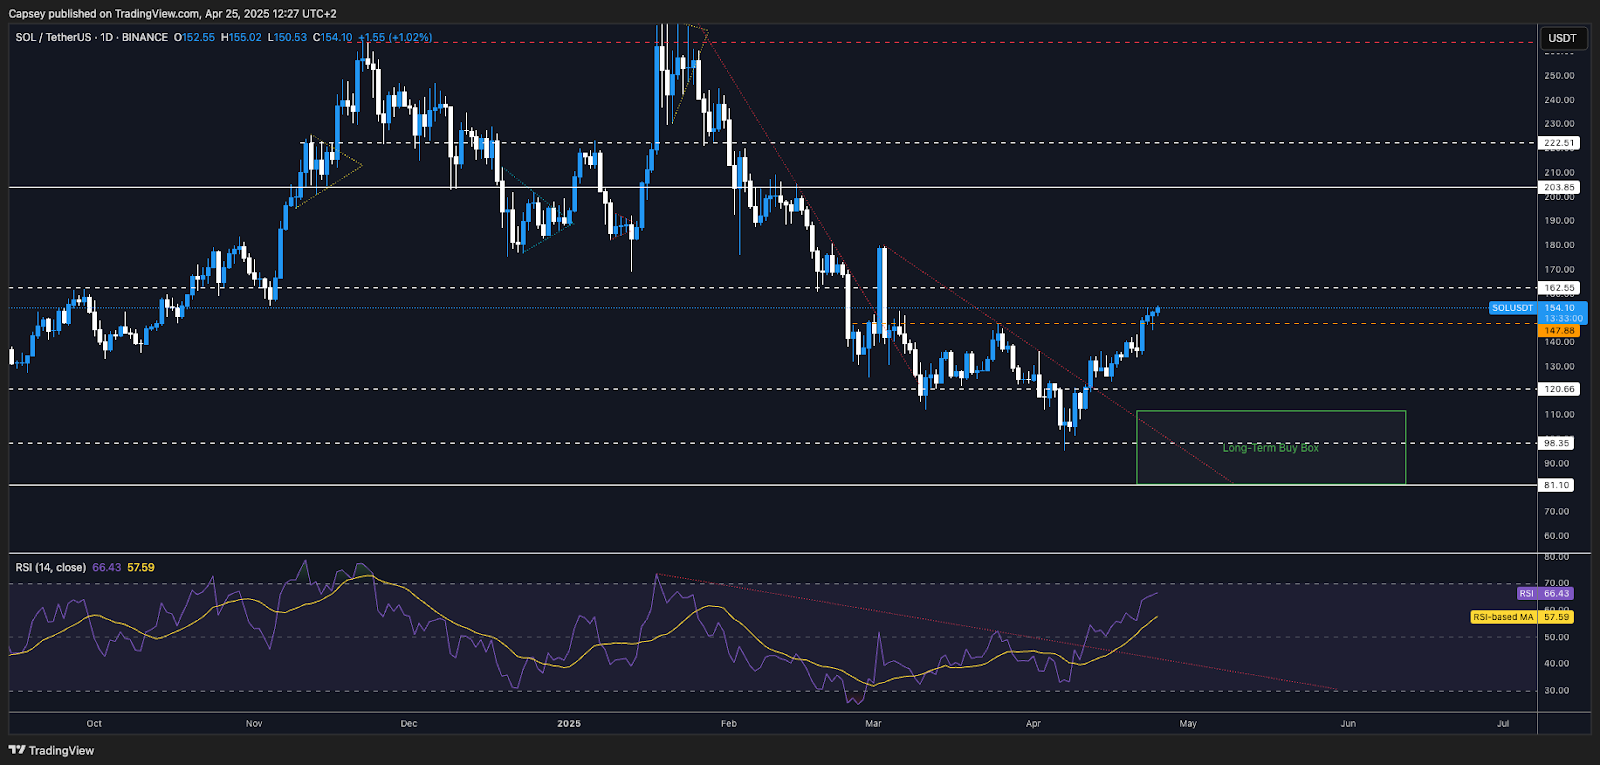
- After breaking out of the downtrend line, SOL has reclaimed the horizontal level of $148.
- Price is now continuing to head higher and targeting the next horizontal resistance at $162. We think $162 might be the local top, assuming the price can get there.
- To the downside, we'd like to see $148 hold as support, but we wouldn't be surprised to see $136 also revisited over the next month.
- The RSI is pushing close to overbought territory, which may mean that further upside for price is capped.
- We still expect that we'll see SOL at $120 again over the coming 1-2 months.
- Next Support: $148
- Next Resistance: $162
- Direction: Neutral
- Upside Target: $162
- Downside Target: $130
Cryptonary's take
So far, a really good move from SOL, particularly as we've been able to see some strength with the reclaim of $148. We would like to see that continue and for $162 to at least be tested.How price reacts/behaves there will be key, although we are expecting $162 to potentially be a local topping area. Our view remains that this is just a relief rally and that we'll see a revisit of at least $120 in the coming 1-2 months.
And again, for that reason, we remain patient.
HYPE
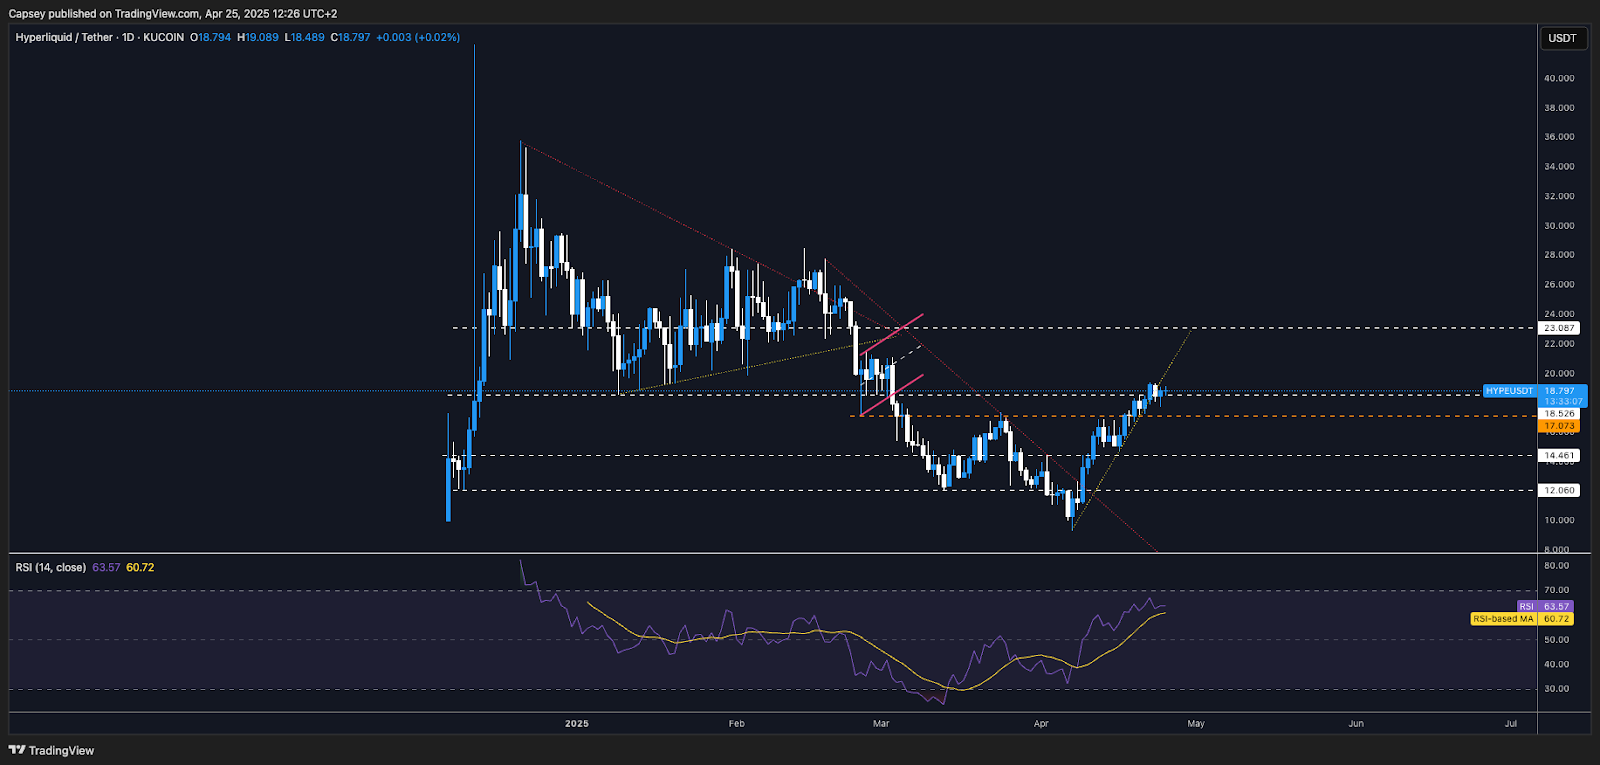
- HYPE has had a big move higher off the lows, with prices consistently reclaiming key levels.
- The price is now at the key level of $18.50 which is a horizontal resistance. Beyond $18.50, $20.80 is the next major level. We don't expect the price to breach above $20.80.
- Price was in a clean uptrend, which price has now broken below. Price will need to swiftly reclaim it. We wouldn't be surprised to see a move into $19.60, and then for the price to be rejected from there.
- To the downside, the key horizontal levels are $18.50 and then $17.10.
- The RSI is close to being overbought. So, a further move higher is possible, but a substantial further upside is likely limited here in the short term.
- Next Support: $17.10
- Next Resistance: $20.80
- Direction: Bearish
- Upside Target: $20.80
- Downside Target: $14.50
Cryptonary's take
Overall, this has been a fantastic move from HYPE, however, we do think/expect that we're in the latter stages of this move higher, and we therefore expect that a local top is near.We wouldn't be surprised to see HYPE back at, at least $14.50 in the coming 6 weeks' time. For this reason, we remain patient, and we're expecting prices to rise to the local top in the coming days/week.
Recommended from Cryptonary


