Save 23% ($351) & Get a Free 1-1 Call with our Team ⏰ : 0d 2h 59m 43s
BTC, ETH, SOL, HYPE: Key levels hit, bulls or traps?
BTC has broken key resistance, but we’re not chasing. Despite a strong breakout, we’re seeing early signs of exhaustion, and several majors are now pressing into heavy resistance with weak conviction. Here’s what we’re watching next.
BTC:
- BTC's Open Interest (by number of coins) has increased whilst Funding remains range-bound/fluctuating between slightly positive and negative. This move up in price has been driven by some leverage, but it's also been supported by a Spot bid.

Technical analysis
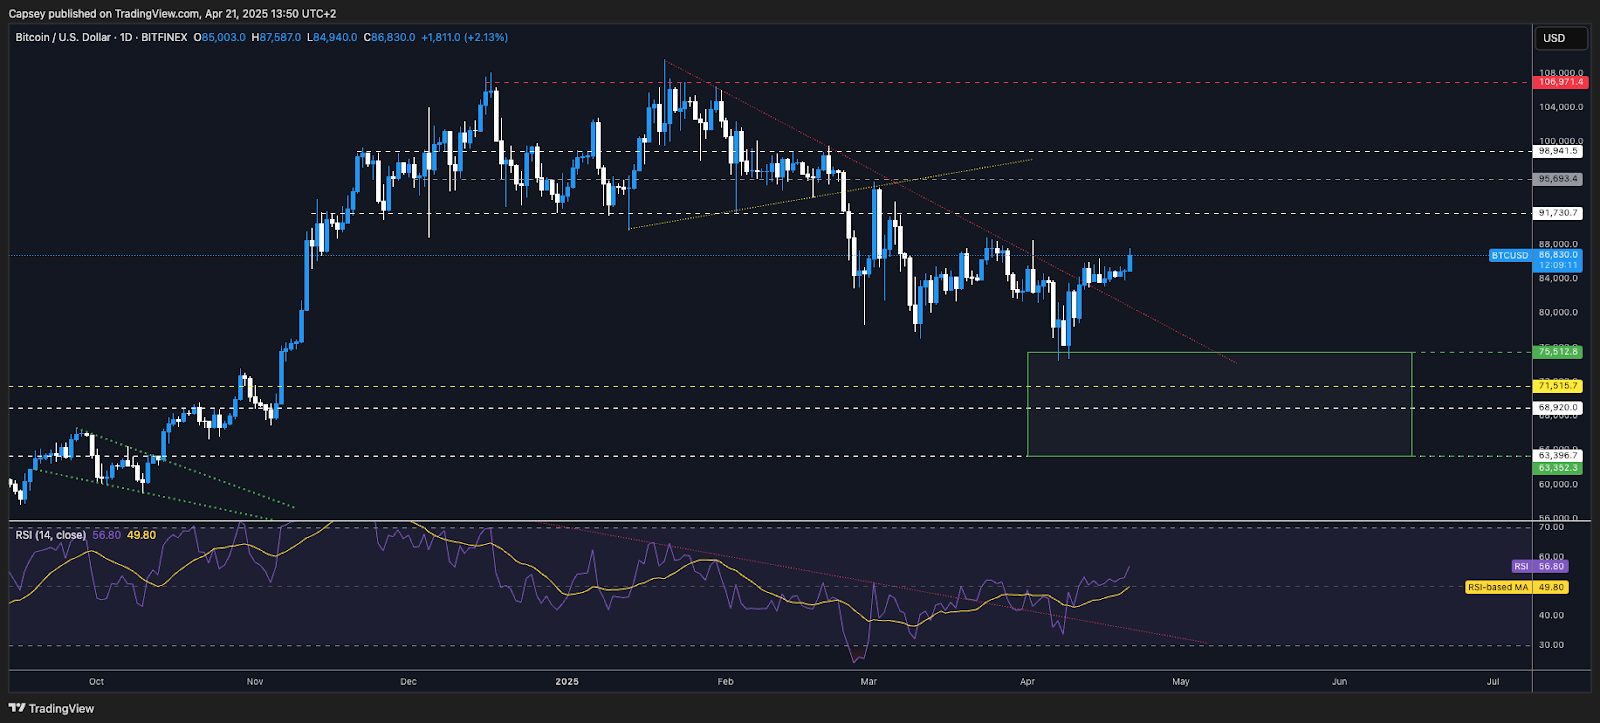
- BTC has broken out of its main downtrend line, and despite being in a tight range for a few days (between $83,500 and $85,500), price has now broken out to the upside.
- Price has now moved up to a local resistance zone between $87,500 and $88,500, however, the major horizontal resistance is at $91,700.
- If price reclaimed $91,700, that would indicate a bullish reversal, and we'd have to look to change our stance. However, we don't see price reclaiming this level anytime soon,
- On the downside, $82,000 is horizontal support, with the next major level in a zone between $74,800 and $78,500.
- The RSI had broken out of its downtrend line some time ago, and having also been sitting above its moving average, it has now broken upwards. It remains in middle territory, so it's possible this price move could extend into $88,500.
- Next Support: $82,000
- Next Resistance: $88,500
- Direction: Bearish
- Upside Target: $88,500
- Downside Target: $82,000
Cryptonary's take
Whilst price has positively broken out to the upside, we remain sceptical of the move. In fact, between $87,500 and $89,000, we will be looking to Short BTC, with the target being a minimum of a retest of $82,000. In the short term, we see upside as close to being done, and therefore we do expect price to pull back over the coming weeks, again with $82,000 as being the minimum target.In the medium term, we are still expecting a retest of the lows, and hence, for now, we remain patient. A price reclaim of $91,700, and we'd have to consider that we're wrong and we'd look to reassess our positioning.
What’s next
ETH, SOL, and HYPE just hit critical resistance zones — our indicators are flashing red, and two of them are primed for double-digit downside in the coming days.Unlock full entry zones, invalidation levels, and accumulation targets.
ETH:
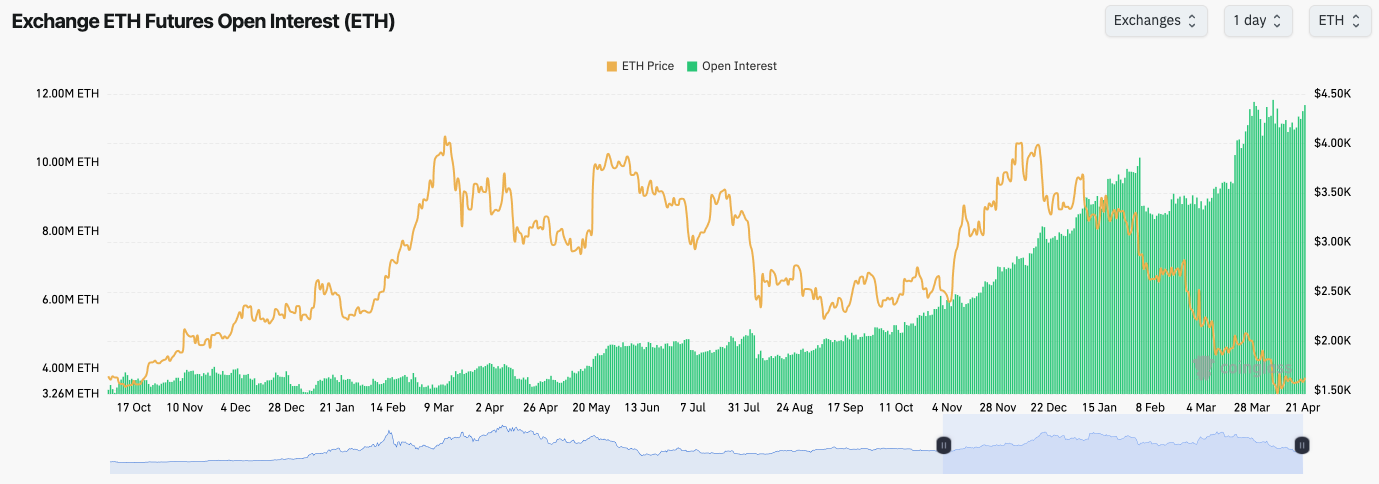
- ETH's Open Interest (by number of coins) remains at extremely elevated levels as traders continue to take advantage of the 'cash-and-carry' trade.
- Like the other Majors, ETH's Funding Rate has mostly been range-bound between slightly positive and slightly negative, indicating that there is no clear directional bias amongst traders.
Technical analysis
- ETH's price action remains range-bound between the support of $1,530 and the horizontal resistance of $1,680.
- Beyond $1,680, the major horizontal resistance lies at $1,745. If ETH can reclaim/flip this level, we'd take that as the signal for the bullish reversal.
- On the RSI, ETH has broken out of its main downtrend line, and it's above its moving average in middle territory. This could see an extension of the move higher, however, we do expect $1,745 to remain a strong resistance.
- We still expect a retest of the Green Buy Box between $1,230 and $1,530 over the medium term.

- Next Support: $1,530
- Next Resistance: $1,745
- Direction: Bearish
- Upside Target: $1,745
- Downside Target: $1,230
Cryptonary's take
ETH remains in a long-term downtrend, and we fully expect a retest of the lows, which would put price comfortably in the Green Buy Box between $1,230 and $1,530. We would look to accumulate ETH in this area with a long-term view to hold - it would likely be at least a 12-month hold.Whilst it's possible in the immediate term, ETH could see more upside (up to say $1,745 at best), we are, however, expecting more downside over the medium term; therefore, again, we remain patient. But with ETH, we're not looking for Shorts, as it's not at an attractive price point for Shorts despite the fact that we believe we'll see further downside in the medium term.
SOL:
- SOL's Open Interest has increased as price has gone higher, whilst SOL's Funding Rate has turned very negative. This indicates that as the price has moved higher, traders have begun shorting SOL with some size. This level of negative Funding could be slightly vulnerable to a Short squeeze, though. That would be the only point to be wary of from jumping into Short's perspective.

Technical analysis
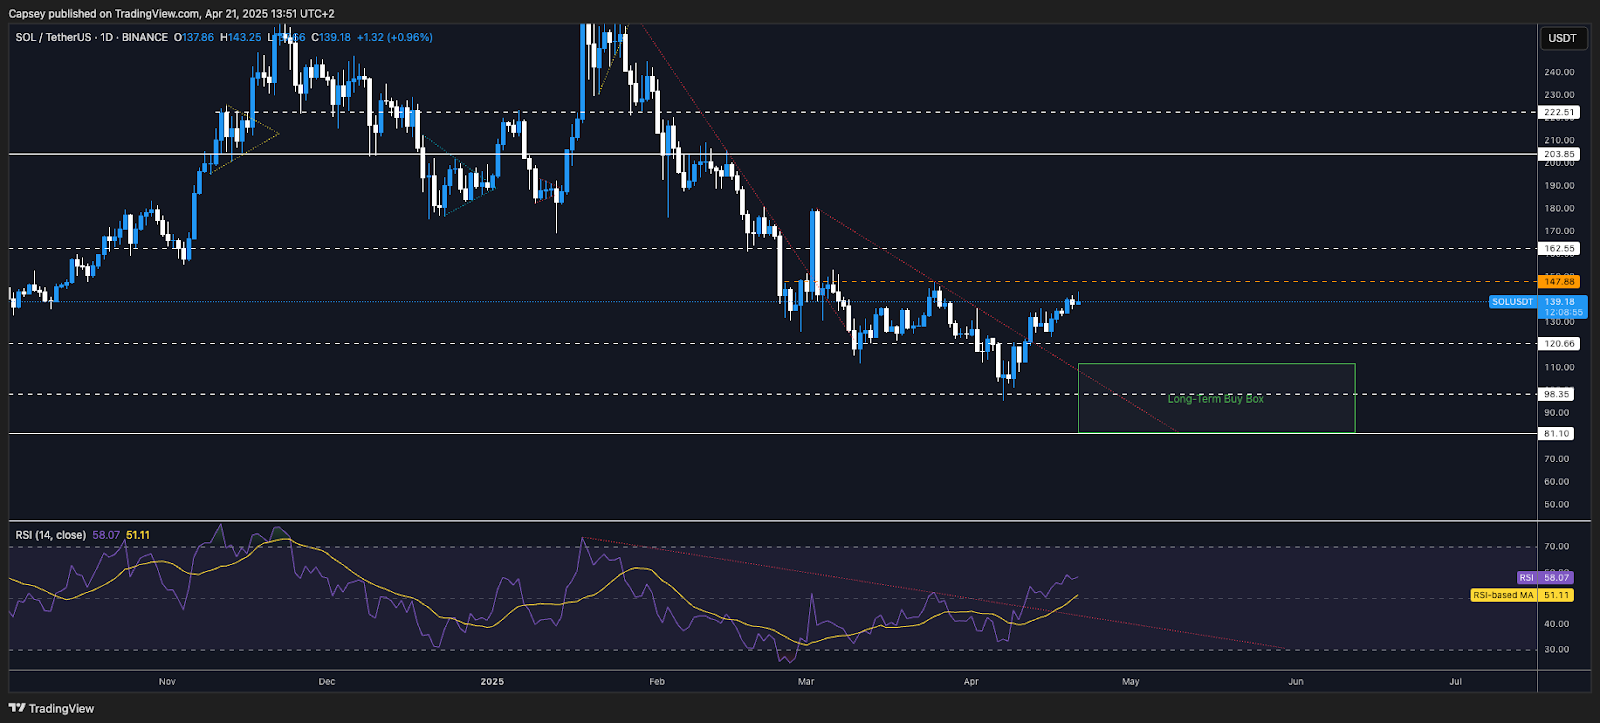
- SOL was able to break out of the local downtrend line and reclaim the horizontal level of $120. This has what has helped SOL to break out close to the $148 level.
- $148 is a key horizontal resistance, which may be a stopping zone for the price in the short term.
- If price can get above $148, we'd expect the next level to be the local top ($162), however, we're not confident that price will even reclaim $148.
- To the downside, the main support once again becomes $120, with $98 being the next major level below that.
- The RSI has broken out of its downtrend, but it has put in a hidden bearish divergence, which is a lower high in price and a higher high on the oscillator. This can suggest exhaustion to the upside.
- Next Support: $120
- Next Resistance: $148
- Direction: Bearish
- Upside Target: $148
- Downside Target: $120
Cryptonary's take
We expect in the short term that SOL is close to a local top, with this likely being around the $140 to $148 level. However, if not, then we do expect $162 as a maximum level for a local top, but we're not confident the price gets as high as that.We are expecting more downside in the medium term, and therefore, we do expect a revisit of the $120 horizontal support. We'll be closely assessing price behaviour at that level, assuming we're right in calling for it.
We're expecting downside in the medium term, and we'll look to accumulate SOL for the long run in the Green Buy Box (between $81 and $112).
HYPE:
- Overall, a really clean move higher following the breakout from the downtrend line.
- HYPE has cleared above multiple horizontal levels, with price now reaching $18.50, a key horizontal resistance level for price.
- Beyond $18.50, there's a local horizontal resistance at $19.40 and then $20.80, but we do see $18.50 as a really key level for the price to overcome in the short term.
- Price is now seemingly squeezing into its uptrend line, and it does look to be slightly beginning to lose steam to the upside. We wouldn't be surprised here to see a price break below its uptrend line.
- To the downside, the key levels to defend are at $17.00 and $14.50.
- The RSI is just shy of overbought territory, but it remains above its moving average.

- Next Support: $17.00
- Next Resistance: $18.50
- Direction: Neutral/Bearish
- Upside Target: $20.80
- Downside Target: $14.50
Cryptonary's take
HYPE has had a good run here off the lows at $9.40, and is not far off seeing a 100% move higher from those lows. Price is now starting to reach a level where it's beginning to look slightly exhausted to the upside. We'd be looking to Short HYPE between $18.00 and $20.80, should price fill as high as $20.80.We're expecting this to look like a trend of lower highs and lower lows on a really zoomed-out basis, with our plan to fill our long-term HYPE bags into single-digit HYPE over the coming month or two. For now, we remain patient for that, and we expect HYPE's price to rollover over the next week, say.
Disclaimer: This is not financial or investment advice. You are responsible for any capital-related decisions you make, and only you are accountable for the results.
Recommended from Cryptonary


