Save 23% ($351) & Get a Free 1-1 Call with our Team ⏰ : 0d 2h 59m 43s
BTC, ETH, SOL, POPCAT, SPX and WIF signal key moves ahead
Bitcoin ($BTC) and Ethereum ($ETH) approach key resistance levels, while Solana ($SOL) and WIF highlight rebound opportunities in volatile but promising market conditions. Meanwhile, POPCAT eyes a potential breakout from $0.92, and SPX nears $1.00 after a strong bullish push.
Disclaimer: This is not financial or investment advice. You are responsible for any capital-related decisions you make, and only you are accountable for the results.
BTC:
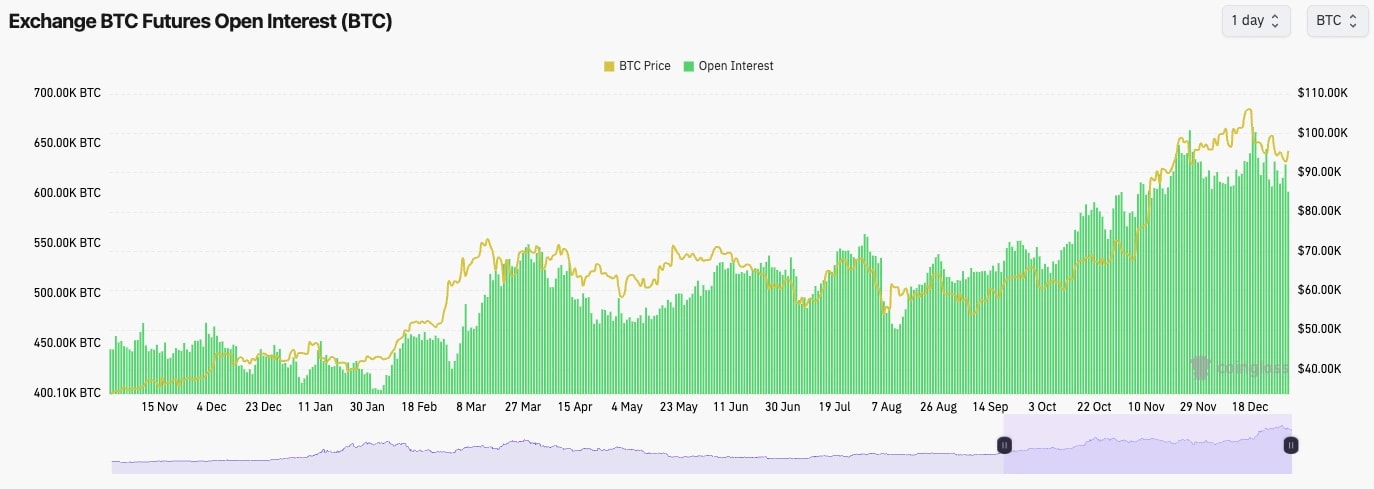
- Open Interest has pulled back from 660k coins to 606k coins over the last two weeks. An approximate 10% pullback in OI is healthy.
- Funding Rates remain flat at 0.01%, indicating that there isn't excessive gambling in the futures market, as would be reflected in very high Funding Rates.
Technical analysis
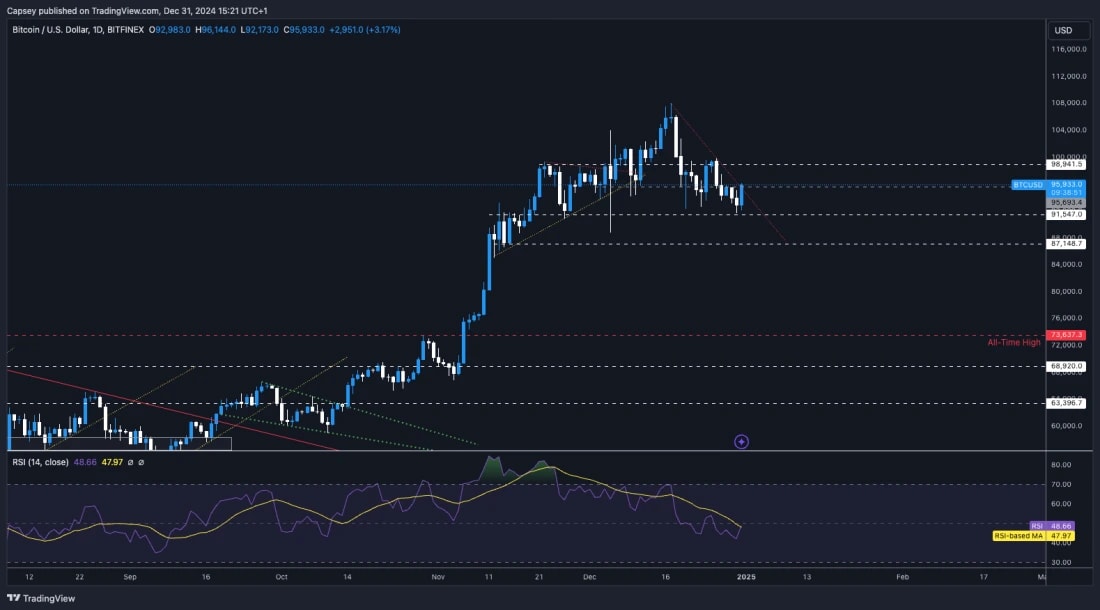
- Bitcoin has been in a local downtrend since mid-December, and its price is at an all-time high.
- So far, the price has found support in the high $91k's which was a prior all-time high resistance back in early November.
- We expect the low $ 90k to hold as support in the short term. But, if the price were to break lower, we'd expect $88k to be a major support.
- To the upside, BTC is moving into a local horizontal resistance at $95,700, although the price is currently attempting to push through.
- Beyond $95,700, there is the local downtrend line and the more major horizontal resistance of $98,900 that price would need to break through.
- The RSI is in the middle territory, although it is butting up against its moving average.
Get the latest Bitcoin price prediction—dive into our detailed analysis to stay one step ahead!
- Next Support: $91,000
- Next Resistance: $98,900
- Direction: Neutral (Bullish)
- Upside Target: $98,900
- Downside Target: $91,000
Cryptonary's take
What's important to note is that between Christmas and just after New Year, the order books are quite thin, so the price can move in a volatile fashion. Currently, there is an underlying Spot bid (today) which is driving the price higher, which is good to see.Bitcoin has looked really strong throughout the past month despite us seeing weakness in other sectors. Whilst it's possible that price remains range-bound between $91k and $96k, we are actually leaning more towards Bitcoin breaking out to the upside in the coming days.
This would have a potential target of $98,900, and we'd reassess price action around there once/if the move we're predicting happens.
ETH:
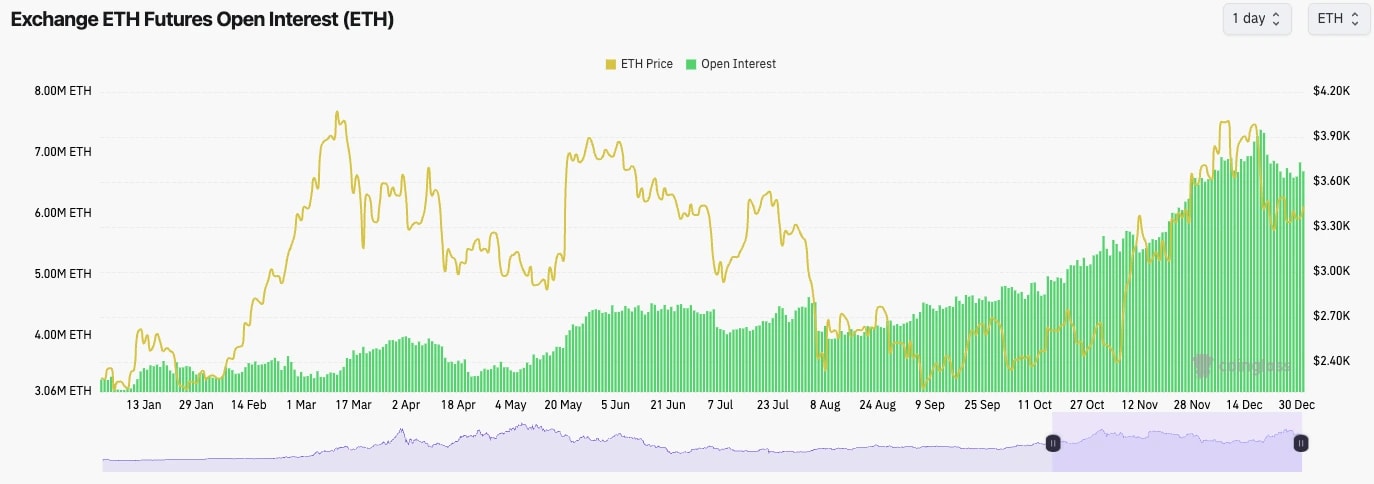
- ETH's Open Interest is also down approximately 10% from its highs, although it has started moving higher again in the past few days. Perhaps traders are looking to get exposure to ETH going into the New Year.
- The Funding Rate for ETH is at 0.01%, indicating a healthy dynamic between Longs and Shorts. Funding isn't skewed in either direction for now.
Technical analysis
- Overall, it is a really interesting chart with prices respecting key levels.
- The price was rejected on the underside of the uptrend line, and the horizontal resistance was at $3,967.
- Price has since pulled back to the low $ 3,00,0, and it has been mostly range-bound between the horizontal support of $3,280 and the horizontal resistance of $3,480.
- A break out of $3,500 likely sends the price swiftly back to $3,700.
- The RSI is in the middle territory at 47, but it is breaking above its moving average. This could see price follow through a push up to $3,700 in the immediate term.
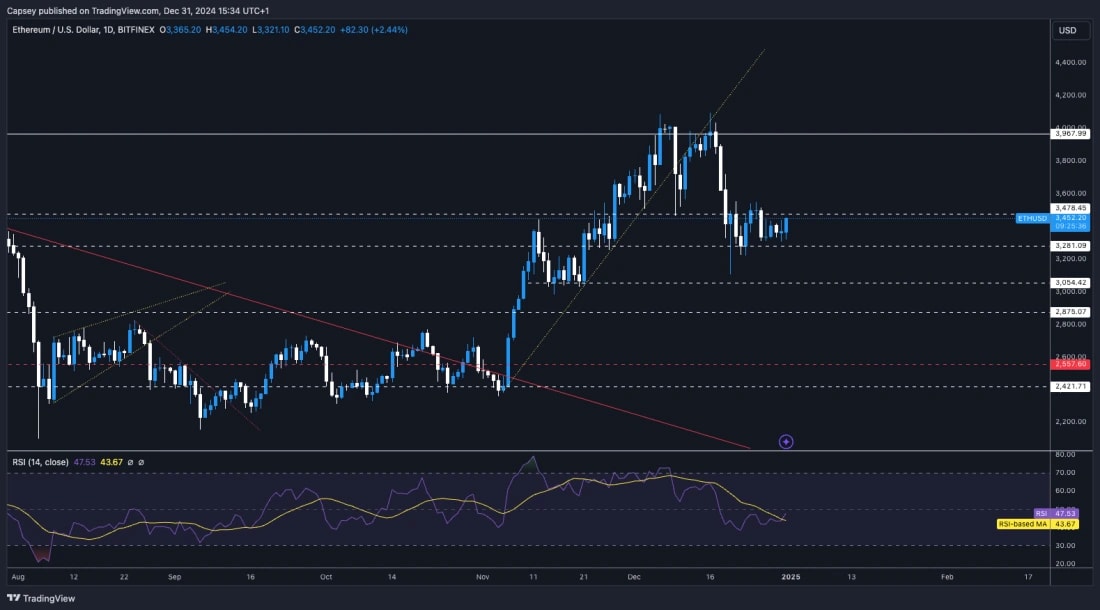
- Next Support: $3,280
- Next Resistance: $3,480
- Direction: Neutral (Bullish)
- Upside Target: $3,700
- Downside Target: $3,280
Cryptonary's take
ETH looks good here for a short-term stab higher, potentially testing into $3,700. For this, we're looking for a breakout of $3,480 to $3,500, which we think we'll get/see in the coming days.SOL:
- SOL's Funding Rate also remains flat/healthy at just 0.01%. This is good to see with SOL, which is near $200, and there doesn't look to be any excessive leverage built up.
- SOL's Open Interest (in USD terms rather than by a number of coins) has pulled back from approximately $6.0b to $4.5b in just a few weeks. This is a meaningful pullback, and it means that any excesses have been flushed out on what is a mere 30% pullback from the highs seen in the $250's. Good to see all around.

Technical analysis
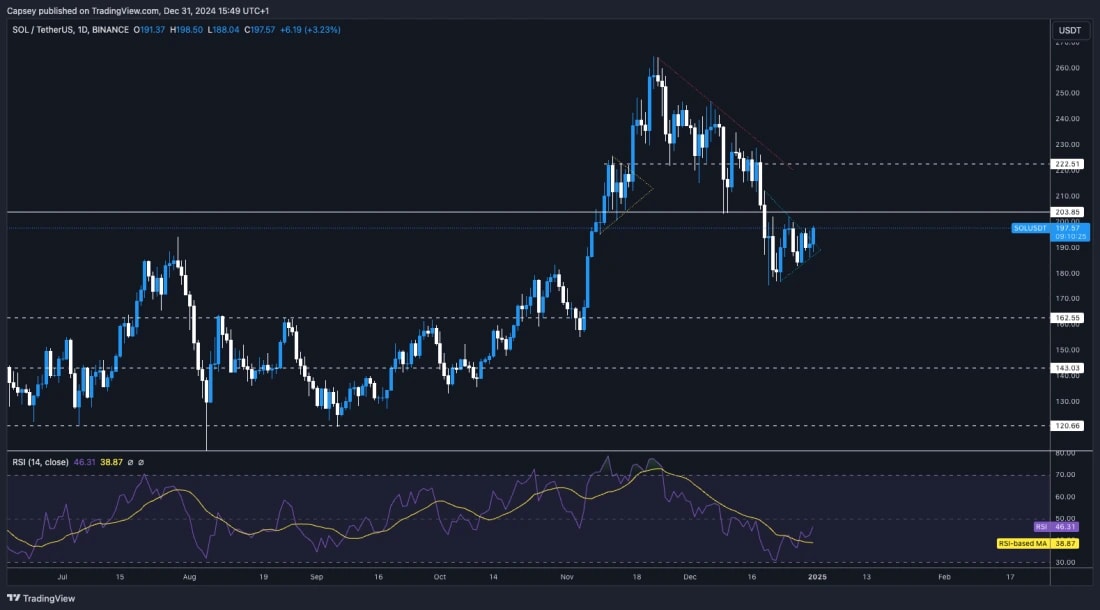
- SOL broke below the key range between $200 and $220, finally finding support in the late $170's. This isn't a move we expected. However, it did meaningfully reset a handful of the indicators, with the RSI even breaching into oversold territory on the Daily timeframe.
- The price has now spent some time being in a range bound between $180 and $200 and forming a pennant-like pattern, although it isn't the most accurate pennant.
- The RSI has moved off of oversold territory, and it's now broken above its moving average. This may help send the price higher.
Stay updated on Solana price prediction—explore our full analysis for the latest market insights.
- Next Support: $180
- Next Resistance: $200
- Direction: Neutral (Bullish)
- Upside Target: $215
- Downside Target: $180
Cryptonary's take
We're expecting the price to move to $205, potentially $215, and that'll be the crucial testing point to see if the price can reclaim higher levels. In the short-term, we think we can see a breakout to $215, but we're not sure we get much more than that in the coming week.WIF:
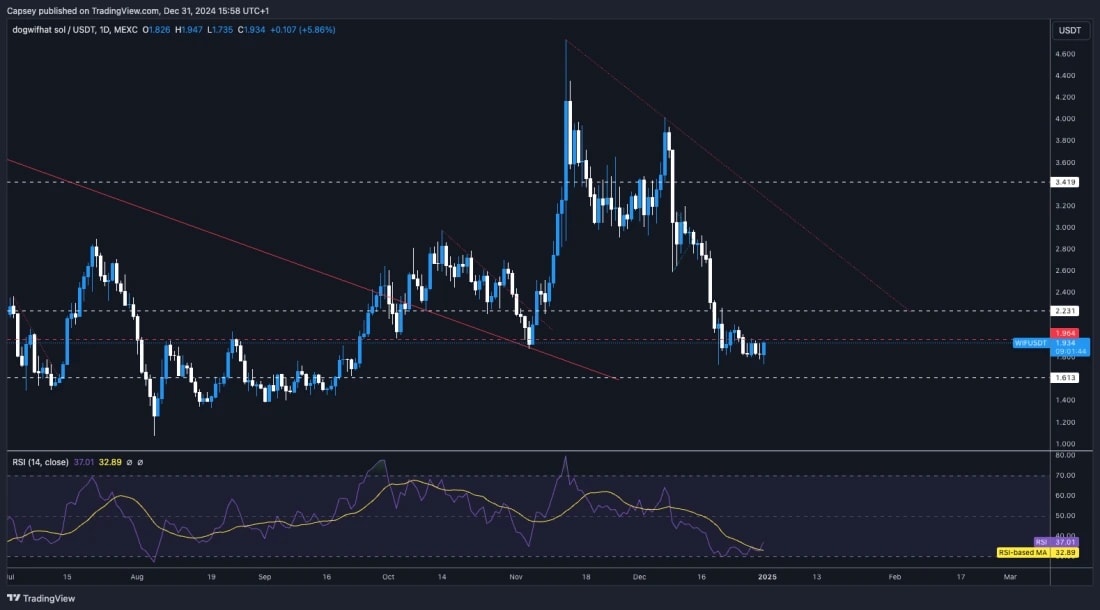
- Overall, price action has been disastrous, with price struggling to put in a meaningful bounce, which we have got on other major pullbacks.
- Price has broken through a lot of key levels, and it's now using the $1.96 horizontal level as a local resistance.
- Beyond $1.96, $2.20 is the key level for the price to breach above.
- There is huge support between $1.50 and $1.80, so that's a positive.
- What's also positive is that in this pullback, the RSI became oversold, and it is now breaching the lows and breaking above its moving average. This is the first sign of positivity we've seen for a while.
Don’t miss the latest dogwifhat (WIF) price prediction—explore our insights to stay ahead in the crypto market.
- Next Support: $1.80
- Next Resistance: $2.20
- Direction: Neutral (Bullish)
- Upside Target: $2.20
- Downside Target: $1.80
Cryptonary's take
Overall, chart-wise, this really looks like it's due for a more meaningful bounce. However, what is a concern is that we haven't seen a meaningful bounce already, although it's possible we can put that down to the time of year when big traders are away from their desks, and therefore the liquidity just isn't there in the market currently.In the coming week, we expect WIF to move up to $2.20 and retest that level. It'll be key to judge the price action at $2.20, assuming we get a retest of that level. A strong reaction at that level is needed if we're to see higher prices in the coming weeks/months.
POPCAT:
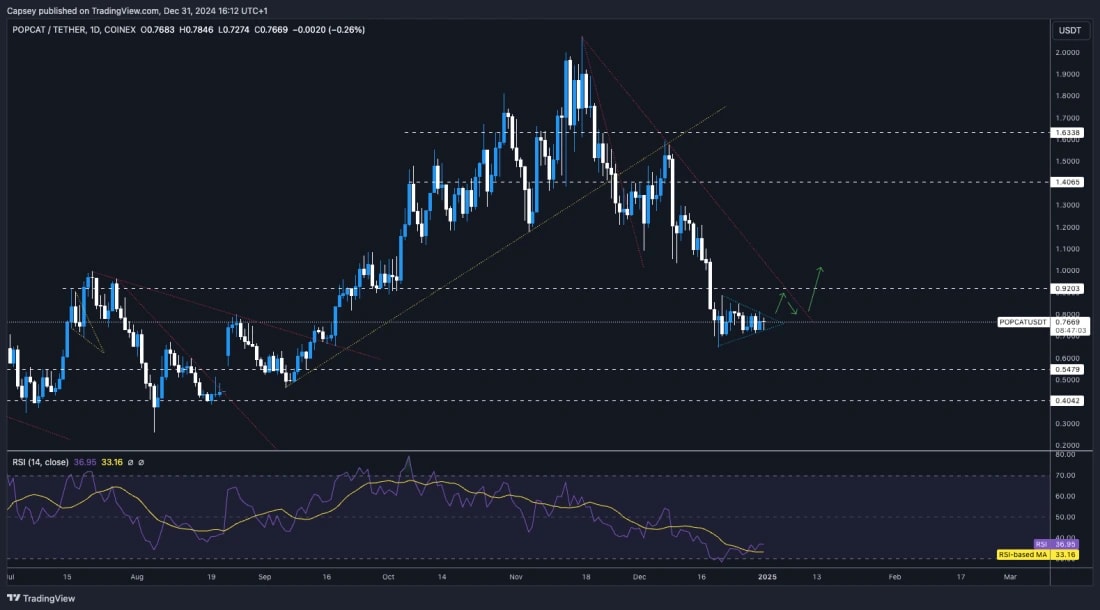
- We had a huge move down in early December from $1.50 down to $0.70.
- Price is now forming a bearish pennant pattern at the lows, which is usually bearish, but we actually expect a breakout to the upside.
- The RSI was well into oversold territory. We now have a bounce in the RSI, and it has broken out to the upside of its moving average.
- We expect $0.70 to maintain as major support, with a breakout of the pennant likely to send the price back to $0.92 to retest that horizontal level as the new resistance.
- If the price can break out and reclaim $0.92, then it's very possible we will see $1.10 retested also.
- What will also be interesting is to see how the price moves along the main downtrend line. POPCAT has proven previously that when it breaks out of major downtrend lines, the move higher can be violent.
Looking for an accurate POPCAT price prediction? Read our analysis to know what’s next for POPCAT!
- Next Support: $0.70
- Next Resistance: $0.92
- Direction: Neutral
- Upside Target: $0.90
- Downside Target: $0.70
Cryptonary's take
Overall, similar to WIF, shocking price action. However, the price is now at the lows (seemingly), whilst the indicators are coming out of oversold territory. You'd expect a bounce from here, particularly if BTC and SOL can bounce also.We're expecting something like the arrows to play out.
SPX:
- SPX has managed to break out of the previous resistance zone between $0.72 and $0.75.
- Price has now pushed into the $0.90 area, which was just shy of prior all-time highs.
- There is a small resistance zone between $0.87 and $0.91 that the price will need to break out of.
- If the price does pull back, we'd expect $0.72 to $0.75 to be a new major support for price. We'd be very surprised if the price broke back below this level.
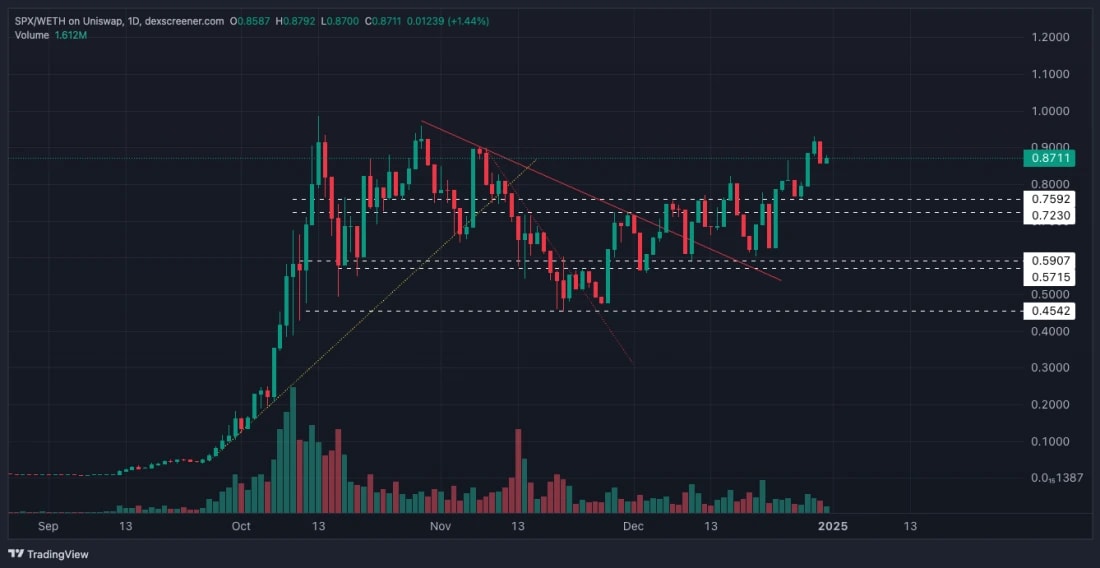
- Next Support: $0.75
- Next Resistance: $1.00
- Direction: Bullish
- Upside Target: $1.00
- Downside Target: $0.75
Cryptonary's take
Overall, the chart looks great here. It looks likely that SPX can break to the upside, get above $0.91 and then push onto the all-time highs and the $1.00 mark in the short term. It's possible that SPX might need the rest of the market to break higher also to help give it momentum, but charting and structure-wise, SPX looks good here.Recommended from Cryptonary


