Save 23% ($351) & Get a Free 1-1 Call with our Team ⏰ : 0d 2h 59m 43s
BTC, ETH, SOL rally as WIF, POPCAT, and SPX await moves
Flush-outs hit the crypto market, but BTC bounced back, ETH neared $4k, and SOL steadied above key support. With WIF and POPCAT range-bound, the stage is set for potential breakouts across major assets. Let’s dive into this week’s price action.
Disclaimer: This is not financial or investment advice. You are responsible for any capital-related decisions you make, and only you are accountable for the results.
BTC:
- Yesterday, BTC underwent a small leverage flush out.
- This is where too much leverage was put on, in this case, in Longs, and as prices came down, these late Longs were flushed out.
- On Binance, the Open Interest fell from 98k BTC down to 91k BTC, so a 10% move down in Open Interest.
- The Funding Rate had also moved too high (too much Long leverage). It was at 0.1%, which is approximately 10x too much. Since the flush out, Funding has reset to 0.01%, so there is a large decrease.
- This leverage flush-out was needed, and it is healthy in bull markets.

Technical analysis
- Wow, what a candle that was yesterday.
- We had a breakout of the bullish pennant, and upon this breakout, we saw Longs really pile in.
- Too much leverage left Longs vulnerable to a flush-out, which is exactly what we got.
- The flush out was swift, with the price pulling back all the way to $90,500. However, it was aggressively bought up.
- The $87,000 to $91,500 zone we identified as our major support is exactly where the price bounced from.
- Price now finds itself back in the bullish pennant, squeezing towards its highs of the last fortnight.
- If the price can break back above $100k, then it's very likely that the price swiftly moves back to $104k 105k.
- The RSI remains just shy of overbought territory, so there is room for the price and this indicator to move higher.

- Next Support: $91,500
- Next Resistance: $104,000
- Direction: Bullish
- Upside Target: $104,000 (then $110,000)
- Downside Target: $91,500
Cryptonary's take
Yesterday's flush-out had seemed inevitable over the last week or so as we've seen Open Interest continue to move up. As soon as funding began to ramp up aggressively, Longs became vulnerable, as we expected it would be.This then happened (late Longs piled in) upon a clean breakout of $100k. We see yesterday's price action as necessary in this kind of market, and bull markets need this to happen in order for the bull to continue. So, we see it as really healthy and necessary.
We still expect that Bitcoin can break out over the coming days/week. It's possible there's more range-bound at these higher $90k levels, but we do expect another breakout to the upside to come in the coming week. We wouldn't be surprised to see BTC back to $104k by the end of play this Sunday.
ETH:
- Like BTC, the rest of the market also moved lower; however, generally speaking, the rest of the market saw less of a meaningful flush out.
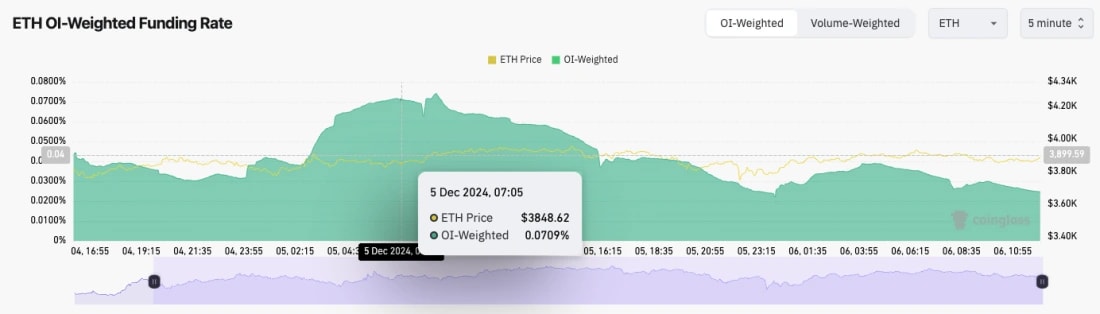
- ETH's Open Interest on Binance moved down from 1.67m ETH to 1.51m ETH, so an approximate 10% flush out in Open Interest for ETH.
- The Funding Rate had moved up substantially, and it came down from 0.065% to 0.024%.
- So, some Longs were flushed out. However, there still remains a relatively high level of Open Interest.
Technical analysis
- The TA hasn't changed much from our last update, so we'll keep this section lighter.
- Price has remained in an uptrend, and for now, the price has initially rejected the major horizontal resistance and psychological level of $4,000.
- To the downside, the $3,480 to $3,700 zone should act as major support.
- The RSI is very close to overbought territory. It's close that there is further upside, but we wouldn't be surprised to see the price linger under $4,000 for a week or so, and that might help reset the RSI slightly.
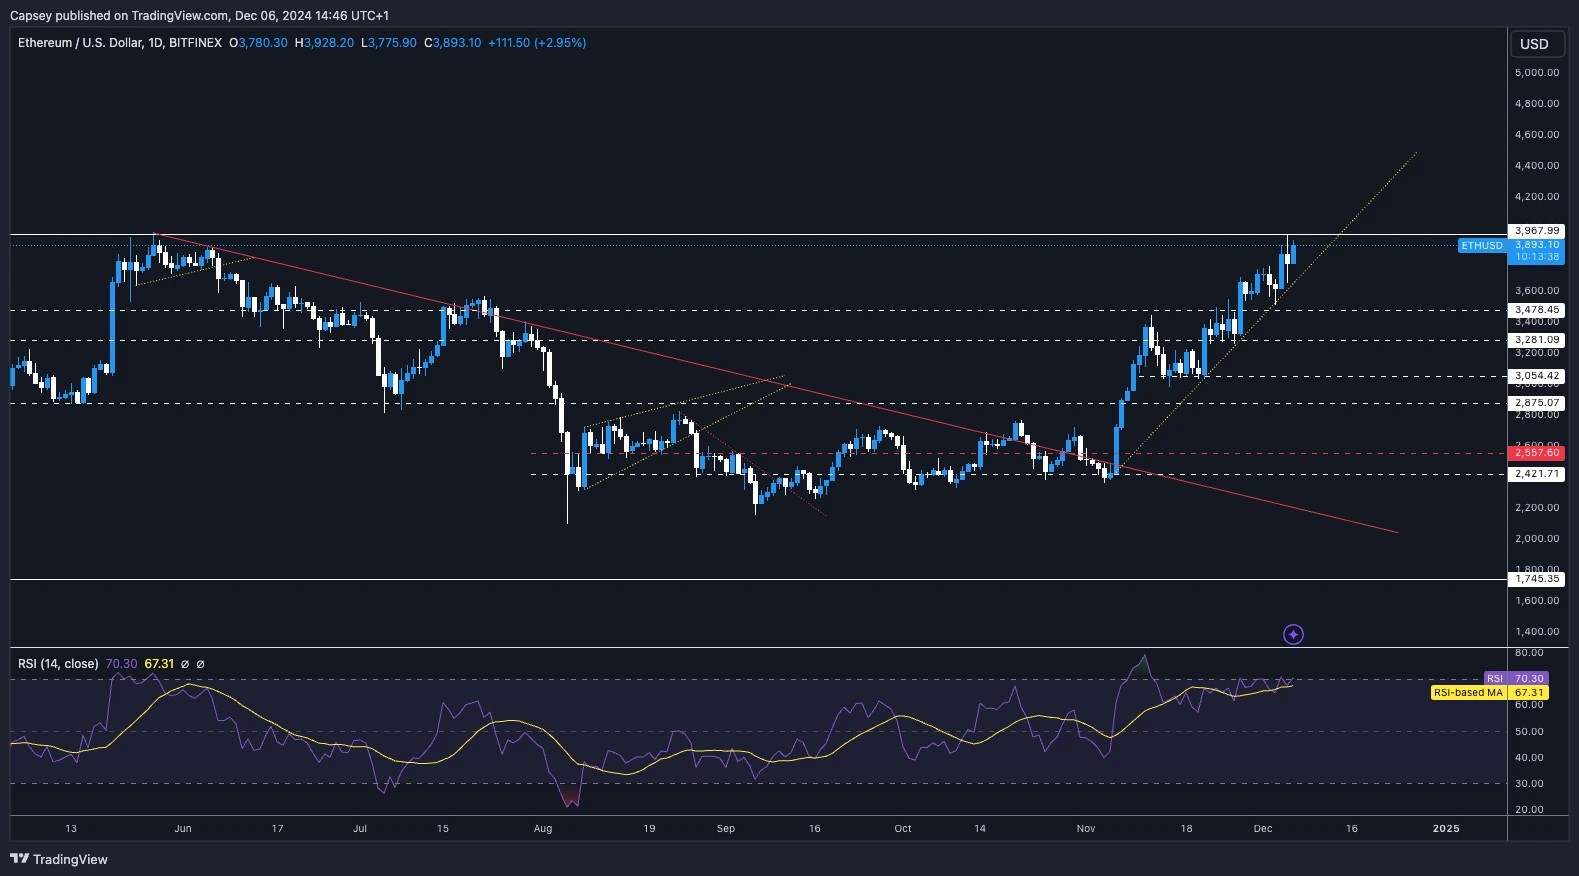
- Next Support: $3,480 - $3,700
- Next Resistance: $4,000
- Direction: Neutral/Bullish
- Upside Target: $4,000 (then $4,500)
- Downside Target: $3,480
Cryptonary's take
Whilst it's possible that ETH does just break beyond $4,000, we do still expect that $4k is a resistance, at least for a few more days, potentially up to the next week. However, beyond that, we do expect a stronger break out that eventually sees ETH move to $4,500 within the coming weeks.For now, we continue to hold Spot bags. A retest of $3,500, and we'd consider adding to these Spot bags for a short-term swing trade.
SOL:
- SOL was much less affected by yesterday's leverage flush out, seeing Open Interest only fall by approximately 5%.
- The Funding Rate did pull back more significantly, though, from 0.07% to 0.02%. So some late Longs were flushed out/closed out; it just wasn't a violent move.
![]()
Technical analysis
- SOL has attempted a breakout from the descending wedge. However, the price has been rejected to the $ 240s for now.
- Price has remained above the key horizontal support of $220, having also used it and bounced from it a number of times already.
- If the price were to fall below $220, we'd expect aggressive bids to step in between $200 to $220.
- To the upside, $250 to $260 remains the key resistance zone for the price to overcome.
- The RSI is down to middle territory at 53, so there is a lot of possible upside to be had.
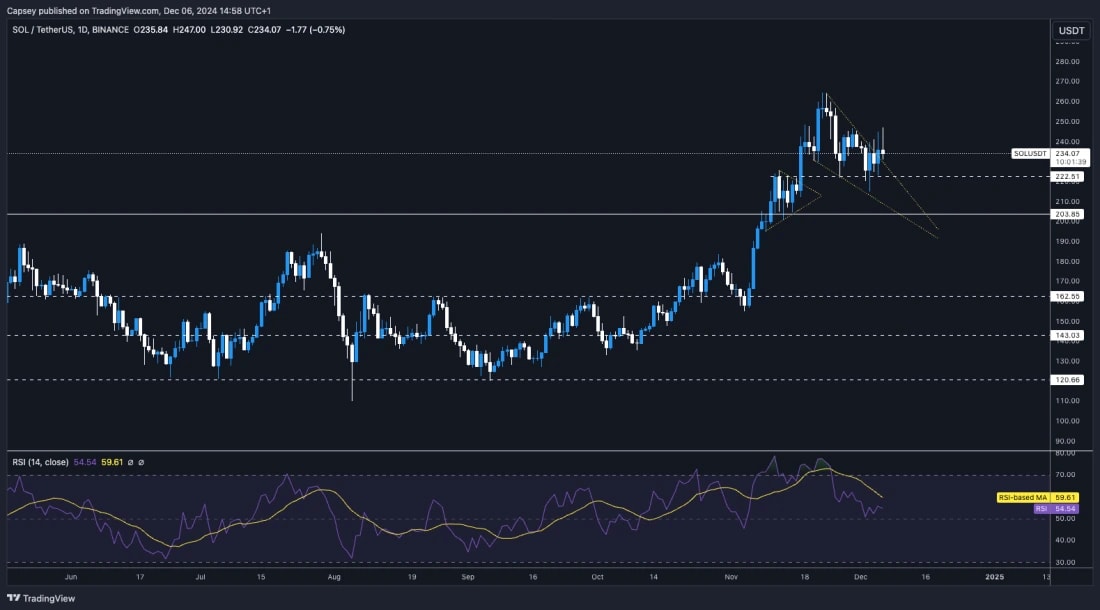
- Next Support: $220
- Next Resistance: $260
- Direction: Neutral/Bullish
- Upside Target: $260 (then $300)
- Downside Target: $210 - $220
Cryptonary's take
Overall, SOL looks good here, and despite the price recently rejecting into the $250 area, we do expect it's just a matter of time until the price breaks out of its all-time highs and heads to $300.For now, we remain in Spot as we think there may be a few more days of range-bound action as the market shakes off yesterday's flush out. We do expect that SOL could break down all-time highs, potentially as soon as within the next 7-10 days.
WIF:
- WIF has attempted a break out of its downtrend line. However, the price continues to remain compressed between its major horizontal support and resistance.
- The support remains in the grey box, between $2.84 and $2.97.
- The main resistance is $3.40. We're looking for a price to make a clean break out of that level.
- Price has attempted to break out today; however, so far, we've seen a rejection. If today's candle closes like this, it would be a somewhat ugly candle. However, it is close to $3.40, and we might be off to the races.
- The RSI has been compressed for a few weeks now, and it has settled in the middle territory of printing 53. This leaves room for the price to move in either direction.
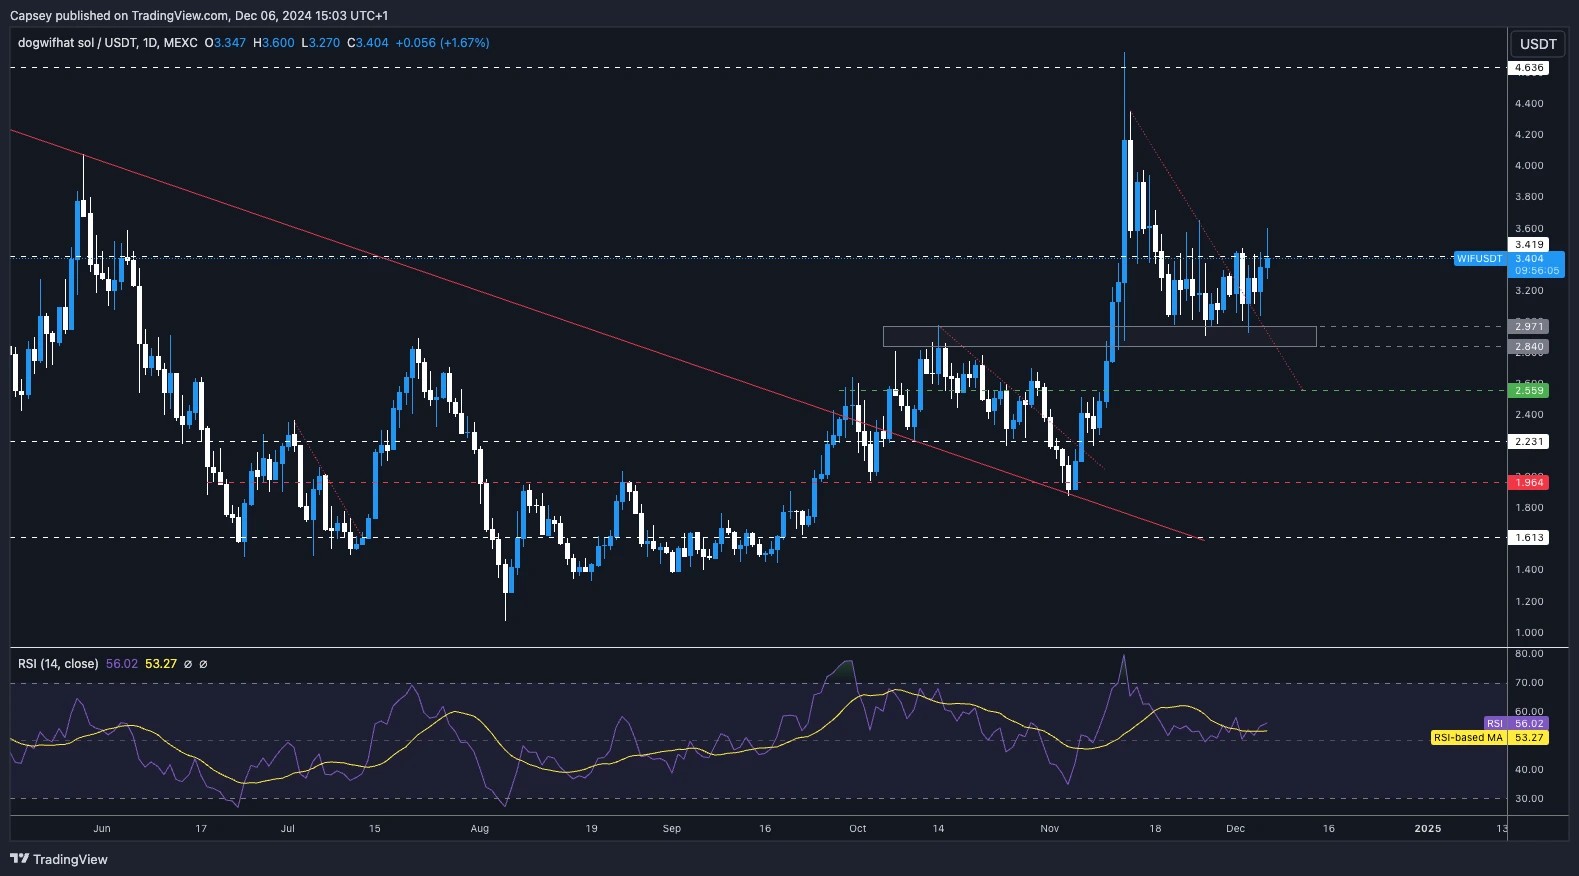
- Next Support: $3.00
- Next Resistance: $3.40
- Direction: Neutral/Bullish
- Upside Target: $3.40 (then $4.00)
- Downside Target: $2.84 - $2.97
Cryptonary's take
WIF has been compressed for a while, and whilst it remains range-bound, we just watch it. However, we are looking for a breakout or a breakdown of the key levels. We are expecting that the breakout will come to an upside. The key level we're looking for is $3.40. A positive and clean close above that level, and WIF probably moves swiftly onward towards $4.00.For now, we remain in Spot, and we're just patiently waiting and watching WIF here. Not looking to take any action.
POPCAT:
- In a very similar situation to WIF, the price is just rangebound between $1.20 and $1.40.
- For POPCAT, the key level for the rice to comfortably close above is $1.40. Over the last few days, we've seen Price attempt this but reject it a few times.
- On the downside, the key support remains the grey box between $1.13 and $1.19. We expect this zone to hold if the rice breaks down again.
- The RSI is low on POPCAT at just 46, so there is room for price to go either way. We do, fortunately still have a hidden bullish divergence that is now playing out. That could be what sends the price back to $1.60.
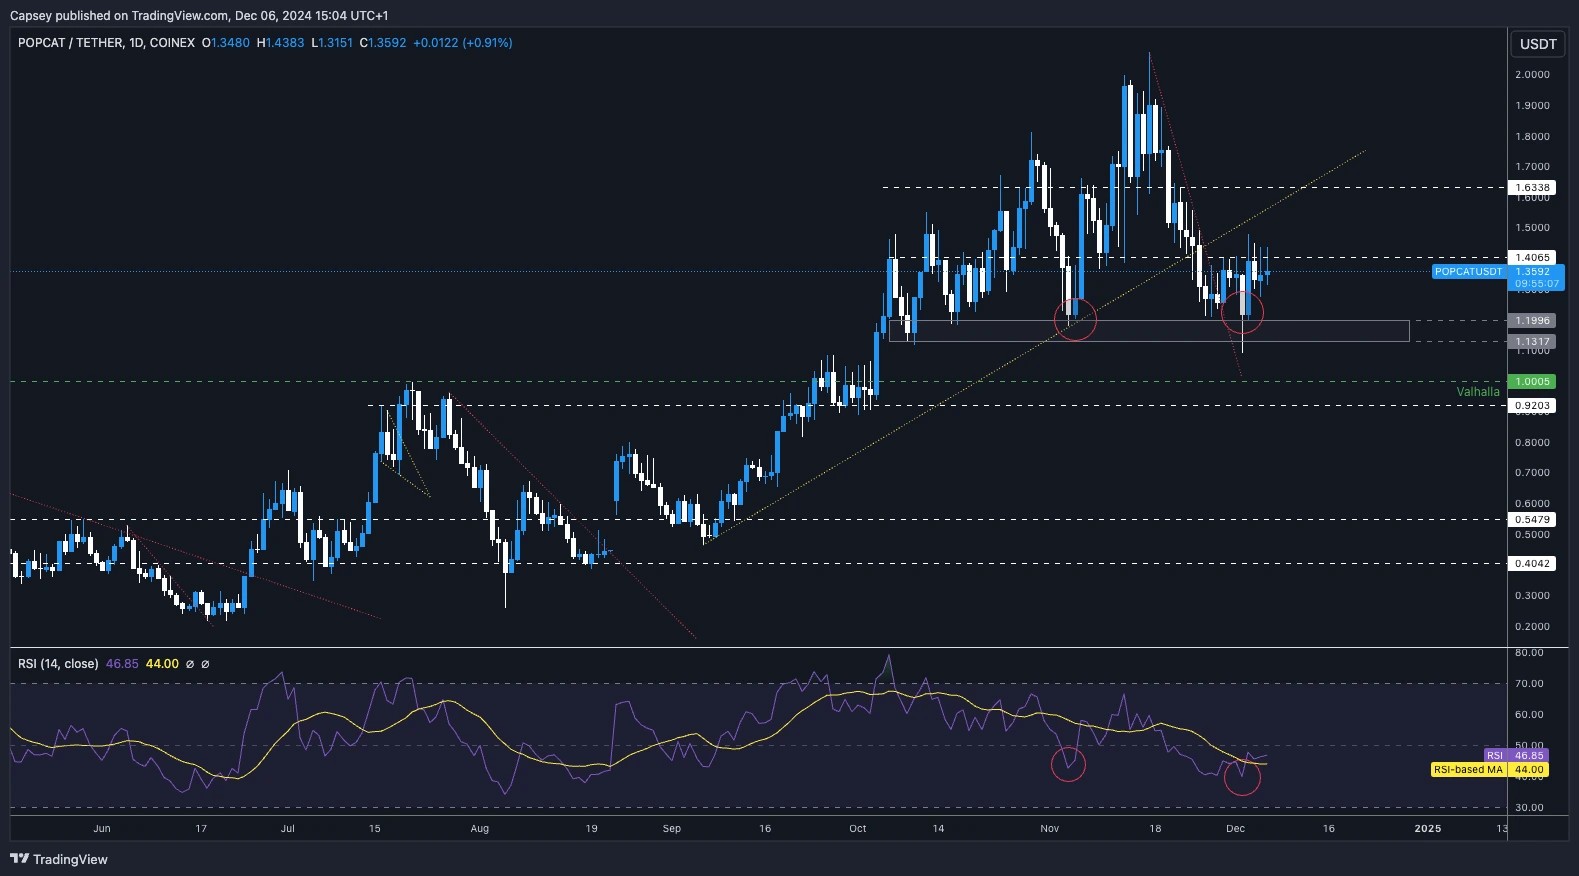
- Next Support: $1.20
- Next Resistance: $1.40
- Direction: Neutral
- Upside Target: $1.40 (then $1.60)
- Downside Target: $1.13 - $1.19
Cryptonary's take
POPCAT remains at a crucial point. Whilst it's out of the main uptrend and below the $1.40 horizontal resistance, POPCAT may struggle for flows, and traders might look for other opportunities.It's really important that POPCAT reclaims the $1.40 level. However, as long as POPCAT can hold above $1.20, there's no panic from us over here.
We expect POP to remain range-bound, and if it does break out to the upside, that'll likely be due to it being dragged up by the rest of the market. For now, we remain holding Spot bags.
SPX:
- SPX bounced from the main horizontal support at $0.59, and the price has now moved into the next major horizontal resistance at $0.72.
- Price is also battling at the main downtrend line and looking for a breakout of that level.
- The $0.75 area is tricky for the rice to overcome due to the downtrend line resistance and the horizontal resistance, but the price action looks positive so far.
- If the price does break down, we would expect the $0.57 to $0.59 level to hold as a strong support zone for the price.
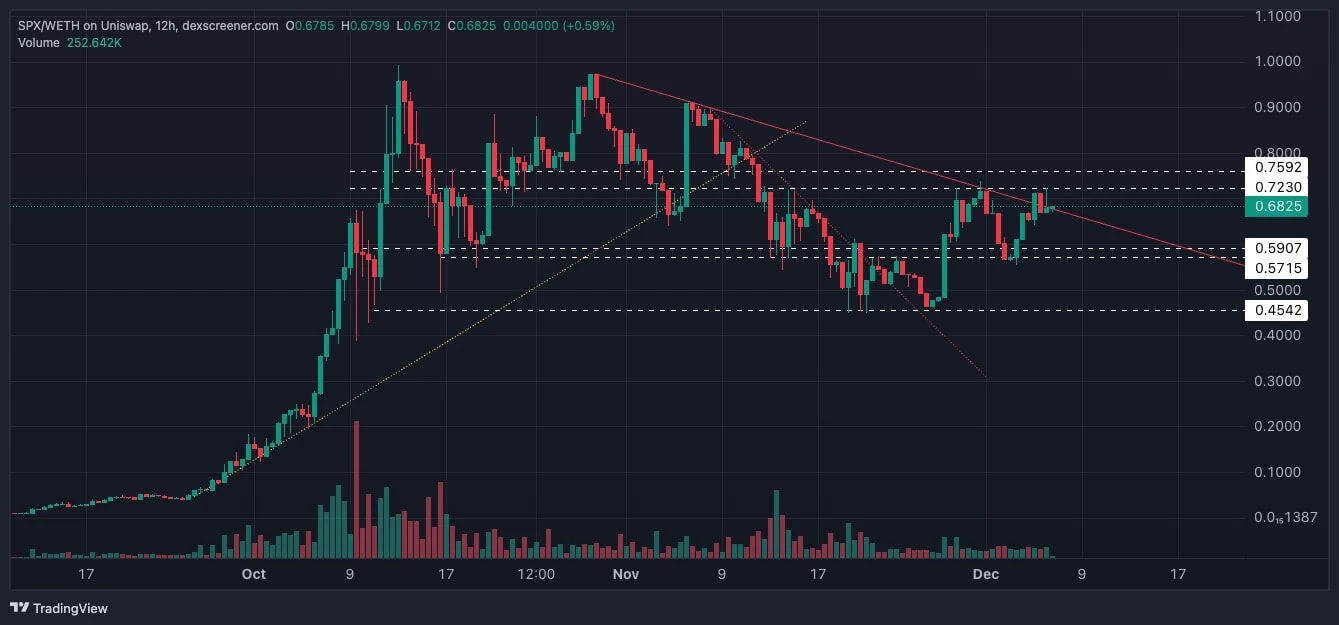
- Next Support: $0.59
- Next Resistance: $0.75
- Direction: Neutral/Bullish
- Upside Target: $0.75 (then $0.90)
- Downside Target: $0.57 - $0.59
Cryptonary's take
Chart-wise, SPX looks positive here, particularly considering that it's battling at a number of resistances, but the price is holding up well. If the price can break out and retest $0.75, this would set up a move to test into the $0.90 level. Let's see how the price reacts/holds up over the weekend.Recommended from Cryptonary


