Save 23% ($351) & Get a Free 1-1 Call with our Team ⏰ : 0d 2h 59m 43s
BTC, ETH surge, leaving meme coins stuck in neutral
As BTC nears a critical resistance zone and ETH displays bullish momentum, SOL remains stuck in its price range. Meanwhile, WIF and POPCAT signal potential volatility, and SPX shows mixed signals. Let’s dive into the latest market movements!
Disclaimer: This is not financial or investment advice. You are responsible for any capital-related decisions you make, and only you are accountable for the results.
BTC:
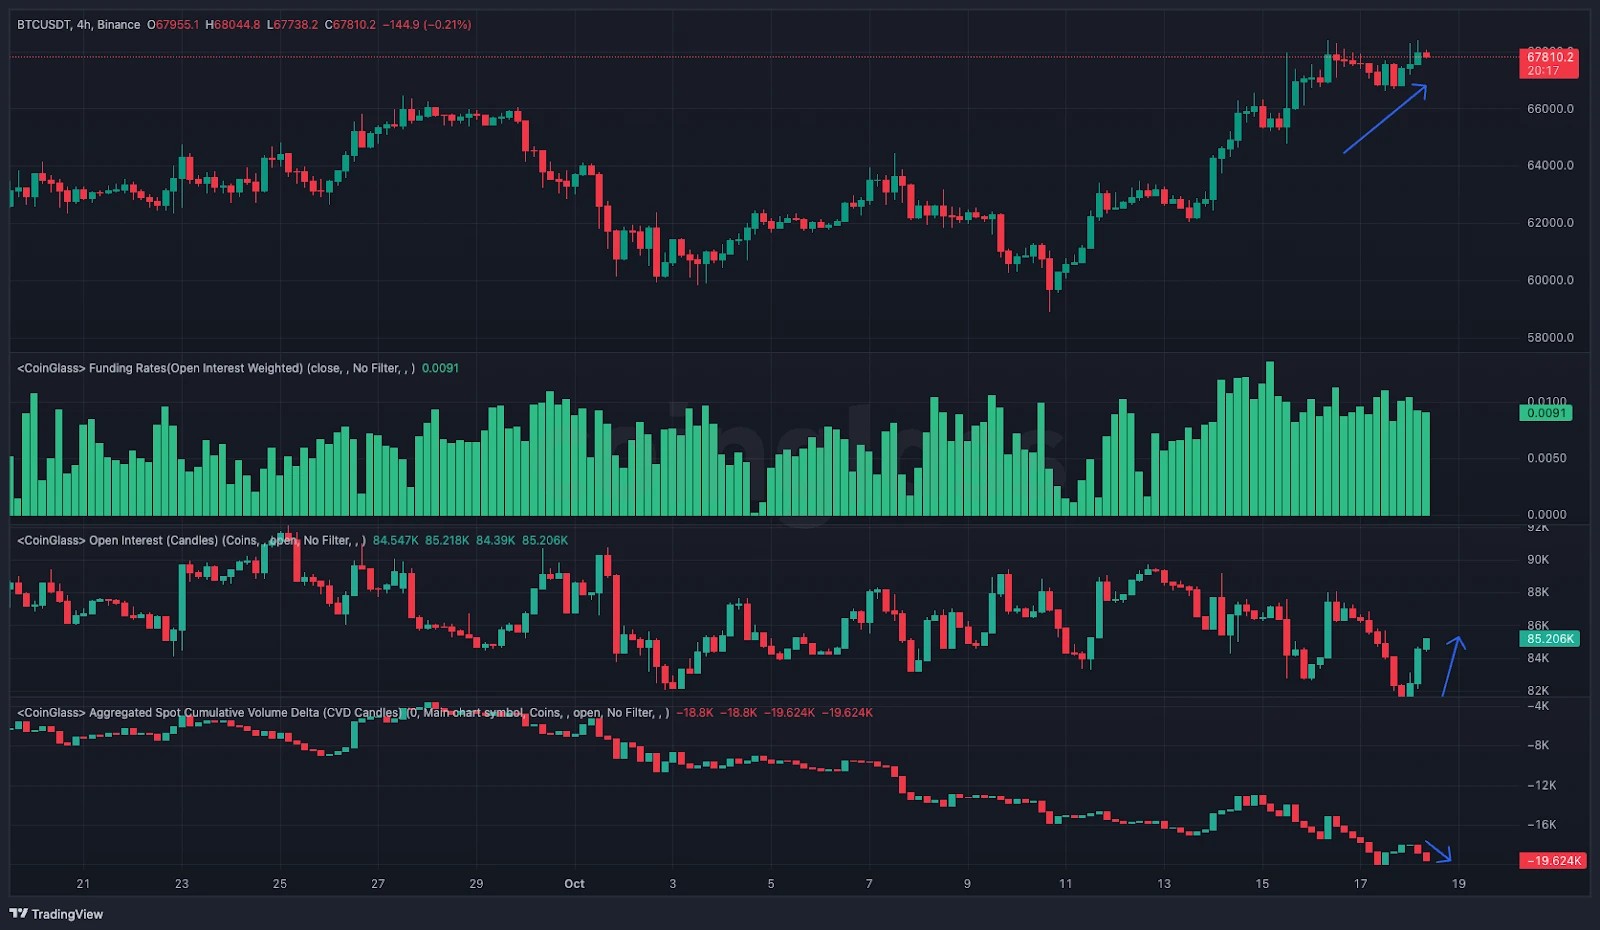
- Whilst funding rates remain positive and open interest has increased from the local lows, the Spot CVD is showing net selling due to this price increase. This Spot selling isn't in large volumes, but it's been downtrending since BTC moved up to $66k.
Technical analysis
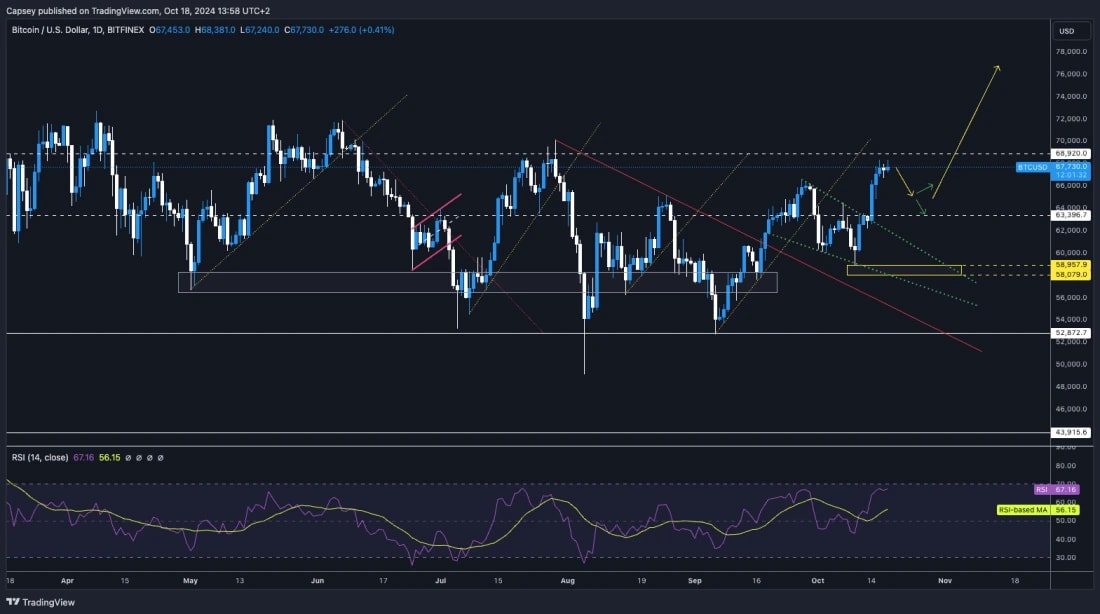
- Price has broken out from the local resistance of the top border of the descending wedge and the local horizontal resistance of $63,400.
- Price is now at the upper end of the 7-8 month price range, and prodding into the $68,000 to $68,900 horizontal resistance zone.
- Beyond $69k, the price is essentially breaking out, and things can get exciting.
- To the downside, $63,400 should act as new major support, with $66,000 a local level of support.
- The RSI is at 67, which on the Daily timeframe is very close to being overbought. The oscillator hasn't been this overbought since mid-July.
- Next Support: $63,400
- Next Resistance: $68,900
- Direction: Bearish/Neutral
- Upside Target: $68,900
- Downside Target: $63,400
Cryptonary's take
Price action has been really strong, particularly considering we're now just a few weeks out from what investors consider a very uncertain event - the US Elections.However, with Trump's odds improving in the betting markets following Harris' car crash Fox News interview, risk assets, and Crypto have begun pricing in a Trump win.
In the short-term, it's possible that BTC will correct this, possibly targeting $66,000 or, worse, $63,400. We're now at the upper resistance in the larger range with the oscillator now close to overbought.
BTC still feels like a coiled spring, ready to pop and go higher, however we're sceptical that this happens pre-Election. However, beyond that, we think a Trump win could be that catalyst that gets us well beyond new all-time highs.
ETH:
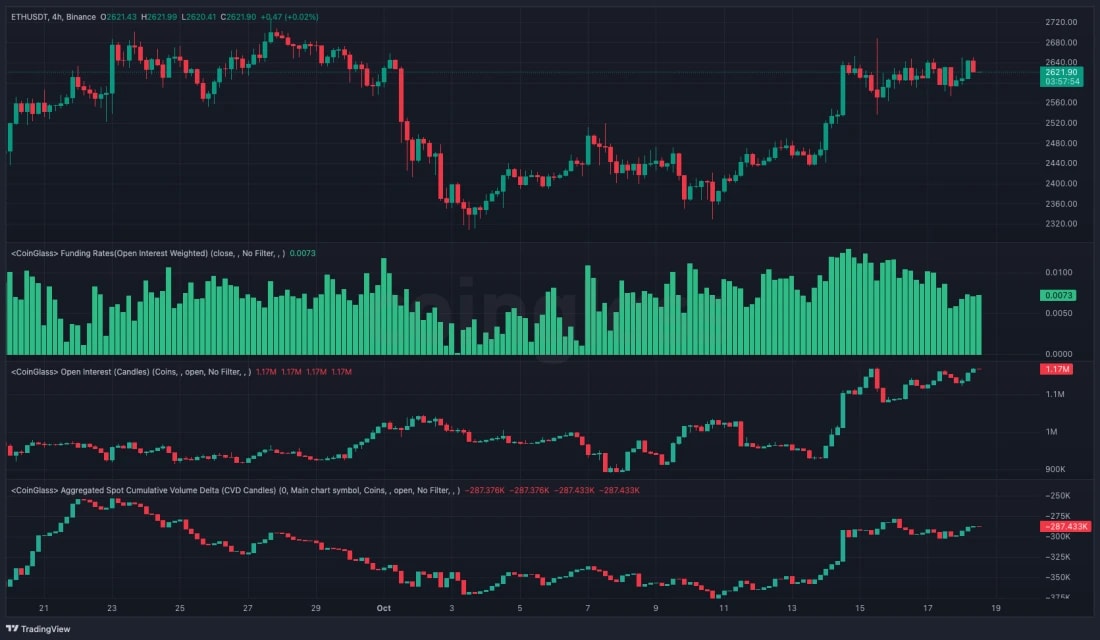
- ETH's Open Interest is at all-time highs, and despite Funding decreasing slightly from positive levels (arguably a good sign), the Spot CVD has increased and is close to monthly highs.
- The price increase has been supported by Spot buying, not just leveraged Longs. This is positive for price action.
Technical analysis
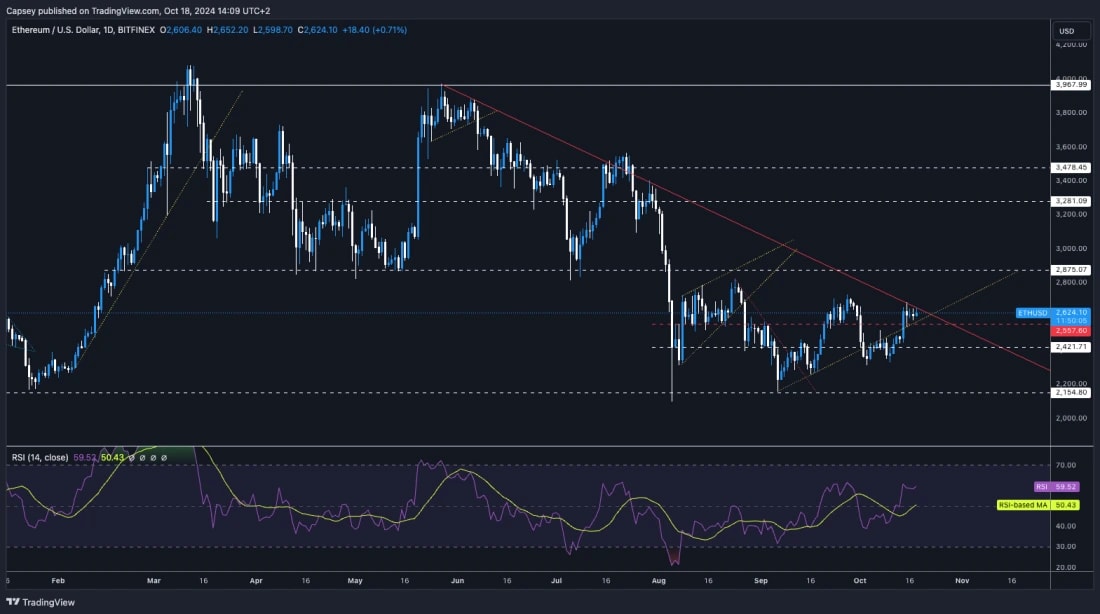
- Price has reclaimed the local uptrend line and is now above the local horizontal level of $2,557.
- Price is now also butting in to the main downtrend line and forming a bullish pennant. The breakout target of this would be $2,725.
- The main resistance above price is at $2,875, although there is a local level at $2,725.
- To the downside, we'd expect the range between $2,420 and $2,557 to provide ample support.
- The RSI is still relatively in the middle territory at 59, so it is not yet close to being overbought.
- Next Support: $2,557
- Next Resistance: $2,725
- Direction: Bullish
- Upside Target: $2,875
- Downside Target: $2,557
Cryptonary's take
From both a mechanics and TA perspective, ETH looks great here. If BTC holds up, we would expect ETH to break out of its main downtrend line and potentially swiftly head higher to $2,875.SOL:
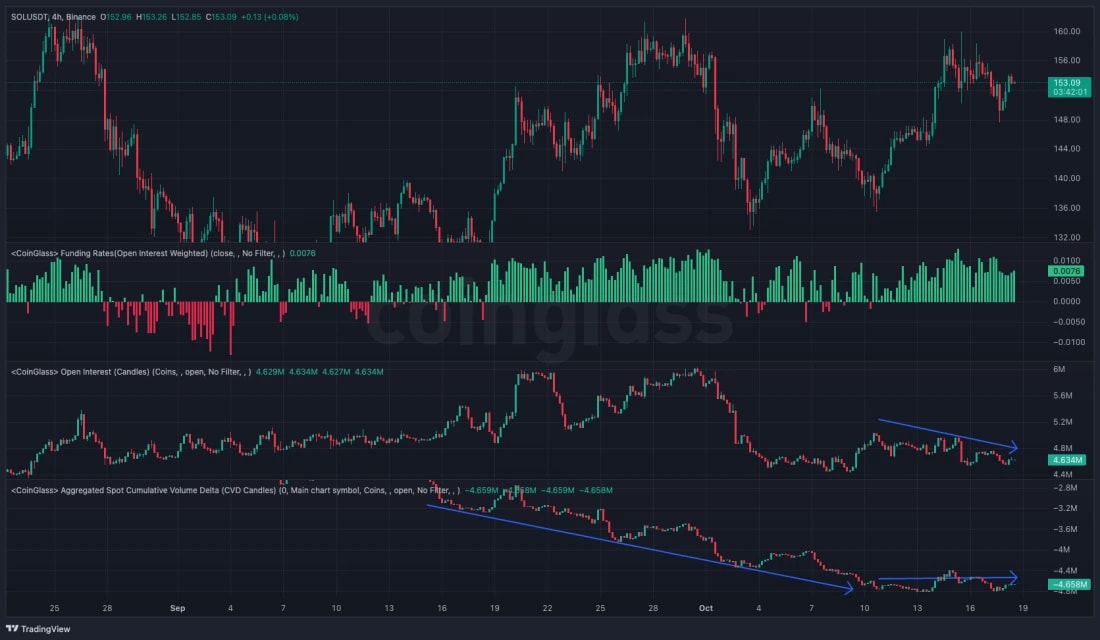
- SOL is interesting from a mechanics viewpoint here.
- Open Interest fell significantly a month ago and has remained relatively flat since (not much new leverage is being put on here).
- Funding rates have increased but aren't meaningfully positive, whilst Spot CVD has trended lower and has remained flat since.
- There isn't huge interest from buyers in SOL currently. Perhaps we see this change on SOL convincingly breaking above key resistance levels.
Technical analysis
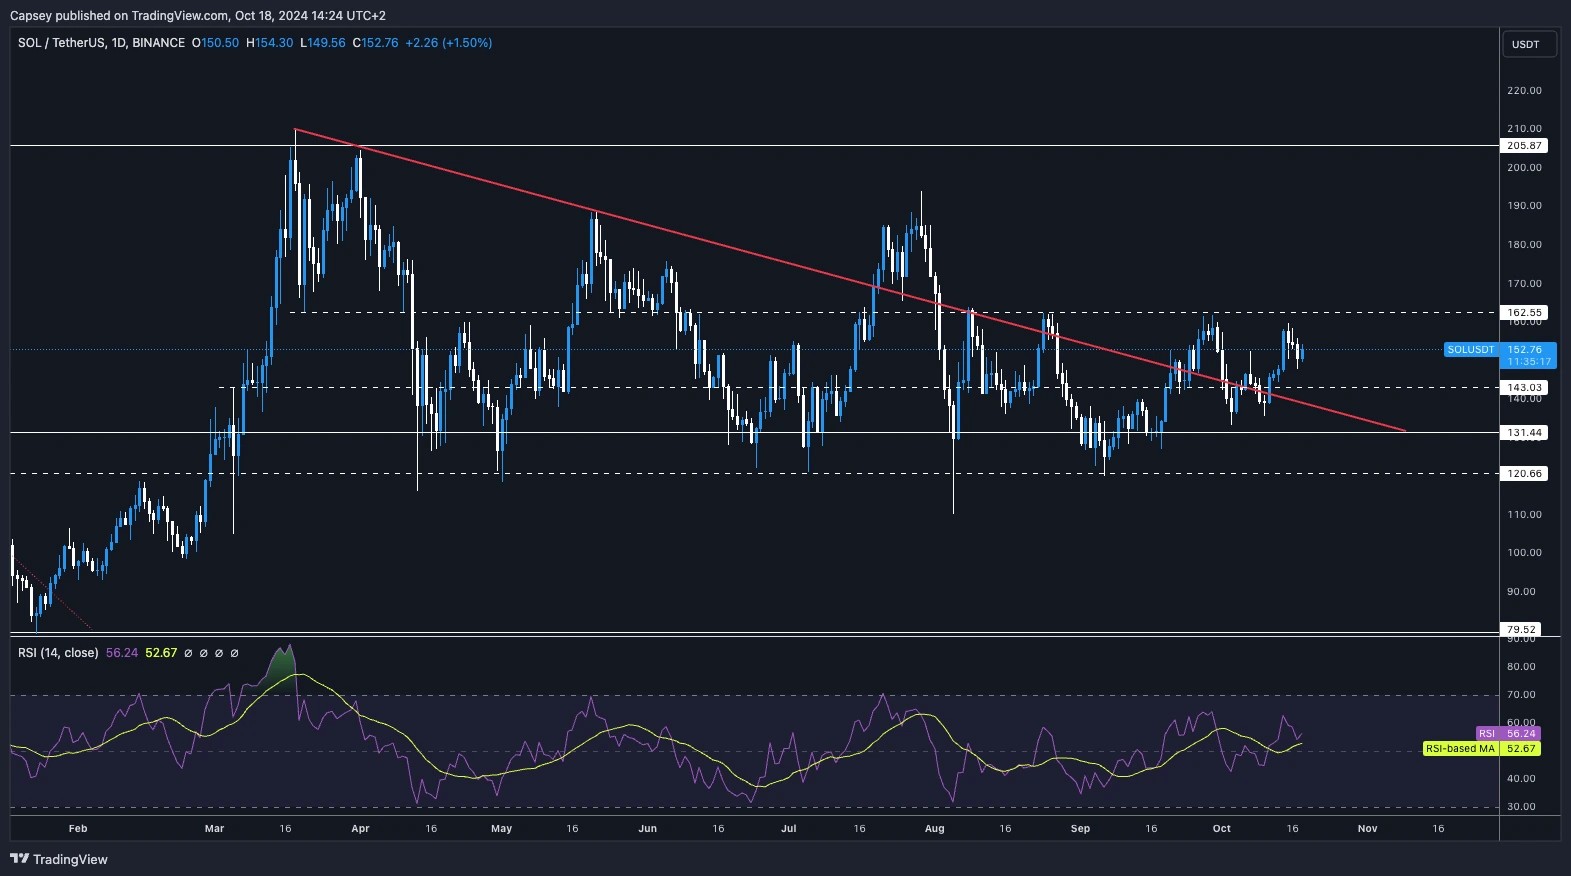
- SOL is now in the upper range of its larger price range between the lows at $131 and the highs/resistance at $162. The $143 should act as a middle level/support for SOL on the local timeframes.
- The horizontal resistance is $162. A breakout of this level might see more volume come into SOL, and you could see a swift move up, potentially testing $190.
- To the downside, we expect the support range between $120 and $131 to act as major support for the price.
- The RSI is back in the middle territory and has somewhat just been sitting there for quite some time now.
- Next Support: $143
- Next Resistance: $162
- Direction: Neutral
- Upside Target: $162 ($190 upon breakout)
- Downside Target: $131
Cryptonary's take
SOL remains super boring here to be honest as it is still range-bound between $131 and $162. However, a break out of the range could be quite volatile as it would likely see volume come in and chase the move higher (assuming it is higher, which we believe it will be).Our expectation is that we probably just continue to chop over the next 3-7 days. A break out beyond $162 would be the signal to get super bullish again. Until that happens we will sit tight and remain patient in our Spot bags.
WIF:
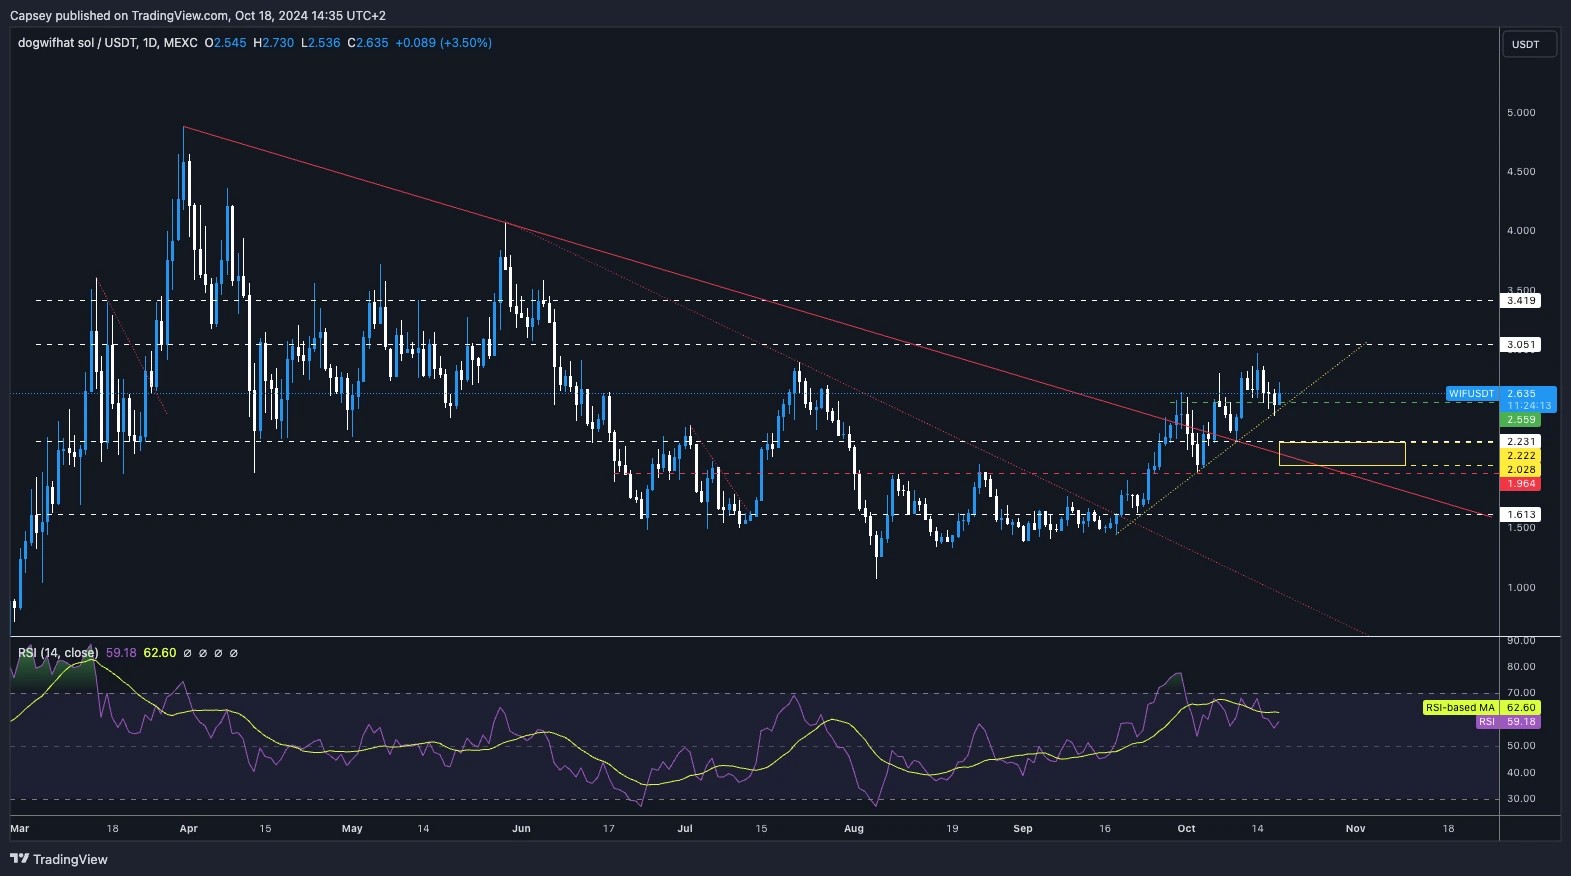
- WIF has broken out of its main downtrend line and gradually pushed higher, testing just shy of $3.00 a few days ago.
- Price is holding a local uptrend line nicely, and the price has bounced off local support at $2.55.
- To the upside, the main resistance remains at $3.05.
- The strongest support range is between $2.00 and $2.20 which is where we've placed a Yellow box that we'd be aggressively bidding if price reached those levels.
- The RSI has pulled back slightly having pushed in to overbought territory and printed bearish divergences. This pull back to mid-territory is healthy and good to see, even though we may see the pullback extend slightly further.
- Next Support: $2.55
- Next Resistance: $3.05
- Direction: Neutral/Bearish
- Upside Target: $3.05
- Downside Target: $2.20
Cryptonary's take
As of 4 days ago, WIF had doubled in the last month, so if we had a slight pull back or a small period of consolidation, we'd see that as very healthy and necessary for price to continue in a sustainable uptrend. If price were to pull back and retest close to $2.20, we'd be buyers at that price. If price were to fill the Yellow box, we'd be aggressive buyers there.It's possible that price bounces off this local support and moves up again, however we think it's more likely price breaks the local uptrend and retests the $2.20 area. In our view, this would be a fantastic long-term buying opportunity.
POPCAT:
- Overall, we're quite impressed that POP is back to $1.30 and now seemingly more settled in this area.
- Divergences are what most stand out to us here. Price put in a higher high, but a lower high on the oscillator (bearish divergence). But, price put in a higher low, and a lower low (hidden bullish divergence).
- So, there are contrasting signals on the divergences. Price will likely break in a volatile manner, whether that be up or down, as two diverging divergences are at play here.
- The major resistance is at $1.50.
- The major support is between $0.92 and $1.10, although there is a local level at $1.19.
- The RSI is now back to middle territory which is great to see, although note, we have multiple divergences at play here.
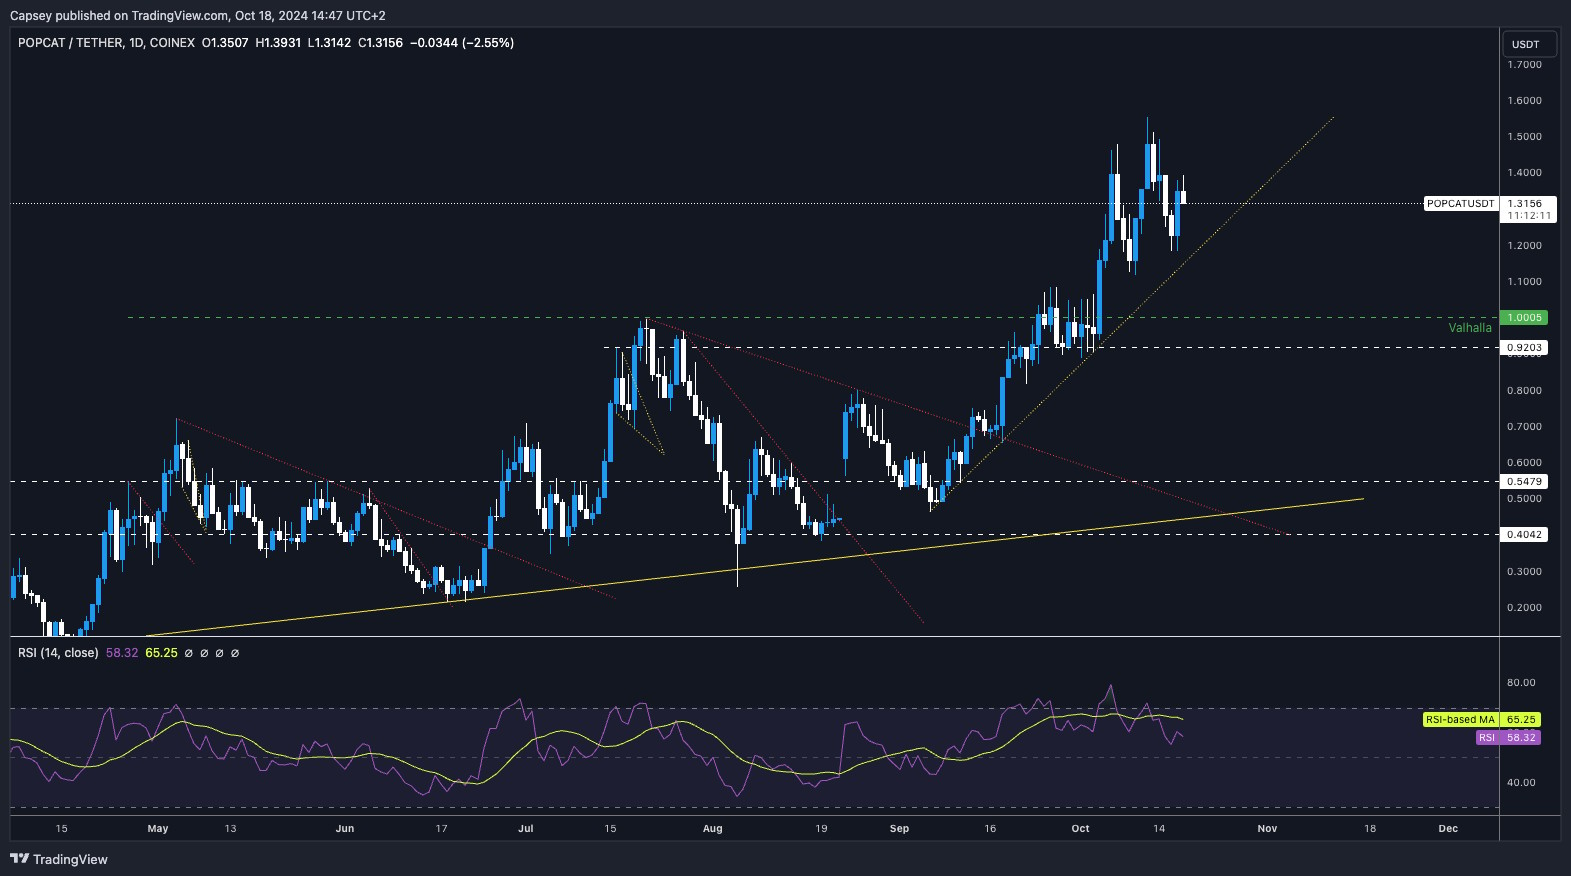
- Next Support: $0.92 - $1.10
- Next Resistance: $1.50
- Direction: Neutral/Bearish
- Upside Target: $1.50
- Downside Target: $1.10
Cryptonary's take
In the short term, we're very unsure of the direction of price here. There are contrasting divergences at play, which could make the next move likely volatile.Overall, we're pleased that POPCAT seems to be settled and building a range well above $1.00 - just 6-10 weeks ago, this range was between $0.40 and $0.65. For now, we remain patient in Spot bags and we're not looking to take any action for now, particularly as we're unsure about short-term price action. Sorry guys.
SPX:
- Note this is a 4-hour timeframe chart.
- Charting wise, SPX is really clean, we can clearly see how it respects trend lines in terms of support and resistance.
- Price broke down from the bearish pennant and continued it's downtrend until it filled our Yellow Buy box. Unfortunately the fill was a super quick move so it was very difficult to buy.
- Price has now been rejected off the underside of the uptrend line and the horizontal level of $0.76. $0.76 is the resistance level price that needs to clear above.
- To the downside, the supports are hard to work out, but the obvious levels is the range between $0.41 to $0.55. Although, it's arguably higher, between $0.48 and $0.55.
- We do note volumes are downtrending.
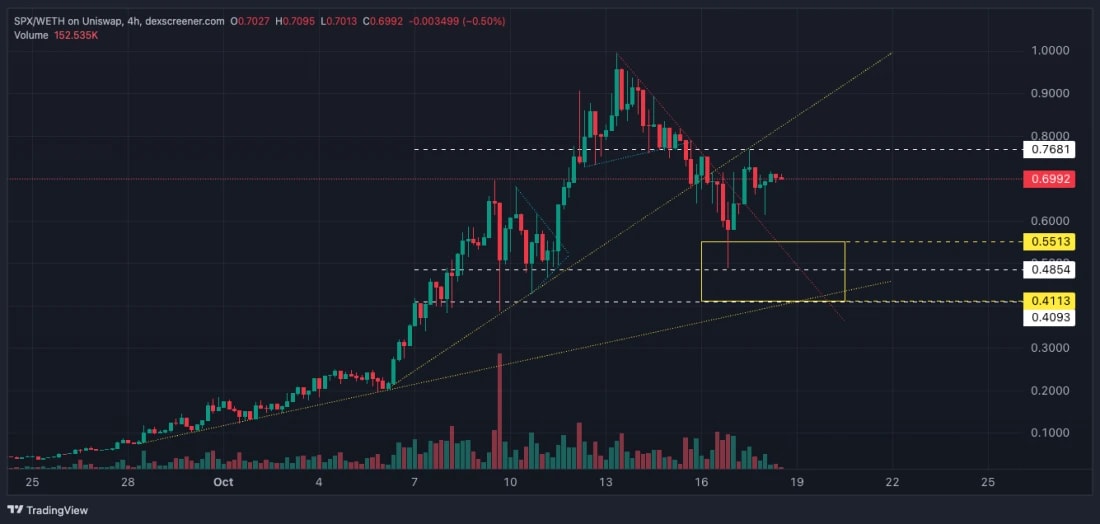
- Next Support: $0.48 - $0.55
- Next Resistance: $0.76
- Direction: Neutral/Bearish
- Upside Target: $0.76
- Downside Target: $0.55
Cryptonary's take
Some of you guys will dislike me and call me a "sideliner," but SPX looks most likely to revisit the Yellow box or at least be close to that area. If you're under-positioned or have no position, we'd add between $0.40 and $0.55.A break above $0.76 would invalidate our short-term these and would likely see price run back to all-time highs.
Recommended from Cryptonary


