Save 23% ($351) & Get a Free 1-1 Call with our Team ⏰ : 0d 2h 59m 43s

In this report:
- Macro update following the data.
- On-Chain update.
- Cryptonary's Take.
Disclaimer: This is not financial or investment advice. You are responsible for any capital-related decisions you make, and only you are accountable for the results.
Macro update
Today, we had the Non-Farm Payrolls and the Unemployment Rate come out. Non-Farm Payrolls came out super low at just 12k jobs added in the US and well below the forecasted 113k. However, this is likely due to the hurricanes and the strikes that we saw last month in the US.The market has, therefore, somewhat shrugged this print off. This might be because Initial Jobless Claims have continued to be contained in the 200k region, i.e., not many people claim unemployment benefits. Today, we saw the unemployment rate come in at 4.1%.
So, with no meaningful uptick there, the market has taken the information as nuanced, but the underlying is still good. Therefore, the market has taken the data today in its stride. This is positive for risk assets and, therefore, positive for us Crypto Kids!
The data also continues to support the FED's cutting cycle. The data is positive but it's not accelerating. So the FED still need to bring the Interest Rate down and into more even balance with inflation. Therefore, we fully expect another 25bps Interest Rate cut at next week's FED Meeting, and likely another 25bps cut at the December Meeting. Again, all good from a risk assets point of view here.
On-chain data special
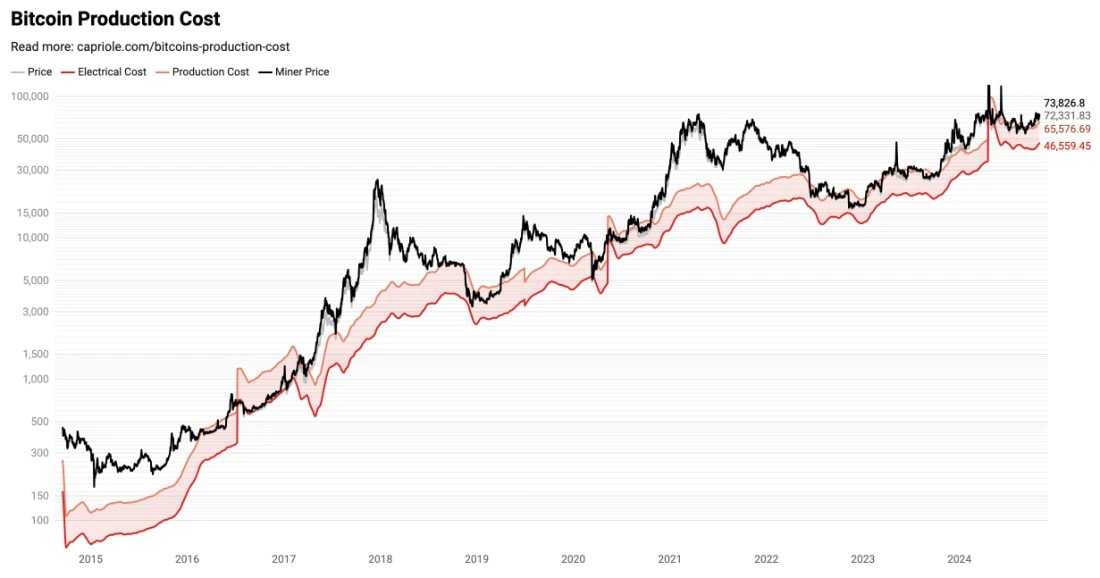
In this on-chain update, we're going to focus on how today compares to other times when BTC has risen close to price all-time highs. Does today look overheated? Or, is today a healthier setup that suggests further upside may be ahead of us. Let's dive in to it.When assessing price from an on-chain perspective, one of the first things we can look to is, are miners currently comfortable, or is the BTC price low and therefore putting the miners under stress?
We can see in the below that this metric looks similar to how it looked at the last Halving (May 2020). Price is sat just on top of the Production Cost (for miners), but it hasn't yet substantially run to the upside.
Bitcoin production cost (from @Capriole):
With BTC now pushing close to all-time highs, you'd expect the Short-Term Holders to be in big unrealised profits and for the market to be frothy here.
But, we can see below that STH-Net Unrealised Profit/Loss is in the Orange area, which is very low considering the price is pushing close to all-time highs.
It's positive to see that this metric isn't in an overheated area and, quite frankly, not even close to becoming overheated. This suggests that there's ample room for further upside.
STH-NUPL:

So, miners aren't under major stress here, but they're also not super profitable here either. Alongside this, the price is close to all-time highs, and the Short-Term Holders Net Unrealised Profit/Loss remains subdued, even though you'd expect it to be close to being overheated with a price this close to all-time highs.
The above suggests that there's room for the price to go higher over the coming months. Let's have a look at some key pricing models to see if the price is close to being overheated or where the price may become overheated if it reaches certain price points.
For this, we'll start with the MVRV as it remains one of the more highly respected pricing models. In the below chart, we can see that cycle tops are downtrending on the MVRV Z-Score. This may indicate that this cycle sees a score of 4 on the MVRV reached.
Currently, the MVRV is just shy of 2. We have also highlighted (using the red circles) the times when the price has broken above its last all-time high (excluding Nov 2022, as that was the anomaly from the on-chain data).
We can see in the prior times, when the price broke above its last all-time high, the MVRV Z-Score is approximately at a value of 3. It's now 2, suggesting that we're starting this potential move higher from a deeper level, and this may provide room for the price to go substantially higher.
MVRV Z-score (edited chart):

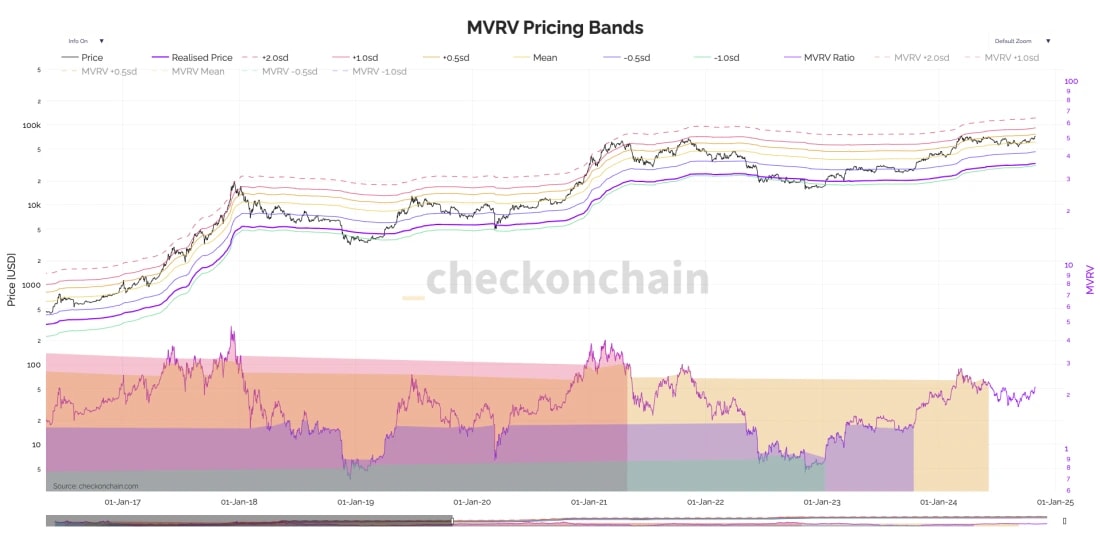
If we look at MVRV Price Bands, we can see that the price is still relatively low compared to previous standard deviation moves. In both the 2017 cycle top and the 2021 cycle top, price reached the +2.0 standard deviation. The +2.0 standard deviation is currently at $122,900.
MRVR pricing bands:
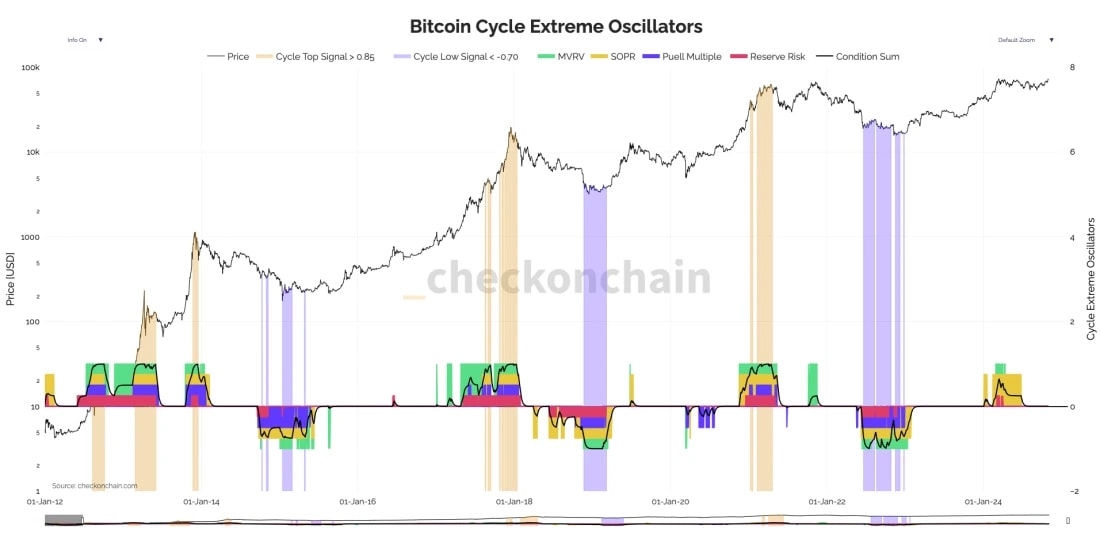
Another metric I (Tom) personally love is the Bitcoin Cycle Extreme Oscillators. This chart shows us when a number of pricing models are reaching overbought or oversold territory.
When this metric shows all the pricing models it contains reaching overbought levels, that may indicate a cycle price top. So far this cycle, we haven't seen all of these pricing models reach overbought territory - no shaded yellow bands yet = likely still to come in the future.
Bitcoin cycle extreme oscillators:
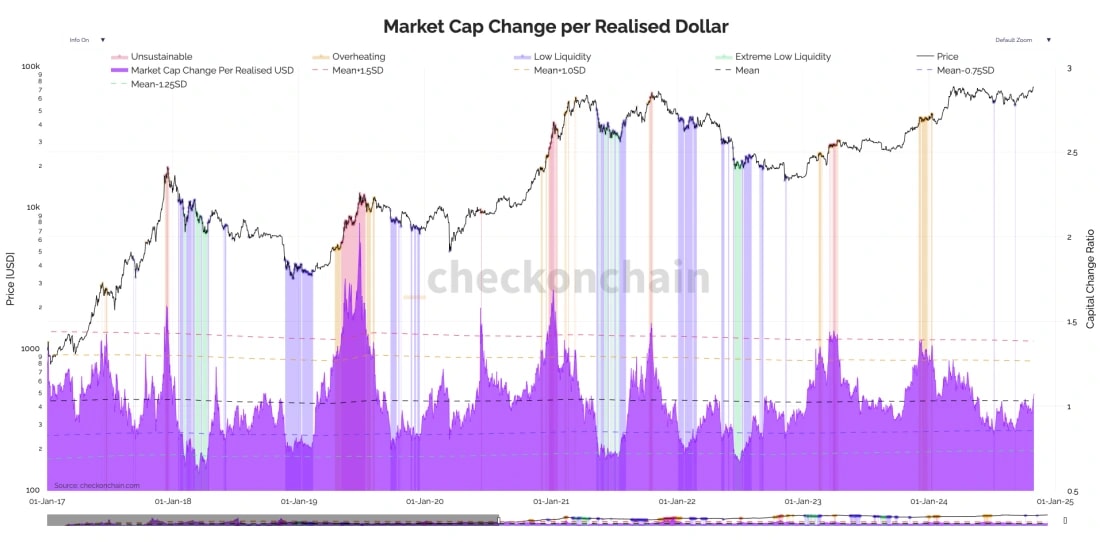
One last metric we'll look at is the Market Cap Change per Realised Dollar. In prior cycles, we've seen that price highs have come when this metric has flagged either 'unsustainable' or 'overheating'.
So far this cycle, we got a brief spell of overheating in late 2023, but throughout all of 2024, we haven't had any flashes of 'overheating' or 'unsustainable'. This suggests that there's more upside to be had for price before we reach 'overheated' or 'unsustainable' levels. A great chart, a personal favourite of mine.
Market cap change per realised Dollar:
On-chain data summary
Let's summarise the above into a few clear bullet points.- The on-chain metrics are quite subdued, considering the price is 3-4% away from all-time highs. This is positive and suggests that resistance points are higher up, giving the price room to move more meaningfully higher.
- Pricing models got slightly overheated back in Q1 24 (March). But since then, the price has pulled back/consolidated whilst the models have moved higher.
The price has cooled off over the last months, and $70k is no longer an attractive level for holders to sell it. That resistance area is now substantially higher.
Currently, the pricing models are in a middle area, nowhere near overheated. In the below, we'll list a number of key pricing models, and their 80% overheated prices and their 90% overheated prices:
- Mayer Multiple: 80% overheated is $108k, 90% is $131k
- AVIV Ratio: 80% overheated is $76k, 90% is $109k
- MVRV Z Score: 80% overheated is $79k, 90% is $96k
- STH MVRV Z Score: 80% overheated is $82k, 90% is $92K
Cryptonary's take
However you look at the above, all things point to price going higher in the coming months. A Harris win next week may alter this dynamic potentially. But, overall, we're expecting all-time highs in the coming weeks, especially if we see a Trump win.For now, we look all ok here. But, next week is a big week so let's play it day by day in terms of our assessments, but in terms of the portfolio, we remain invested, and we're very unlikely to change that outlook.
Recommended from Cryptonary


