Save 23% ($351) & Get a Free 1-1 Call with our Team ⏰ : 0d 2h 59m 44s
BTC funding rate and technical analysis today: Market overview
Bitcoin’s rising open interest and mixed funding rate suggest imminent volatility and critical support levels.

Market mechanics
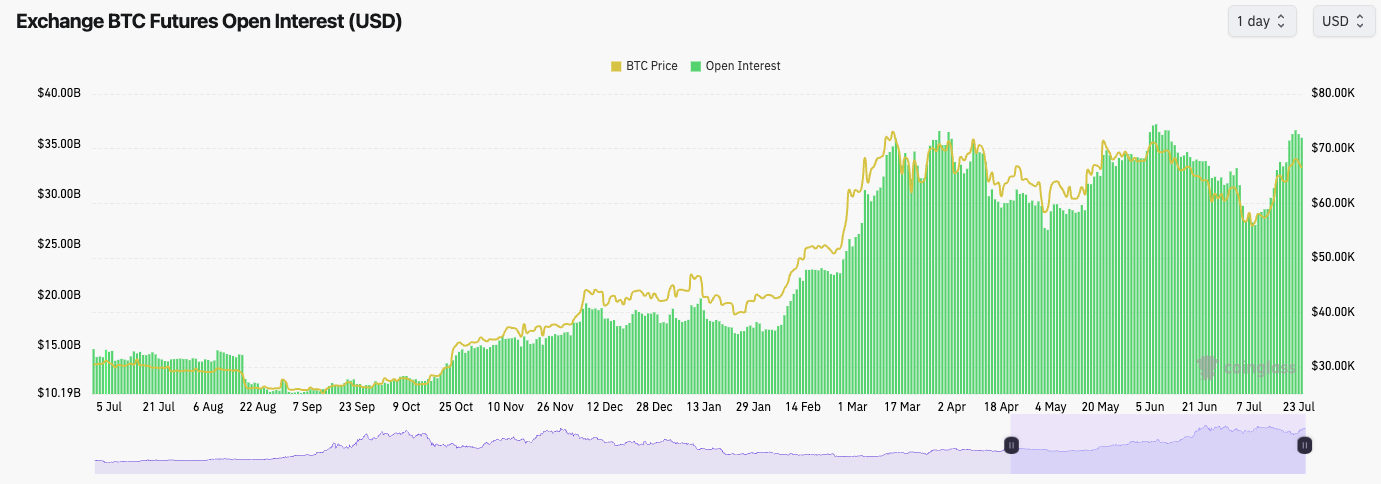
In the last few days, Bitcoin's Open Interest (amount of leverage) has returned to the highs we saw in early June and late March. On each of these occasions, the excess leverage was flushed out due to a sharp move down in price. Longs being liquidated.However, this time, the Funding Rate is positive, but it's close to flat. This means that in this leverage build-up, there is a substantial amount of Shorts built up. This opens the door to a further Short Squeeze, although now less likely due to the price being down 3% from its local highs.
Over the coming days (1-7 days), we should expect a more volatile move that will likely wipe out the Open Interest.
BTC Open Interest:
Technical analysis
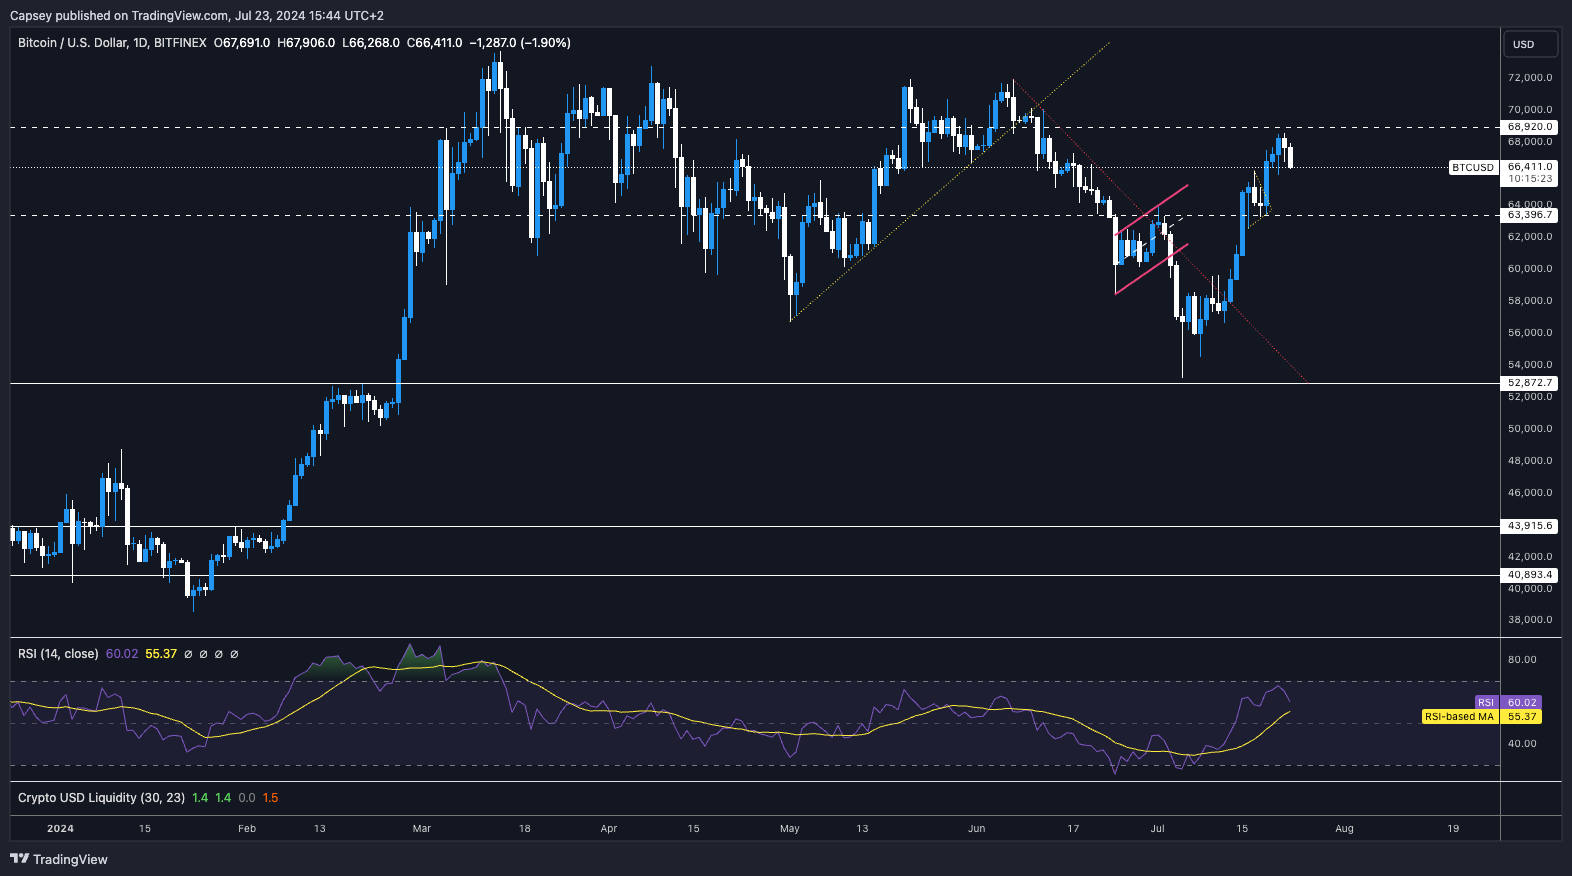
- Price has found some resistance at the horizontal level of $68,900, having risen tremendously following the breakout of the downtrend line.
- The key levels to the upside for price to break out from are $68,900 and $71,500.
- If price were to break down in the short term, we would expect the $63,400 horizontal level to hold as support. Local support is also at $65,000.
- As BTC approached the late $68,000s, the RSI approached very close to overbought territory.
- If the price dropped to $63,400 and bounced, that would begin the formation of a Head-and-Shoulders pattern (a bearish pattern). We will need to keep a close eye on this.
Cryptonary's take
The amount of leverage that has built up is now at the higher levels we've seen over the last few months, resulting in a price pullback.Now, the setup this time is different because not all the added leverage (Open Interest) is Longs, but the chances are that we get a slight flush out, which likely see price come down a tad.
If $65,000 can be held, fantastic, but we'd be open to this next move, potentially pulling back to the horizontal support of $63,400. If $63,400 is broken to the downside, then essentially, we'd have seen a lower high put in, and Bitcoin would no longer hold a bullish structure. This could then lead to a move back to $60,000. However, this would still be within Bitcoin's macro range.
Ultimately, we believe $63,400 is enough of a support, that if it is retested, BTC can hold above this level and then grind on higher from there.
So, we expect a slight pullback in the coming days, and then we believe that Bitcoin can recover from the weekend. Let's see.
Recommended from Cryptonary


