Save 23% ($351) & Get a Free 1-1 Call with our Team ⏰ : 0d 2h 59m 44s
Disclaimer: This is not financial or investment advice. You are responsible for any capital-related decisions you make, and only you are accountable for the results.
BTC:
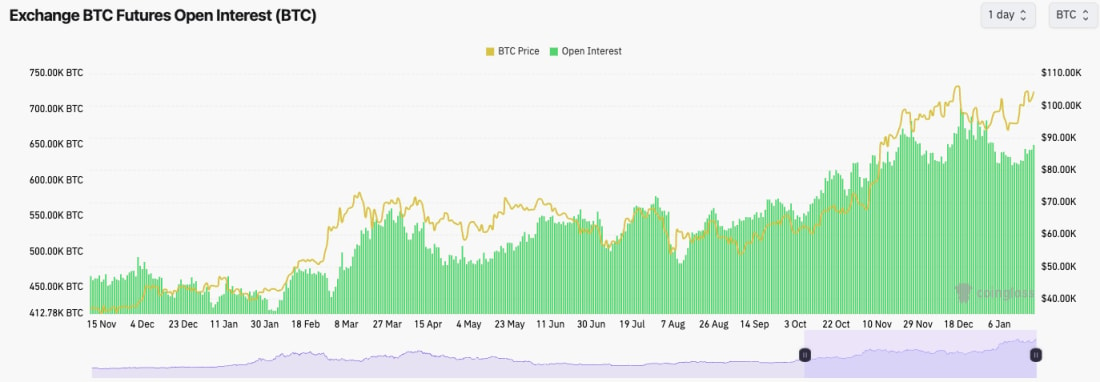
- BTC's Open Interest has crept up slightly, but it still remains quite a way from the highs we saw in mid-December.
- The Funding Rate is at 0.01%. So it's flat, with an even balance between Longs and Shorts.
- This is a more healthy leverage environment. There aren't signs of froth, but there also remains good activity.
Technical analysis
- BTC has broken out of the downtrend line, and the price has rejected roughly into the prior price all-time highs.
- But, when the price pulled back to retest key levels, it bounced nicely off of the horizontal support of $98,900, the old horizontal resistance. Price has also used the psychological level of $100k as support.
- The major resistance to the price being cleared above is $108k.
- The local resistance is at $105k
- If the price were to break down below $98,900, there are quite a few supports in the $ 90k range. The first being at $95,700 and then $91,500.
- BTC has broken out of its downtrend on the RSI, and it has come back, retested it, and moved higher. Alongside this, it's also above its moving average. Positive.
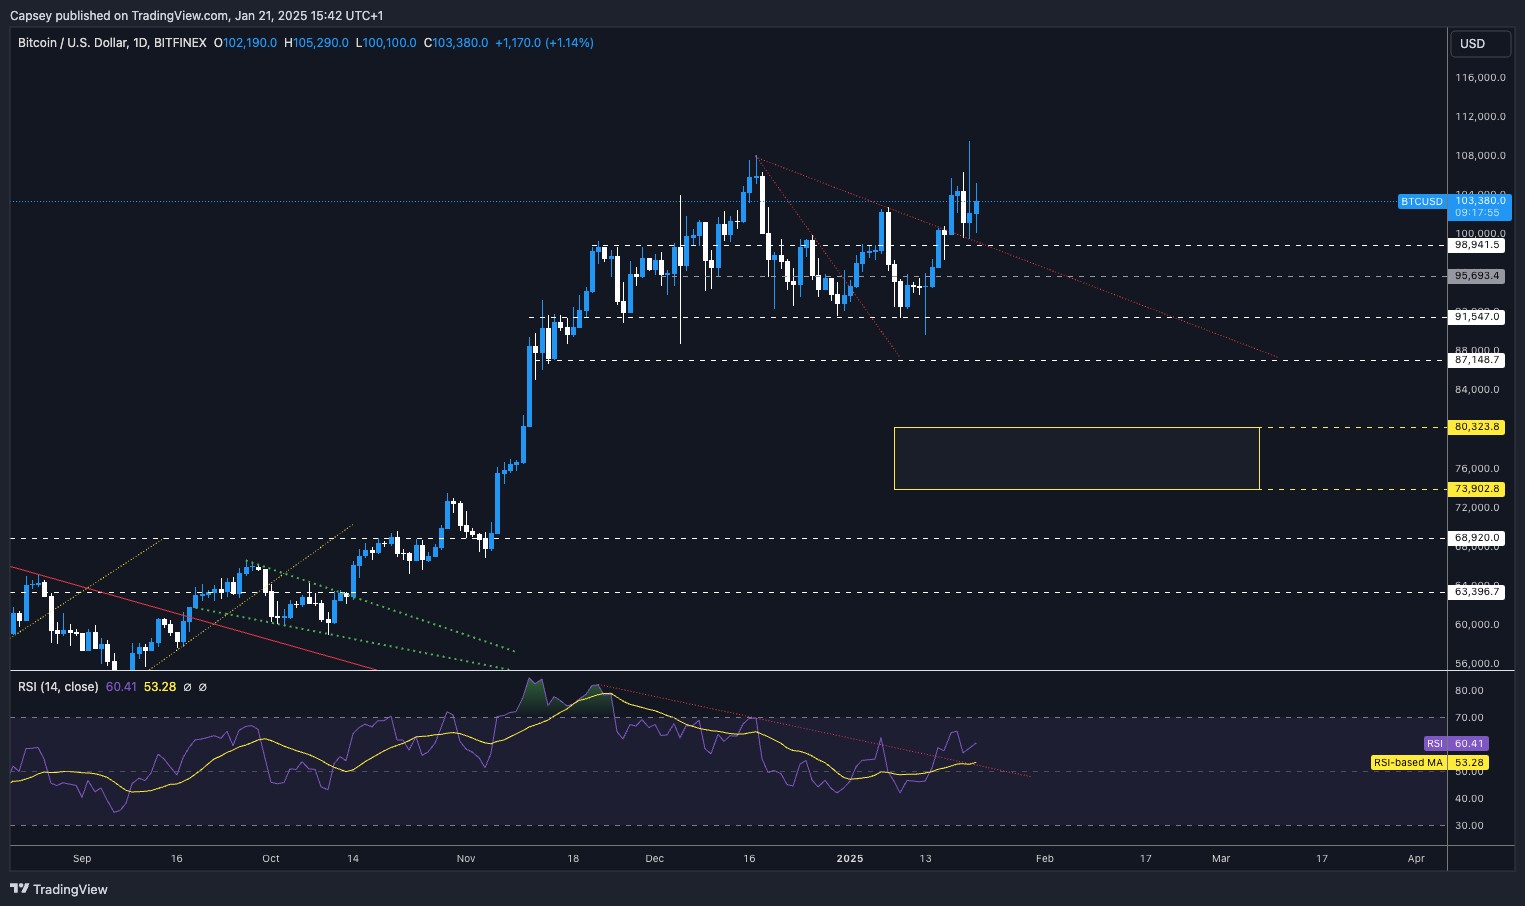
- Next Support: $100,000
- Next Resistance: $108,000
- Direction: Neutral/Bullish
- Upside Target: $108,000 (then $112k)
- Downside Target: $98,900
Cryptonary's take
BTC looks very positive here, and considering Trump didn't mention it, now that we have seen any pro-Crypto Executive Orders (as of yet), BTC has done very well to hold up at the $103k area. For now, let BTC show you its next move, either a breakout of the highs or a breakdown. The rest of the market feels a tad flat, and BTC, holding at the price it's at, seems to be what's holding the rest of the market up for now.My (Tom) personal feeling is that I'm just not sure here. I feel like BTC can come down a bit, almost a sell the news now, and we're not sure where the next major catalyst is. But at the same time, we're expecting a positive year, and in the short term, Trump can issue an Executive Order, and everything turns around. Tricky spot here. Best off just being passive and seeing how this week and price action unfolds.
I'm not scared/worried here, so let's definitely clarify that. I'd just rather get some clarity before making my mind up on positioning. But overall, BTC has held up well, considering no Executive Orders have come (yet).
ETH:
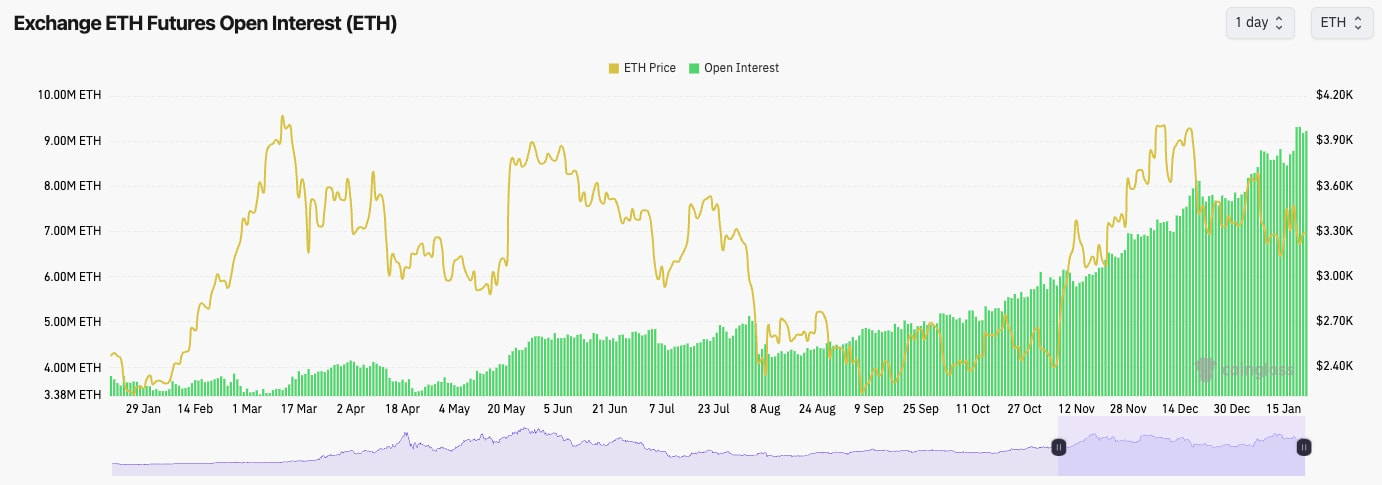
- ETH's Open Interest just continues to soar. This is likely TradFi taking advantage of the 'cash-and-carry' trade alongside protocols/mechanisms like Ethena.
- Funding is at 0.01%, so there is an even balance between Longs and Shorts.
- The signals aren't that clear or decisive here.
Technical analysis
- ETH remains range-bound between the major horizontal resistance of $3,480 and the local support of $3,140 (this is a new level).
- There are also other key horizontal levels to monitor: $3,050 and $3,280.
- ETH remains in its main downtrend, and to see a major bull reversal, we'll need to see the price breakout of the downtrend and also the horizontal resistance of $3,480.
- The RSI is also in a downtrend, and it hasn't yet broken out, whilst it's currently battling to remain above its moving average.
- Next Support: $3,140
- Next Resistance: $3,480
- Direction: Neutral
- Upside Target: $3,700
- Downside Target: $3,050
Cryptonary's take
Like BTC, ETH doesn't really look either here or there. Although arguably, BTC has shown some strength, whereas ETH has just held its level, it seems to be losing a bit of momentum. This week remains a tricky week to navigate, with the market just essentially waiting on Executive Orders from Trump.If there is a sell-off, and we think this is still possible for ETH to achieve, then $3,050 is likely the minimum target. But, if Trump issues very pro-Crypto executive orders, then this could see ETH get the breakout that it really needs.
SOL:
- SOL's Open Interest pulled back at the price lows, and it has been downtrending since, suggesting that the big move higher wiped out Shorts.
- SOL's current Funding Rate is negative, but only just, suggesting that there is more interest in Shorting than Longing.

Technical analysis
- This SOL move higher looks similar to WIF's big move higher to $4.80 when it was listed on Coinbase, although that doesn't mean the same will happen.
- SOL has rejected $300, and it was unable to find support at the prior all-time high of $260.
- SOL has pulled back, and for now, support has been found in the $ 230s. There is a major horizontal support at $220 also.
- The RSI had moved into overbought territory, but it has since pulled back and reset on the price move back.
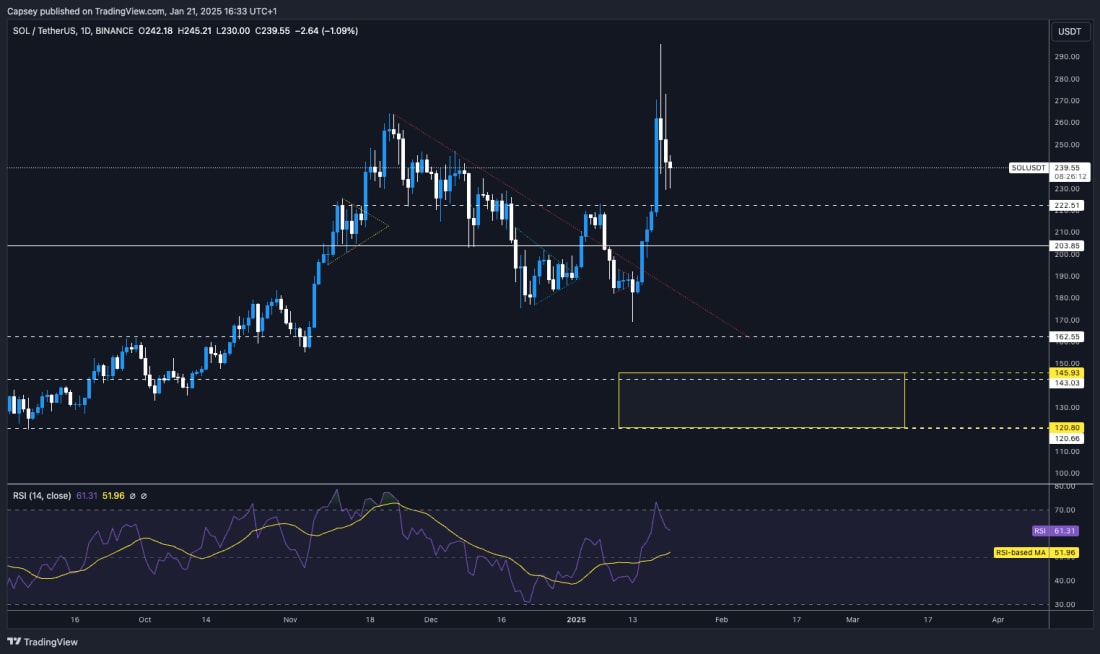
- Next Support: $220
- Next Resistance: $260
- Direction: Neutral
- Upside Target: $300
- Downside Target: $200
Cryptonary's take
In the short term, it's possible that SOL needs to be range-bound for a while, likely between $220 and $260. This wouldn't necessarily be a bad thing building up a range just below all-time highs. It might set the breakout up for later. If there is a breakdown below $220, it's likely a good area to buy more SOL. However, a move into $200 would be the more attractive area if it were given.WIF:
- Price broke out of the local downtrend line and moved up to the horizontal resistance at $1.96. This is where we saw the hidden bearish divergence form and then sent the price to new lows.
- Price is currently trying to hold at the old support/order block between $1.40 and $1.60.
- The RSI broke out of the downtrend, which was good to see. However, it did mean the creation of a hidden bearish divergence.
- The RSI remains close to overbought territory, and we are currently putting in another bullish divergence, with potential at this local low.
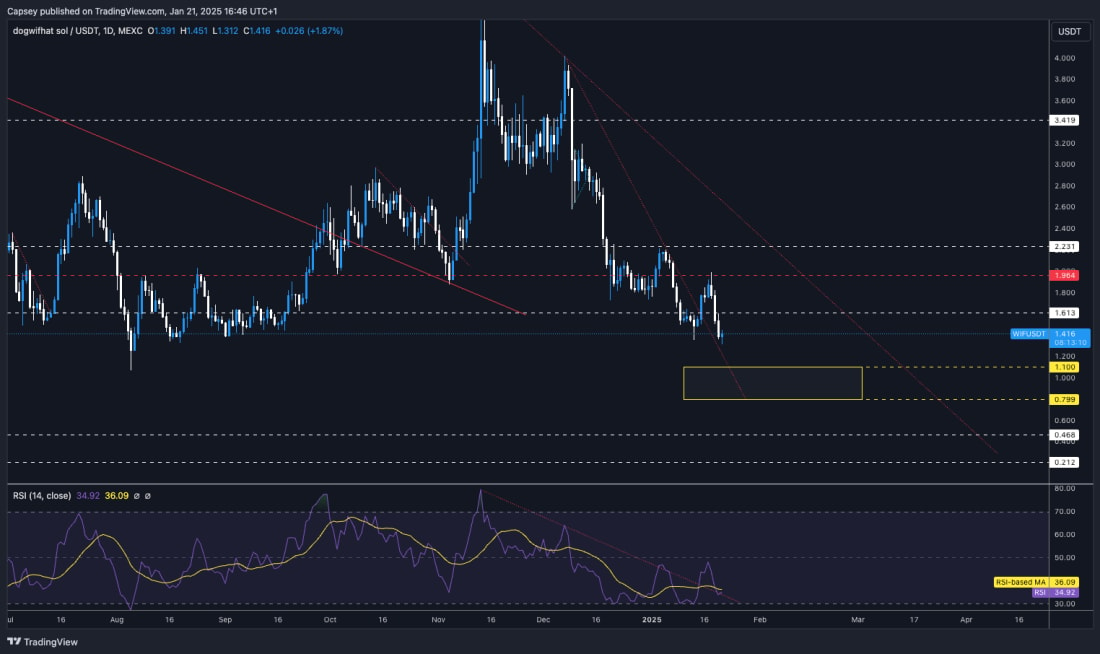
- Next Support: $1.40
- Next Resistance: $1.60
- Direction: Bearish
- Upside Target: $1.60
- Downside Target: $1.20
Cryptonary's take
It's hard to know what happens with WIF here, but the liquidity sucks as cost SOL memes, and WIF has been one of those that has suffered. In terms of this turning around, we'd be looking for it to bottom out. This would be forming some kind of rounded bottom.Does this go as low as the Yellow Box? We think there is still room for this to go lower to potentially $1.10 to $1.20 in the short term, although we'd expect that to be the area where it begins bottoming out.
POPCAT:
- Like WIF, POPCAT broke out of its downtrend line and rejected into the next horizontal resistance. For POPCAT, that was at the prior block between $0.70 and $0.85.
- The price then pulled back further, lost the horizontal level of $0.54, and the price moved into the next horizontal level of $0.40, the top of the Yellow Buy Box.
- The RSI is creating a bullish divergence that is very close to oversold territory. However, it remains in its major downtrend.
- The main horizontal resistance for price will be $0.54 and then $0.70, which feels a way off for now.
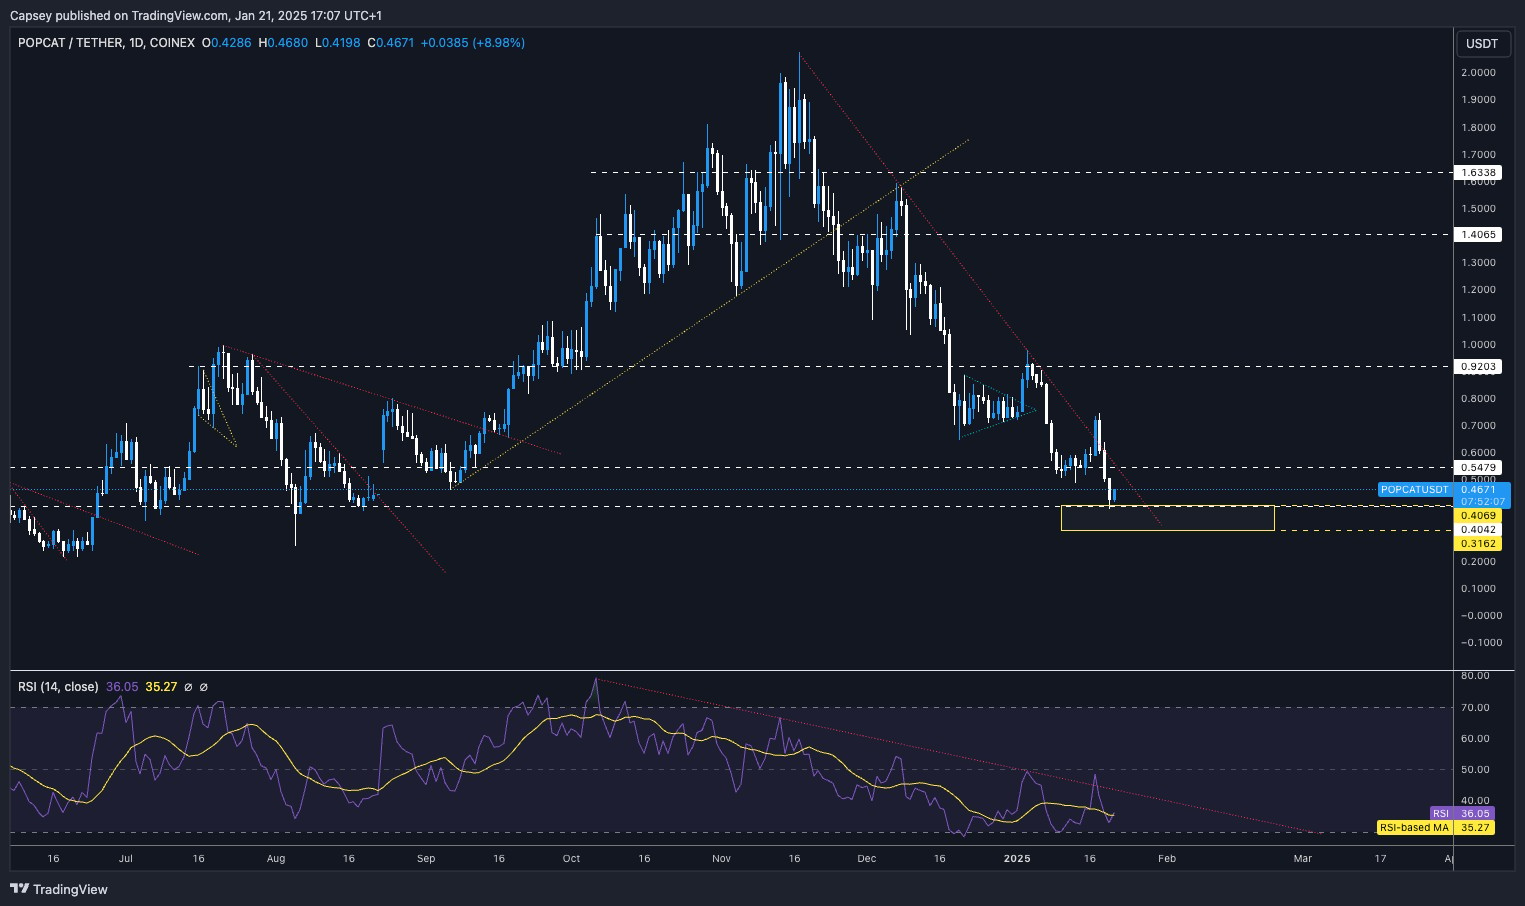
- Next Support: $0.40
- Next Resistance: $0.70
- Direction: Bearish
- Upside Target: $0.70
- Downside Target: $0.30
Cryptonary's take
POPCAT likely fills the Yellow Box, and it may even dip below it at some point. When you have big moves down like this, the usual way they end is by a rounding bottom, which can take some time to see. You'll get some slight reliefs along the way, but mostly, it's marked by new lows, and towards the end, it'll just be a retest of the lows.That'll be the rounding that the price can get and then go up from there. For now, not touching this. If there is a shakeout in the wider market, say BTC, then we expect to see a bit more pain, but again, that is generally across the board and not specific to POPCAT.
SPX:
- A really nice bounce from the lows at $0.90 and back to all-time highs really swiftly.
- The price was rejected into the all-time highs, but we've seen the $ 1.20s now provide support.
- Another positive is that the volume has been good, and this is likely one of the main reasons why we've seen positive price action.
- If the price can hold at this higher range between $1.30 and $1.60, this likely sets up a breakout to the upside in the coming days/weeks.
- The cause for concern would be if the price breaks below $1.00. That would confirm this as a double top. However, we don't see this as happening/likely.

- Next Support: $1.00
- Next Resistance: $1.60
- Direction: Bullish
- Upside Target: $2.00
- Downside Target: $1.00
Cryptonary's take
Overall, this has really shown phenomenal strength in a wider market that has seemingly struggled. If SPX can hold the lows/be bought into at the lows, then we expect a breakout of $1.60 to come in the near term. These may be days, or they might be a week or so.But overall, we've seen strength here. The bounce from $1.00 and straight back to $1.50 was crazy. PS - We'd be very surprised to see $1.00 broke, let alone the Yellow Box be touched. Deleting Yellow Buy Box as we speak.
Recommended from Cryptonary


