Save 23% ($351) & Get a Free 1-1 Call with our Team ⏰ : 0d 2h 59m 44s
Disclaimer: This is not financial or investment advice. You are responsible for any capital-related decisions you make, and only you are accountable for the results.
BTC:
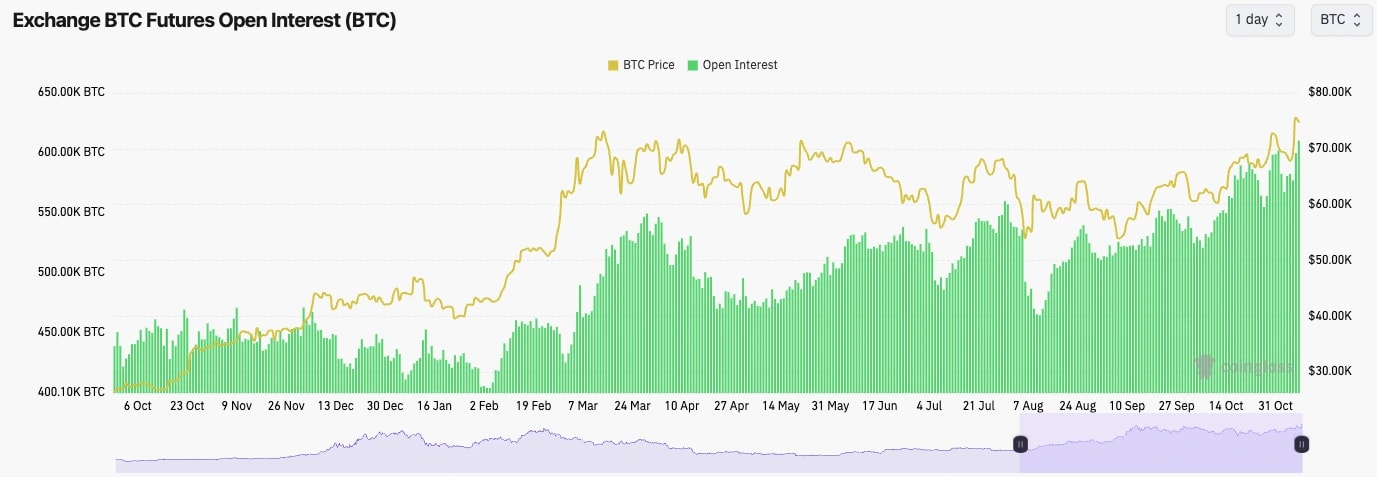
- Upon Trump's victory, Open Interest (in terms of the number of BTC) shot up to new cycle highs, whilst OI in USD terms hit a new all-time high.
- Funding Rates on the major exchanges are positive at 0.01%, but on less liquid exchanges, Funding has moved more significantly positively, indicating traders are paying a higher premium than usual to be Long.
- In the short-term, this isn't over-extended, but if the trend upwards continues, it might be soon.
Technical analysis
- Bitcoin broke out to new all-time highs upon the Trump victory.
- The key level for the price to clear above was $73,600, which the price has now convincingly closed above.
- It's possible now that $73,600 becomes new local horizontal support and price may pull back and retest this level before breaking up higher again.
- The RSI is just shy of overbought territory, however we have seen in prior times when price breaks above all-time highs, price can still rally aggressively despite the RSI being overbought. For now, this isn't much of a concern.
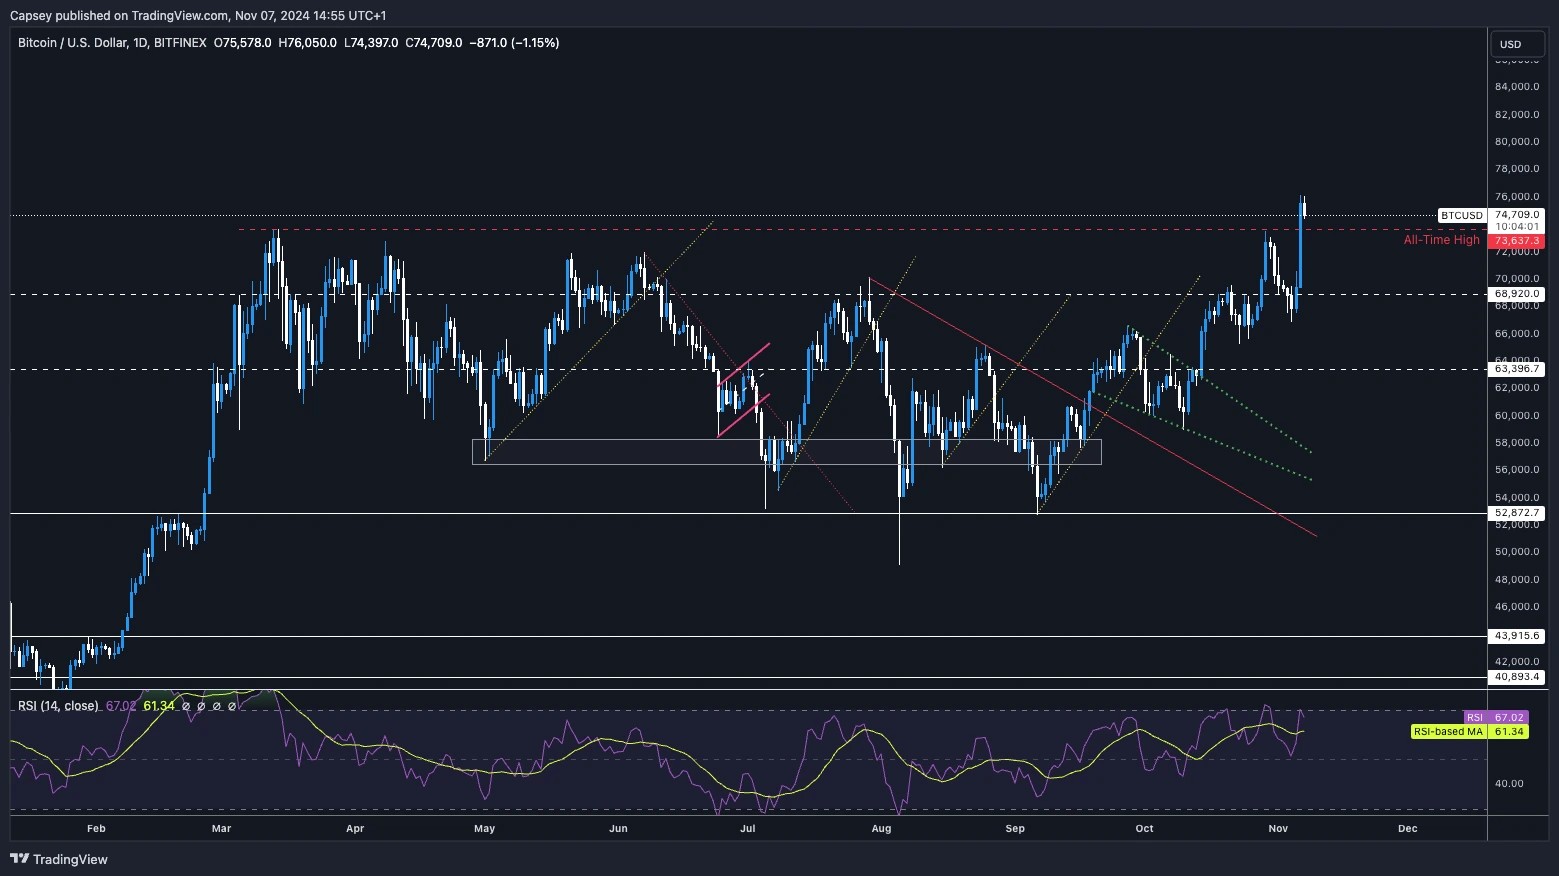
- Next Support: $73,600
- Next Resistance: $76,000
- Direction: Neutral/Bullish
- Upside Target: $80,000
- Downside Target: $73,600
Cryptonary's take
With the breakout to new price all-time highs, we believe the 7 month or so consolidation period is now over and that we're now in the very beginning stages of the "euphoria" part of the cycle. We're expecting BTC to be priced between $85k (extremely conservative target) and $100k (realistic target) by Christmas.From here, let the market do the hard work for you. Unless you're a competent trader, the best bet here is to let the market run, and take your bags higher for you. There's no need to get in the way here, let the market do that hard work for you.
In the coming days, it's possible BTC pulls back to $73k, tests the prior all-time high as new local support before shooting on higher again from there.
ETH:
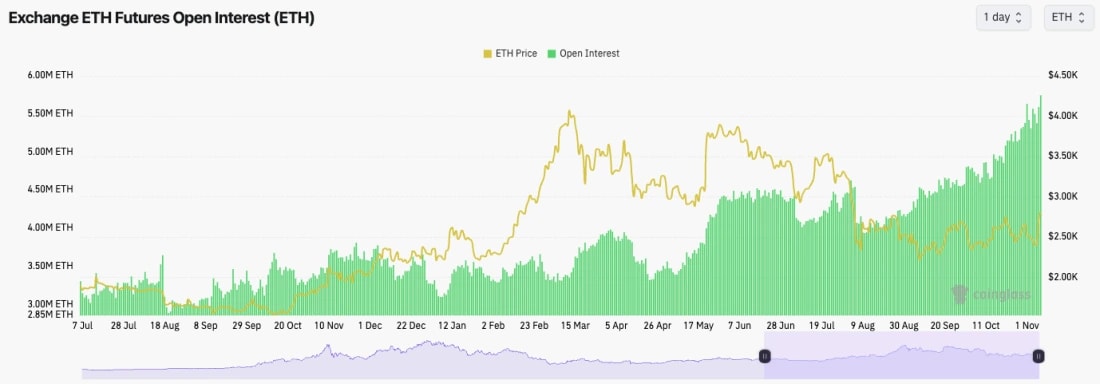
- The ETH Open Interest is in an aggressive uptrend and hit new all-time highs yesterday. This indicates a lot of leverage has gone in to ETH.
- The Funding Rate is similar to BTC. Positive but contained on larger exchanges, but the
- Funding Rate is rising on the smaller, less liquid exchanges, indicating traders are paying a higher and higher premium to be Long here.
Technical analysis
- So far, a really lovely move, and maybe the first time we're seeing some life from ETH following a Trump victory that potentially improves the regulatory environment, benefitting ETH.
- ETH broke back above the main downtrend line and shot straight up to the main horizontal resistance of $2,875 that we've had in place for a number of months now.
- Price has so far been rejected from $2,875; although the price now being in this higher range, it's likely we will see a breakout of $2,875 in the coming weeks.
- Local support for ETH should be around the $2,700 mark. Really, in this market, ETH should be able to hold the $2,700 local support.
- Beyond $2,875, ETH's next major horizontal resistance is $3,280.
- ETH's RSI is approaching overbought territory, but isn't yet close. If price consolidates for a few days, this'll reset the RSI more and likely give more room for ETH to then break above $2,875 more convincingly. Likely more upside to go here.
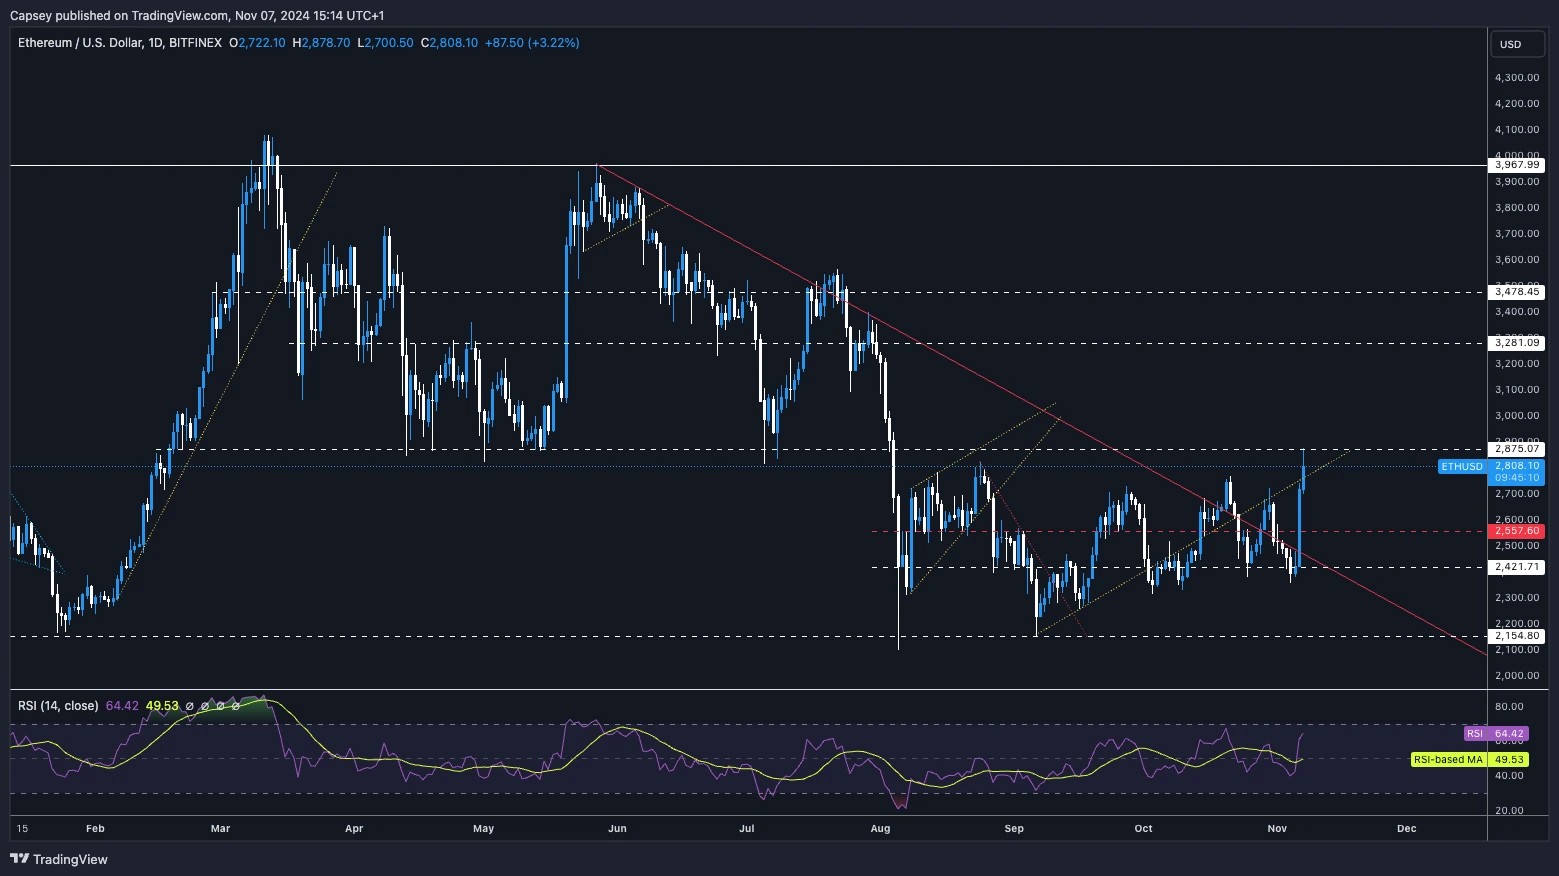
- Next Support: $2,700
- Next Resistance: $2,875
- Direction: Neutral/Bullish
- Upside Target: $2,875 (to $3,280 upon breakout)
- Downside Target: $2,700
Cryptonary's take
A much more positive looking chart which is to be expected considering ETH and just the blockchain space is now likely to be moving in to a new regulatory regime.We're expecting the price to be range-bound between $2,700 to $2,875 for a few more days and then to breakout above $2,875 potentially by the end of the weekend.
SOL:
- SOL's Open Interest (by number of coins) has spiked to a new yearly high following the Trump win.
- Funding Rate-wise, SOLs are similar to ETHs. 0.01% on major, more liquid exchanges, but
- Funding has moved more meaningfully positively on the less liquid exchanges. This can go further, but it'll likely need a small flush out at some point. But this wouldn't worry us in terms of a meaningful price drawdown. We'll hold through any volatility.
![]()
Technical analysis
- Following the breakdown of the local uptrend line, SOL found some support just below the local support of $162, and it was able to put in a much stronger bounce following the Trump win.
- We identified previously that the $180 to $190 area is likely to act as a resistance box for price in the short-term. That's now what we're seeing, but, we emphasise, in the very short-term.
- It's possible that the price will now pull back a tad and use the $180 level as new support.
- A clean breakout above $205, and SOL will just send. That's the key level to watch.
- Another positive is that SOL has also reclaimed the local uptrend.
- Like ETH, SOL's RSI is approaching overbought territory, but it isn't there yet. More room to head higher for price here.
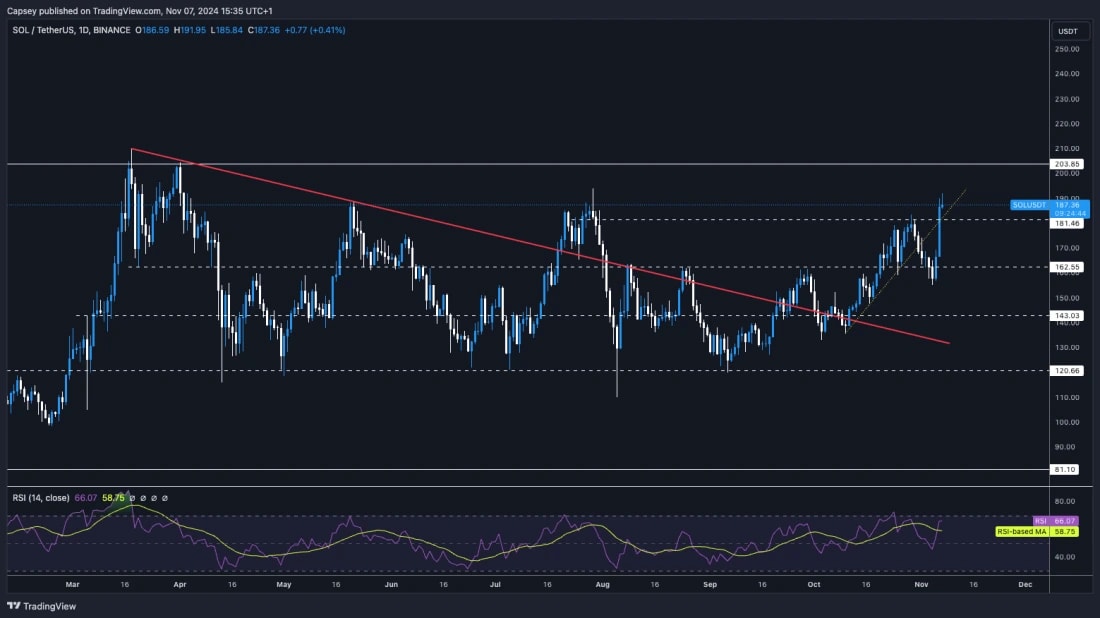
- Next Support: $180
- Next Resistance: $190
- Direction: Neutral/Bullish
- Upside Target: $190 (to $205 upon breakout)
- Downside Target: $180
Cryptonary's take
It's possible that price remains in a tight range for a few days (between $180 and $190). However, we're expecting price to breakout in the coming 12 weeks and to test the $200 level. Whilst we're not sure we'll get an immediate breakout above $200, we do believe it's eventually inevitable.We remain super constructive and bullish on the market here, with SOL being one of our core positions.
WIF:
- WIF managed to find support just below our Yellow buy box ($2.00 to $2.20) at the main horizontal support level of $1.96.
- Price has bounced from the main horizontal support and is now broken back above the local downtrend line.
- Price was initially rejected at the next horizontal resistance at $2.50 and $2.55.
- Price is now consolidating between $2.20 and $2.55. The lower end of this range is likely still a good buy considering the environment it looks like we'll be moving in to.
- The RSI on WIF is in the middle territory, so it is still nowhere near overbought, and it is coming off of nearly oversold levels. The RSI won't be a headwind for further price upside here positive.
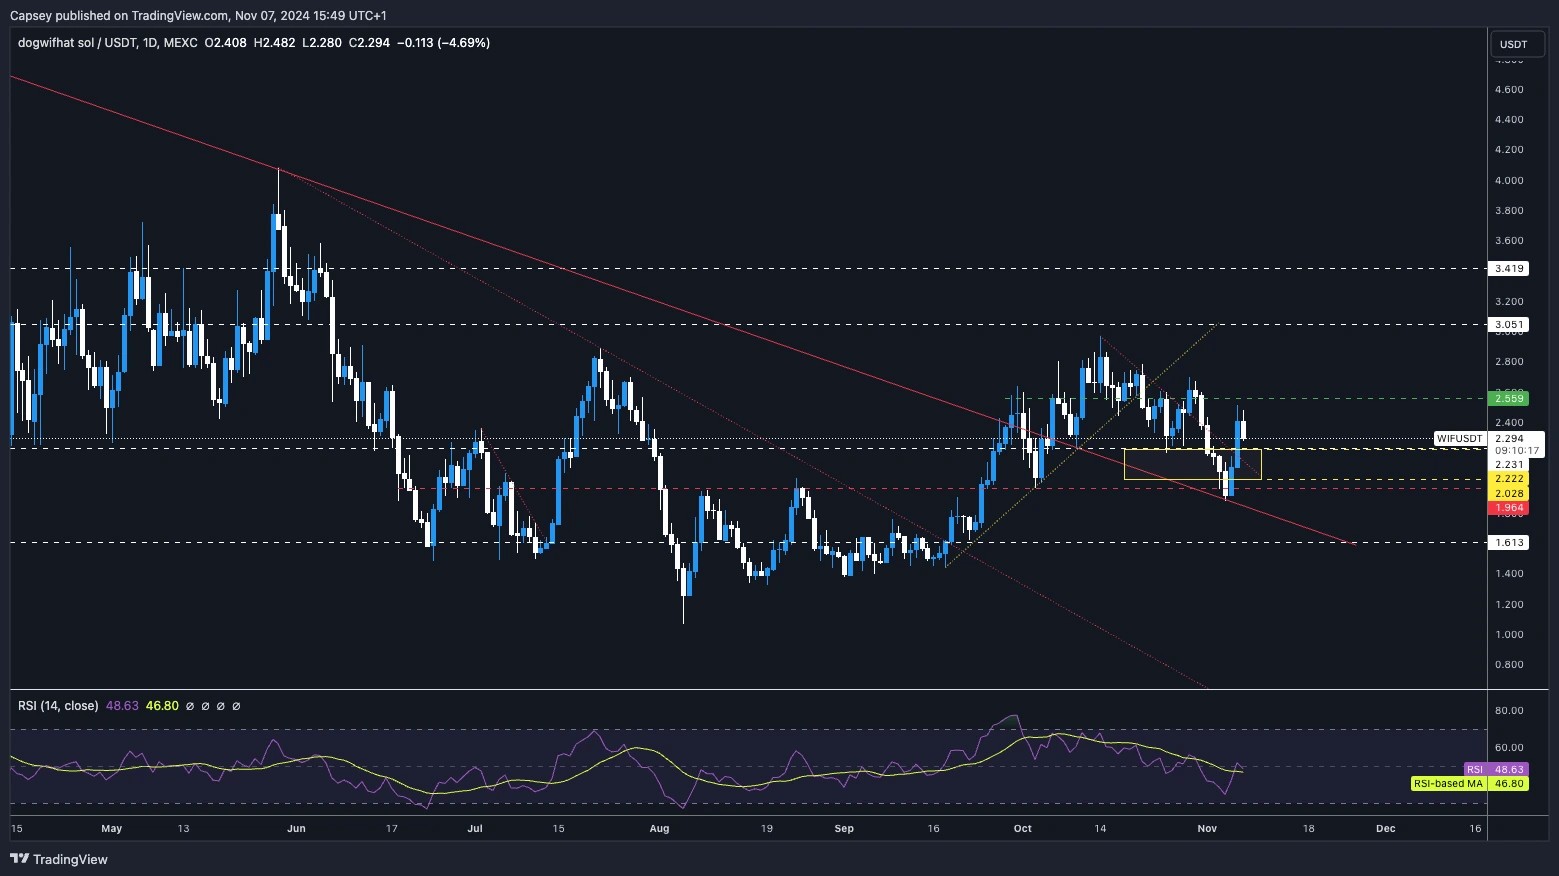
- Next Support: $2.20
- Next Resistance: $2.55
- Direction: Bullish
- Upside Target: $2.55 (to $3.05 upon breakout)
- Downside Target: $2.20
Cryptonary's take
We'll just start with this straight out of the gate. Out of all the major meme's, WIF currently looks the most attractive price wise. Whilst we're still expecting some range-bound price action between $2.20 and $2.55, we expect $3.05 to be quickly achieved upon a breakout of $2.55. We would be buyers of the bottom end of this range at $2.20.POPCAT:
- POPCAT did make a convincing break down below the main uptrend line, however price was able to bounce and quickly recover.
- Whilst a range is tricky to establish, it looks to us like the key levels of support and resistance are $1.40 and $1.63 (give some slight flexibility to this though).
- The RSI has pulled back from the highs following the price dip, however it would healthy for POPCAT to see price remain range bound for some more days/week here.
- A breakout above $1.63 likely sends POP back to $1.80.
- A breakdown of $1.40 likely sends POP back down to $1.20, although we would be surprised to see this level ($1.20) revisited.
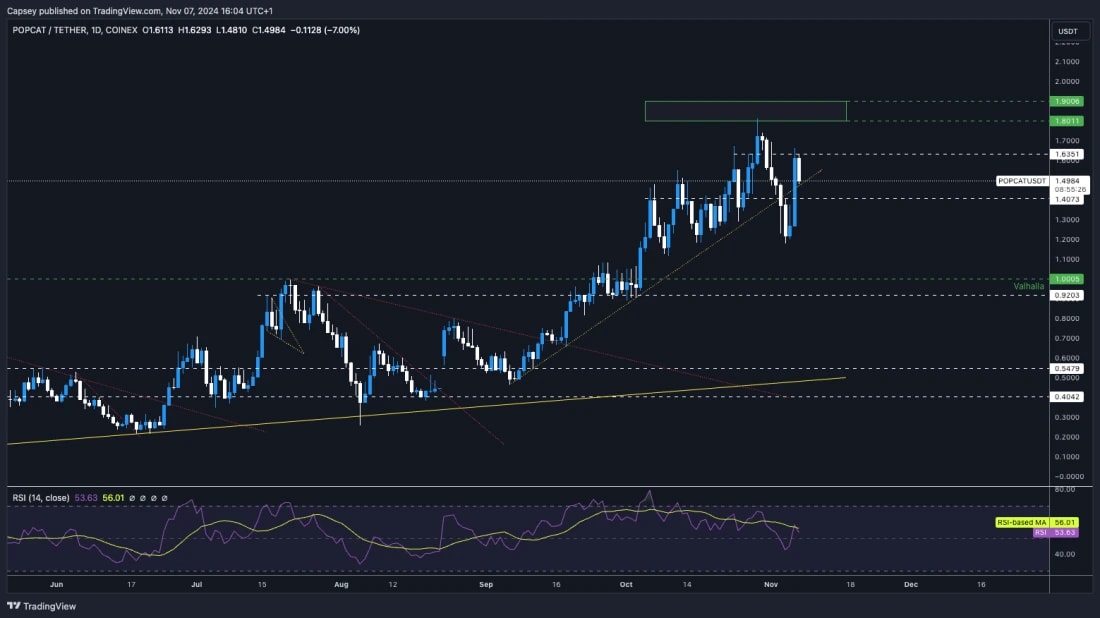
- Next Support: $1.40
- Next Resistance: $1.60
- Direction: Neutral
- Upside Target: $1.60
- Downside Target: $1.40
Cryptonary's take
We expect POPCAT to be range-bound over the coming days between $1.40 and $1.60, whilst we think WIF can lead in terms of price moving higher in the immediate term. We're looking for WIF to make a move higher, and then for POPCAT to follow it, following WIF's move.SPX:
- SPX was able to bounce from a really crucial level at the main uptrend line.
- Price has since broken out of the local downtrend and moved in to the main horizontal resistance at $0.94, where price has seemingly rejected... so far.
- There is a local support at the current price at $0.84, and beneath this, the main support is at $0.75.
- If the price breaks above the $0.94 level, the price will be in price discovery, and $1.20 is a potential target.
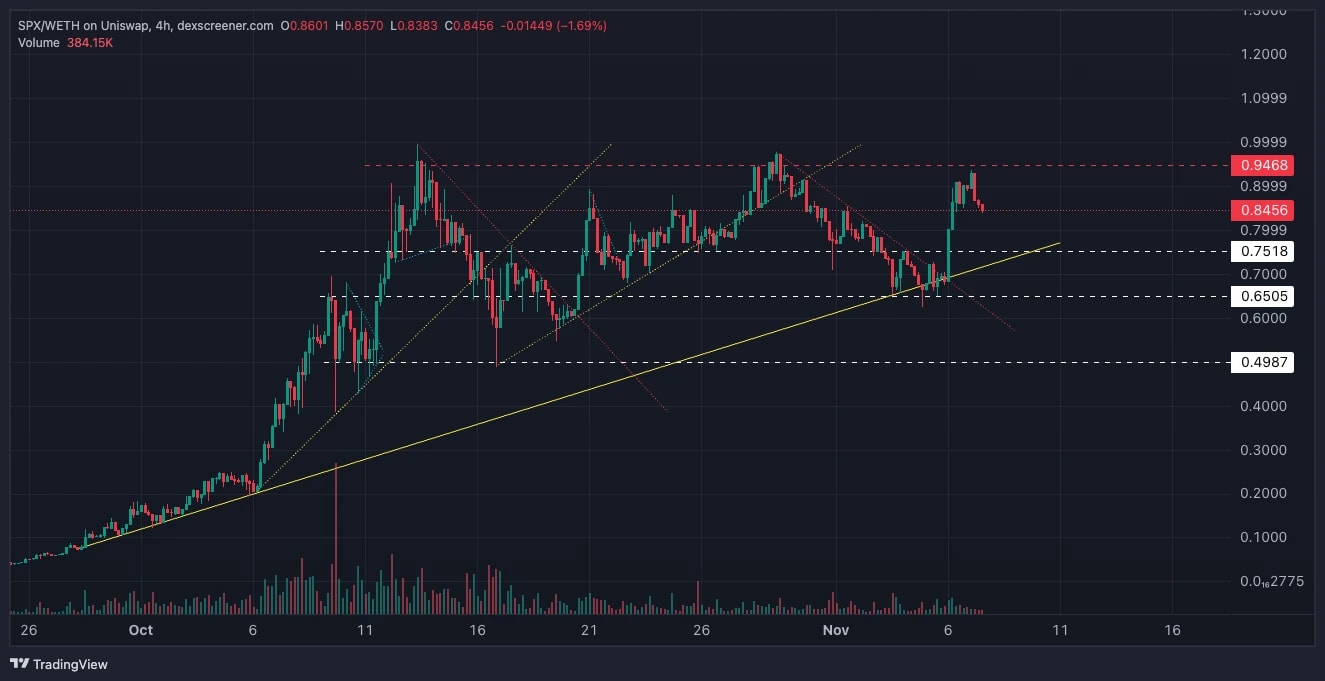
- Next Support: $0.84
- Next Resistance: $0.94
- Direction: Neutral/Bullish
- Upside Target: $0.94
- Downside Target: $0.75
Cryptonary's take
SPX is in a range here between $0.75 and $0.94, with $0.84 as a mid-point. If BTC can breakout then we'd expect SPX to do the same and breakout of $0.94.However, in the coming days, we're expecting more range bound price action. Although, if $0.84 holds, and BTC breaks out, then the SPX break out could be imminent.
Recommended from Cryptonary


