Save 23% ($351) & Get a Free 1-1 Call with our Team ⏰ : 0d 2h 59m 43s
Market Direction
BTC price prediction today: Will Bitcoin surpass $63,400 resistance?
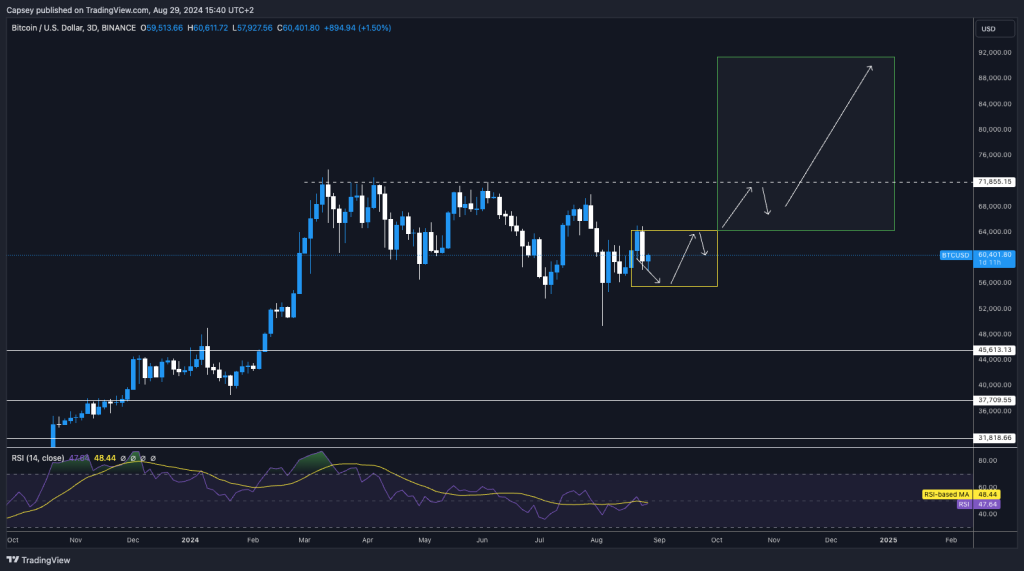
On another note for Bitcoin, if we refer to the zoomed-out chart and prediction we made for BTC's price action over the coming months, it's still right on track; in fact, the price rejected at the top of the Yellow box.

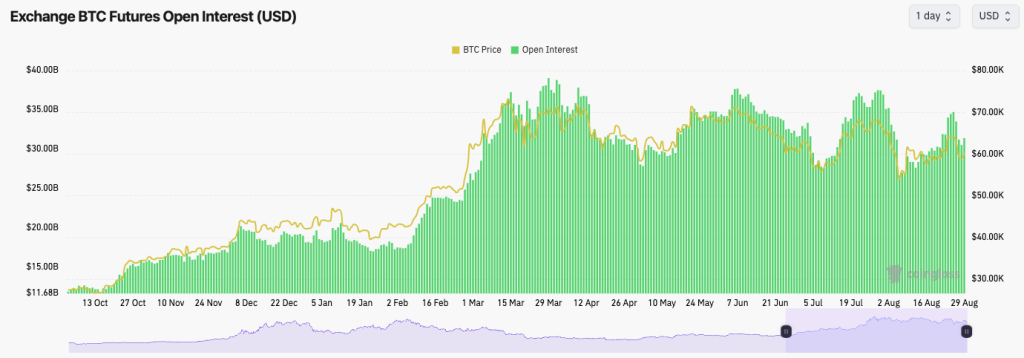
- In our last Market Direction, we commented that BTC's Open Interest had increased to relatively high levels, making it vulnerable to a flush-out. We got this on Tuesday.
- BTC's Funding is now flip-flopping between slightly positive and slightly negative, again indicating indecision.
- This is typical when the market is range-bound, and traders have become bored/somewhat stir-crazy by the price action.
- The Open Interest has been flushed back out again, and price from a mechanics perspective looks ok to grind higher from here.
Technical analysis
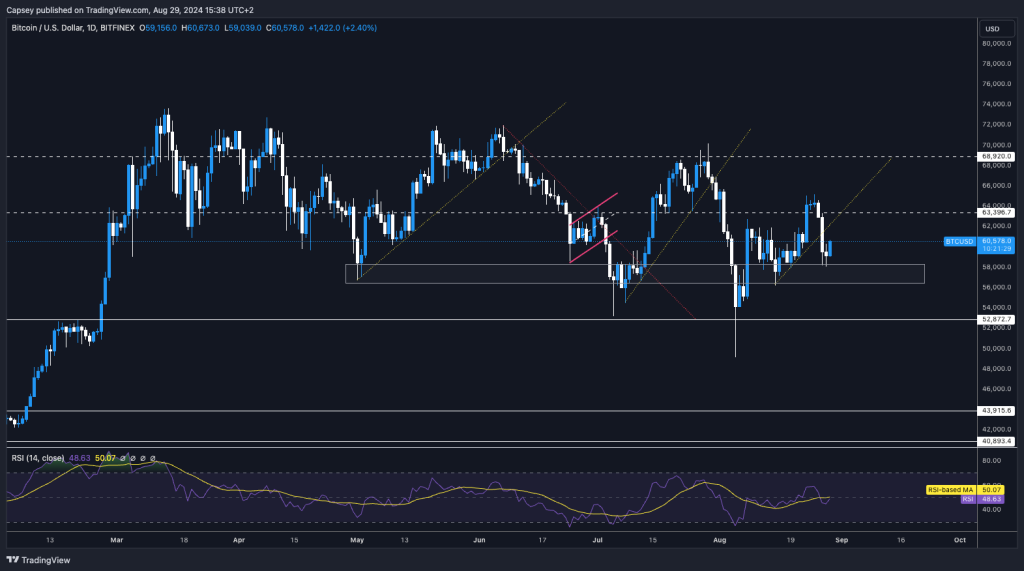
- We weren't necessarily expecting BTC to have a substantial breakdown, but once the $63,400 level was lost, Longs were offside, and the leverage was flushed, causing a more significant drop in price.
- Price was then unable to find support in the $61k to $62k region.
- We have placed a grey box where we believe there is stronger support for price between $56,500 and $58,300. We expect that area to hold in the short term (we'll see how price develops beyond the short term).
- Ultimately, price is still in its major range between $53k and $69k, and actually now back in its tighter range between $56k and $64k.
- We're not expecting the market to see any fireworks until the range, particularly the tighter range, can be broken.
- In order for us to turn more bullish in the immediate term, we'd need to see price reclaim above $63,400.
Disclaimer: This is not financial or investment advice. You are responsible for any capital-related decisions you make, and only you are accountable for the results.
Cryptonary's take
Looking back now, price has essentially done what we expected over the last few weeks-absolutely nothing and just been range-bound. We are expecting more of this. However, come next Friday (September 6th), if the US Payrolls (and Unemployment Rate) are positive, i.e., showing that the labour market is holding up still, we believe that could ignite the rally as we move to Interest Rates on September 18th.BTC 3D Timeframe: Zoomed-out perspective
Recommended from Cryptonary


PRO
Market Direction
13 min read
Mar 17, 2026
PRO
Market Direction
12 min read
Mar 13, 2026

PRO
Market Direction
13 min read
Mar 10, 2026
