Save 23% ($351) & Get a Free 1-1 Call with our Team ⏰ : 0d 2h 59m 43s
BTC & XRP Breakdown
By taking a step back, we often find that these seemingly steep moves all fit within a bigger image and this time is no different. Since Bitcoin peaked near $14,000 in June, price has been constricted inside this descending channel and has been highly respecting both the upper and lower limit since then. As long as the latter case does not change, this channel can potentially be used as guidance with one's trading decision.
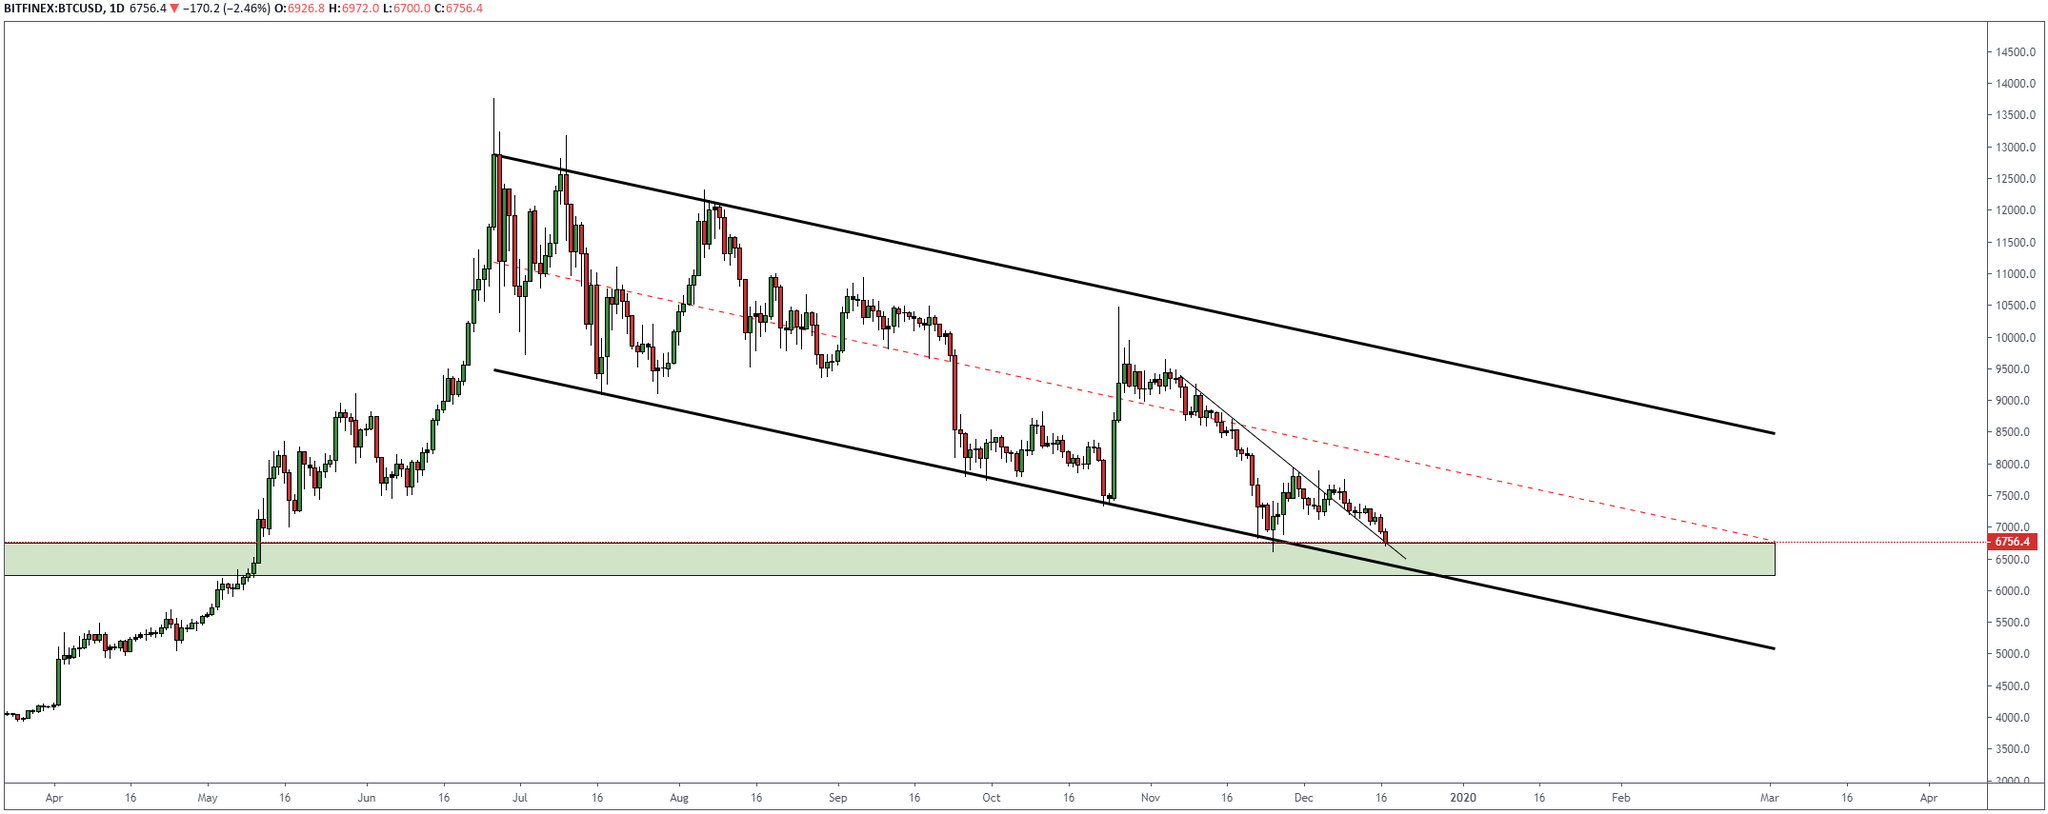
It is worth noting that during these downside moves we've consistently been getting closer to the green support area, which also coincides at this current moment in time with the channel's lower limit.
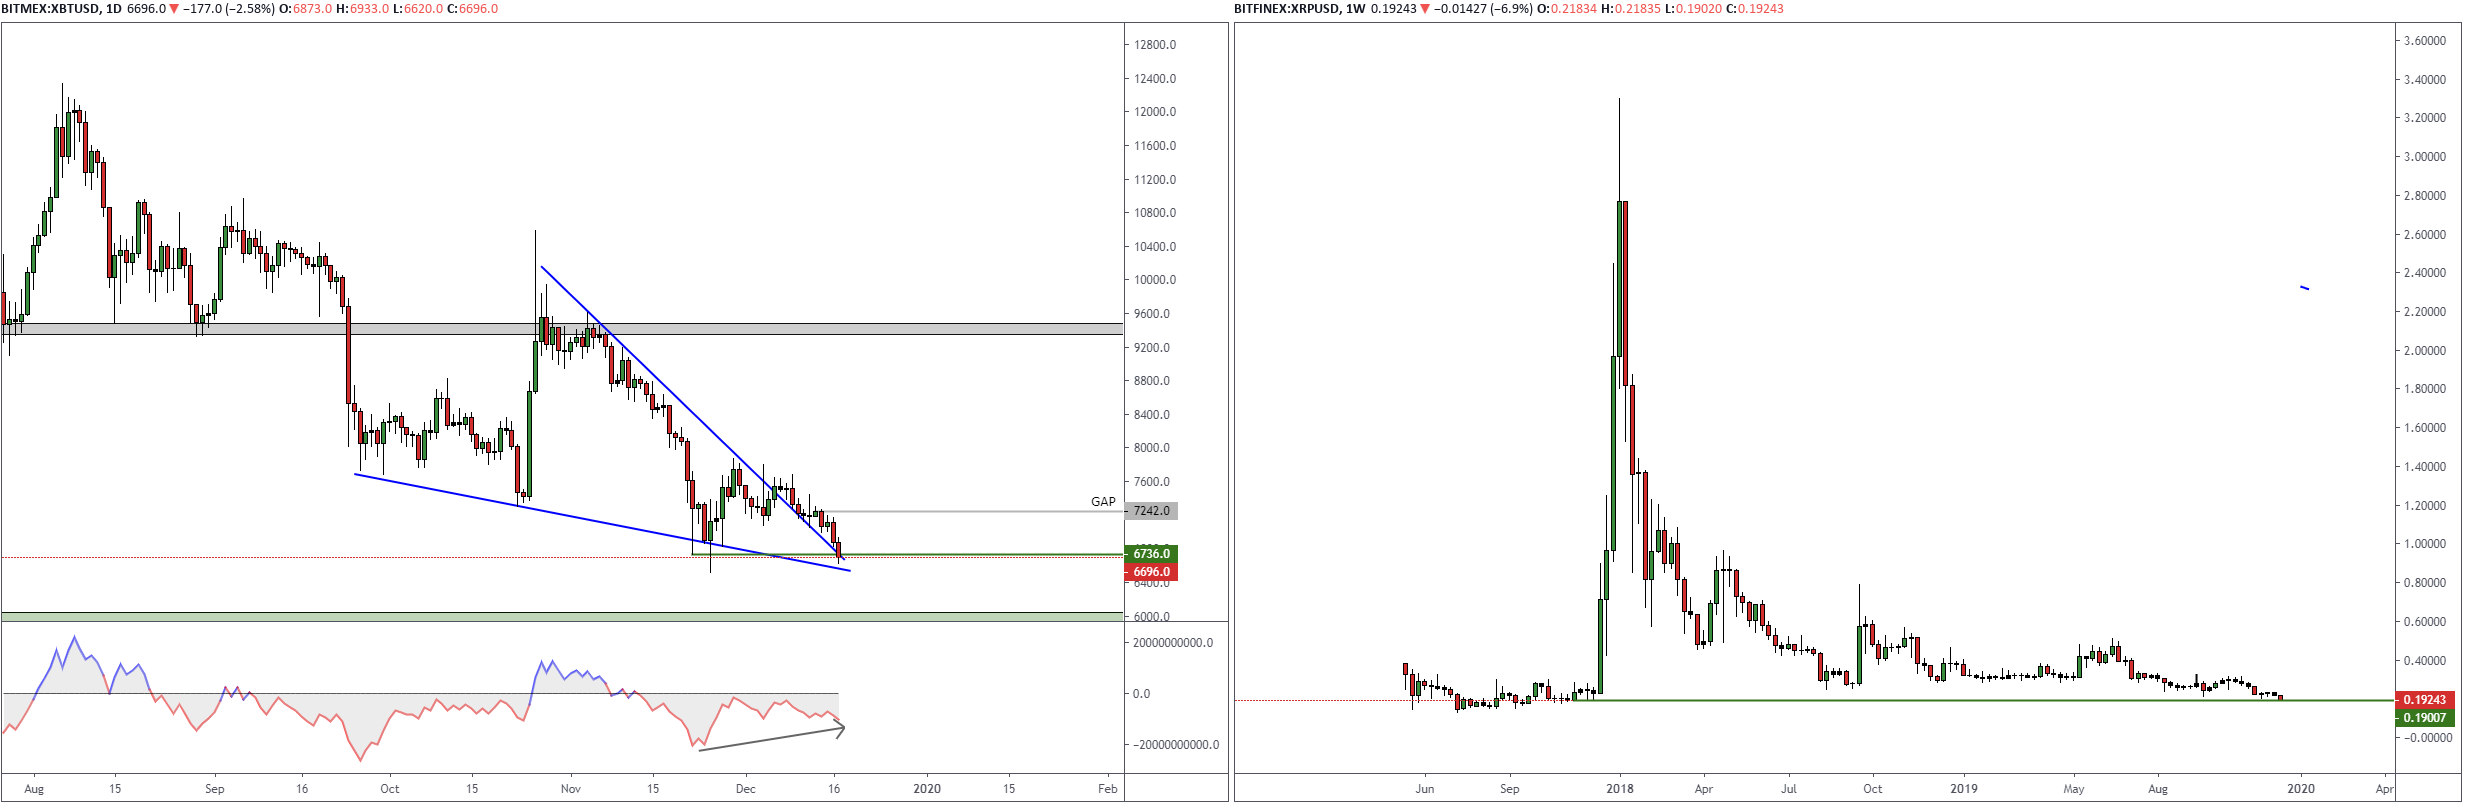
Moreover, by looking at the chart on the left, we can see a bullish divergence being registered (lower low on PA and higher low on indicator); which as the name states is a bullish indication.
In this last decline, XRP (chart on the right) experienced double-digit losses. However, by taking a step back and looking at S/R levels created before the 2017 bull-run, we can see that price is now sitting at a significant support level.
Recommended from Cryptonary


