Save 23% ($351) & Get a Free 1-1 Call with our Team ⏰ : 0d 2h 59m 44s
Bullish PENDLE, Jupiter’s move, and FWOG’s future
Pendle, Jupiter, and FWOG are gearing up for significant price movements. Pendle has broken out of its downtrend and holds above key support, while Jupiter is consolidating, awaiting a breakout. FWOG remains in a bullish phase, testing important resistance. All three assets show promise for upward moves.

Let’s dive into their price action!
Disclaimer: This is not financial or investment advice. You are responsible for any capital-related decisions you make, and only you are accountable for the results.
PENDLE
Overview
As Bitcoin gears up for its next potential move amidst favorable macro conditions, assets like Pendle are positioning themselves for strong runs. $PENDLE is a DeFi token known for its yield-trading mechanisms, providing an innovative approach to the DeFi ecosystem. Over the past year, Pendle has established solid market momentum, marked by several bullish rallies followed by periods of consolidation, creating prime accumulation zones for long-term investors.Pendle has displayed a bullish structure, with notable rallies pushing the token to a new all-time high in mid-2024. Despite several retracements, the asset has shown resilience, bouncing from key support zones. With Bitcoin's bullish momentum helping to drive altcoins higher, Pendle appears primed for a breakout.
General market structure
Pendle's price action has been defined by its large rallies and pullbacks, leading to accumulation zones that provide opportunities for strategic buying. After reaching an ATH of $7.5 in 2024, Pendle retraced in a series of bearish swings, testing key support levels. However, its overall market structure has remained bullish, with Pendle continuously holding its higher-low structures after these corrections.Pendle has recently broken out of its downtrend trendline (marked by the orange dotted line) and flipped the 200 EMA on the daily timeframe. This is a significant indicator of bullish momentum returning to the asset. The 200 EMA, currently at $3.67, is now acting as support alongside the demand zone between $3.10-$3.61, which adds to Pendle's bullish outlook.
Current market outlook
With Bitcoin hovering above key resistance levels and the wider market beginning to heat up, Pendle is setting up for its next bullish move. Price action shows that Pendle is breaking out of its downtrend trendline and is now trading above the 200 EMA -- a critical level for bullish momentum.- Support levels: Pendle is holding support above the demand zone at $3.10-$3.61, bolstered by the 200 EMA now acting as confluence support. This area is critical, as losing this support could bring the price back into a consolidation phase.
- Resistance levels: On the upside, Pendle faces resistance at $4.64 and $5.78. These levels are likely to act as key hurdles for the price to overcome in the short to medium term. If Pendle can push past these resistance levels, we could see a move toward the ATH of $7.5.
Potential DCA zones
For those looking to accumulate, the $3.10-$3.61 zone remains an ideal DCA (Dollar-Cost Averaging) range. This zone has proven to be a strong area of support, as Pendle has bounced from these levels multiple times. If the price dips below the 200 EMA, the $2.60-$3.00 range could be the next strategic zone to accumulate for long-term holds.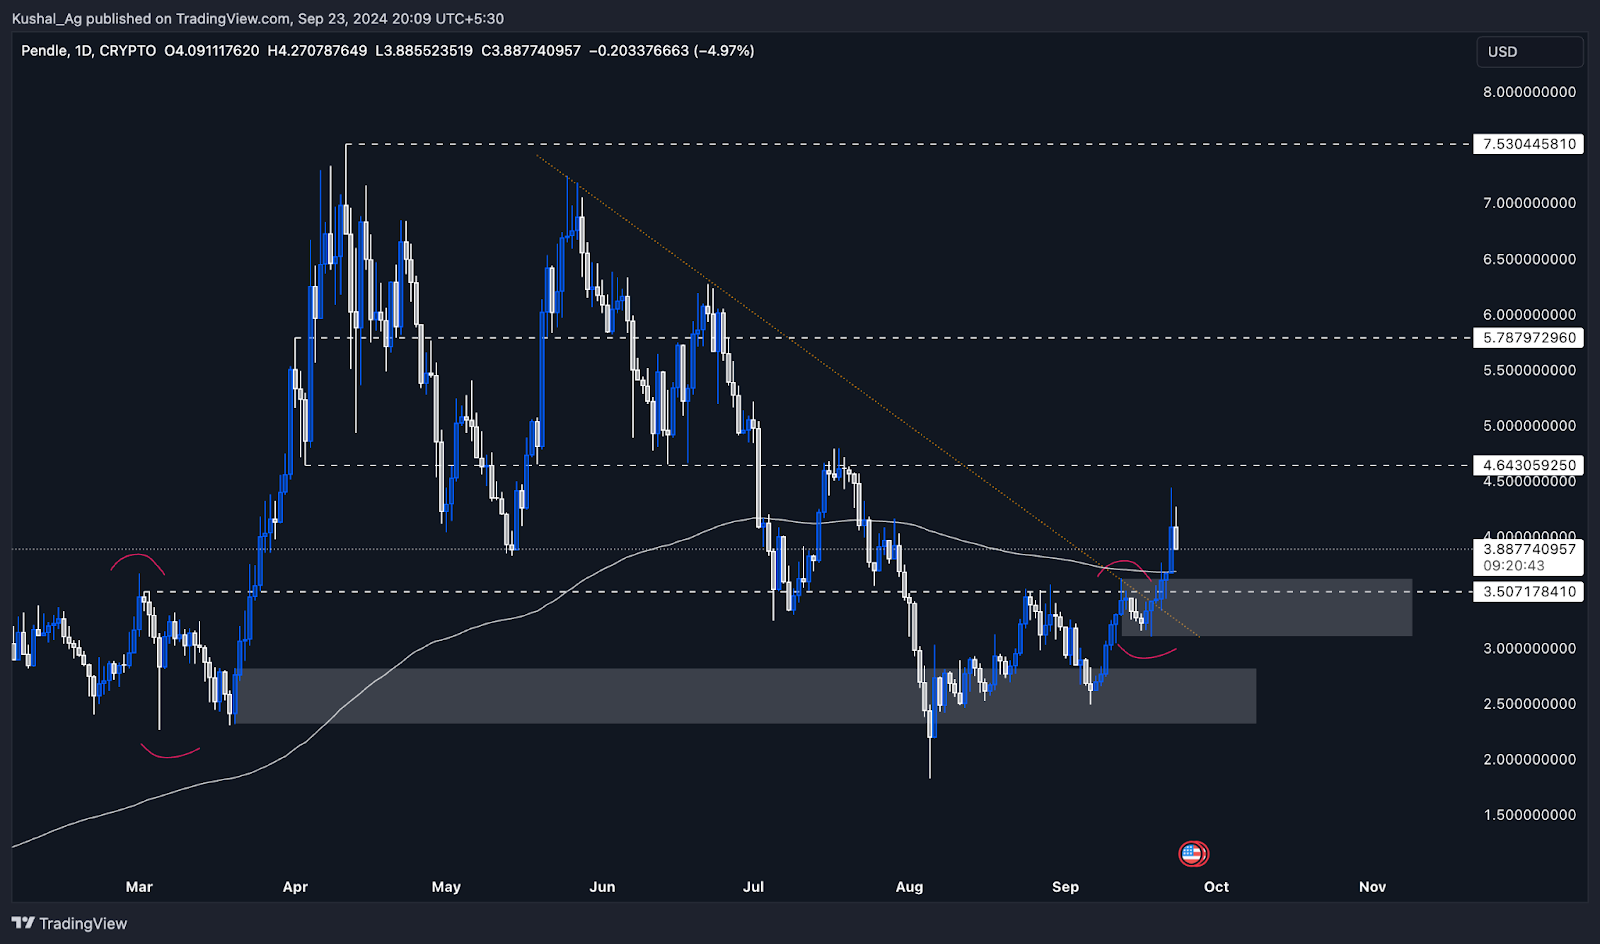
Cryptonary's take
Pendle is displaying strong technical indicators and is aligning with the broader bullish sentiment of the crypto market, particularly as Bitcoin leads the charge. The asset's current market structure, a breakout above the 200 EMA, and proximity to key support zones all point toward a favourable setup for the coming weeks. The next critical step for Pendle is to break through the resistance at $4.64 and $5.78, which could unlock a potential move toward its ATH of $7.5.JUP
Overview
Jupiter ($JUP) appears to be one of the altcoins setting up for a significant move in the coming months. In the larger timeframe, the price action consolidates beautifully within a tight range from $0.684 to $0.872. This tight consolidation hints at an accumulation phase, where strong hands are positioning themselves for an eventual breakout.Currently, Jupiter's price action is being squeezed by a downtrend trendline (marked by the orange dotted line), indicating that it's approaching a decisive moment. Resistance is coming in from both the trendline and the 200 EMA (at $0.872 and $0.89, respectively), and the token has so far been unable to break through.
Current market structure
- Consolidation Range: Jupiter is consolidating in a tight range between $0.684 to $0.872. This suggests that traders and investors are in an accumulation phase, waiting for a clear breakout.
- Downtrend Trendline: The price is being squeezed by a descending trendline that has been dictating resistance levels. Breaking above this trendline will likely signal the beginning of a new bullish trend.
- Key Resistance Levels: Immediate resistance levels are at $0.872 (current upper bound of the range) and $0.89 (200 EMA). Breaking above these levels would be a strong bullish signal.
Current market outlook
Jupiter is currently showing strength but is facing resistance from both the 200 EMA and the downtrend trendline. Should Jupiter manage to break above these resistances, it has the potential for a strong rally. The next resistance level after the breakout would be $1.22, and breaking that could lead to a retest of the all-time high (ATH) at $1.84.Key levels to watch
- Resistance: $0.872 (current range upper bound), $0.89 (200 EMA), $1.22 (next major resistance), and $1.84 (ATH).
- Support: Should the price break down from the current range, there is a demand zone on the daily timeframe from $0.47 to $0.64 that will act as strong support.
Potential accumulation zone
- Accumulation Opportunity: If the price retraces into the $0.47 - $0.64 demand zone, this would present a strong opportunity for accumulation with favourable risk-reward ratios.
- Current Range Accumulation: Investors who are bullish on Jupiter may also consider accumulating around the lower bound of the current consolidation range ($0.684) in anticipation of a breakout.

Cryptonary's take
Jupiter is showing potential for a significant breakout after months of consolidation. The tight range and clear resistance levels make it an ideal candidate for a swing trade or a long-term accumulation play. The wider crypto market is also heating up, with many altcoins poised to follow Bitcoin's recent bullish move. If Jupiter manages to flip the 200 EMA into support and break out of its downtrend trendline, we could see a rally to $1.22 in the near term and potentially a move towards its ATH at $1.84. However, caution is advised if Jupiter fails to hold its current support levels, as the downside could lead to a retest of the $0.47 - $0.64 demand zone for accumulation.FWOG
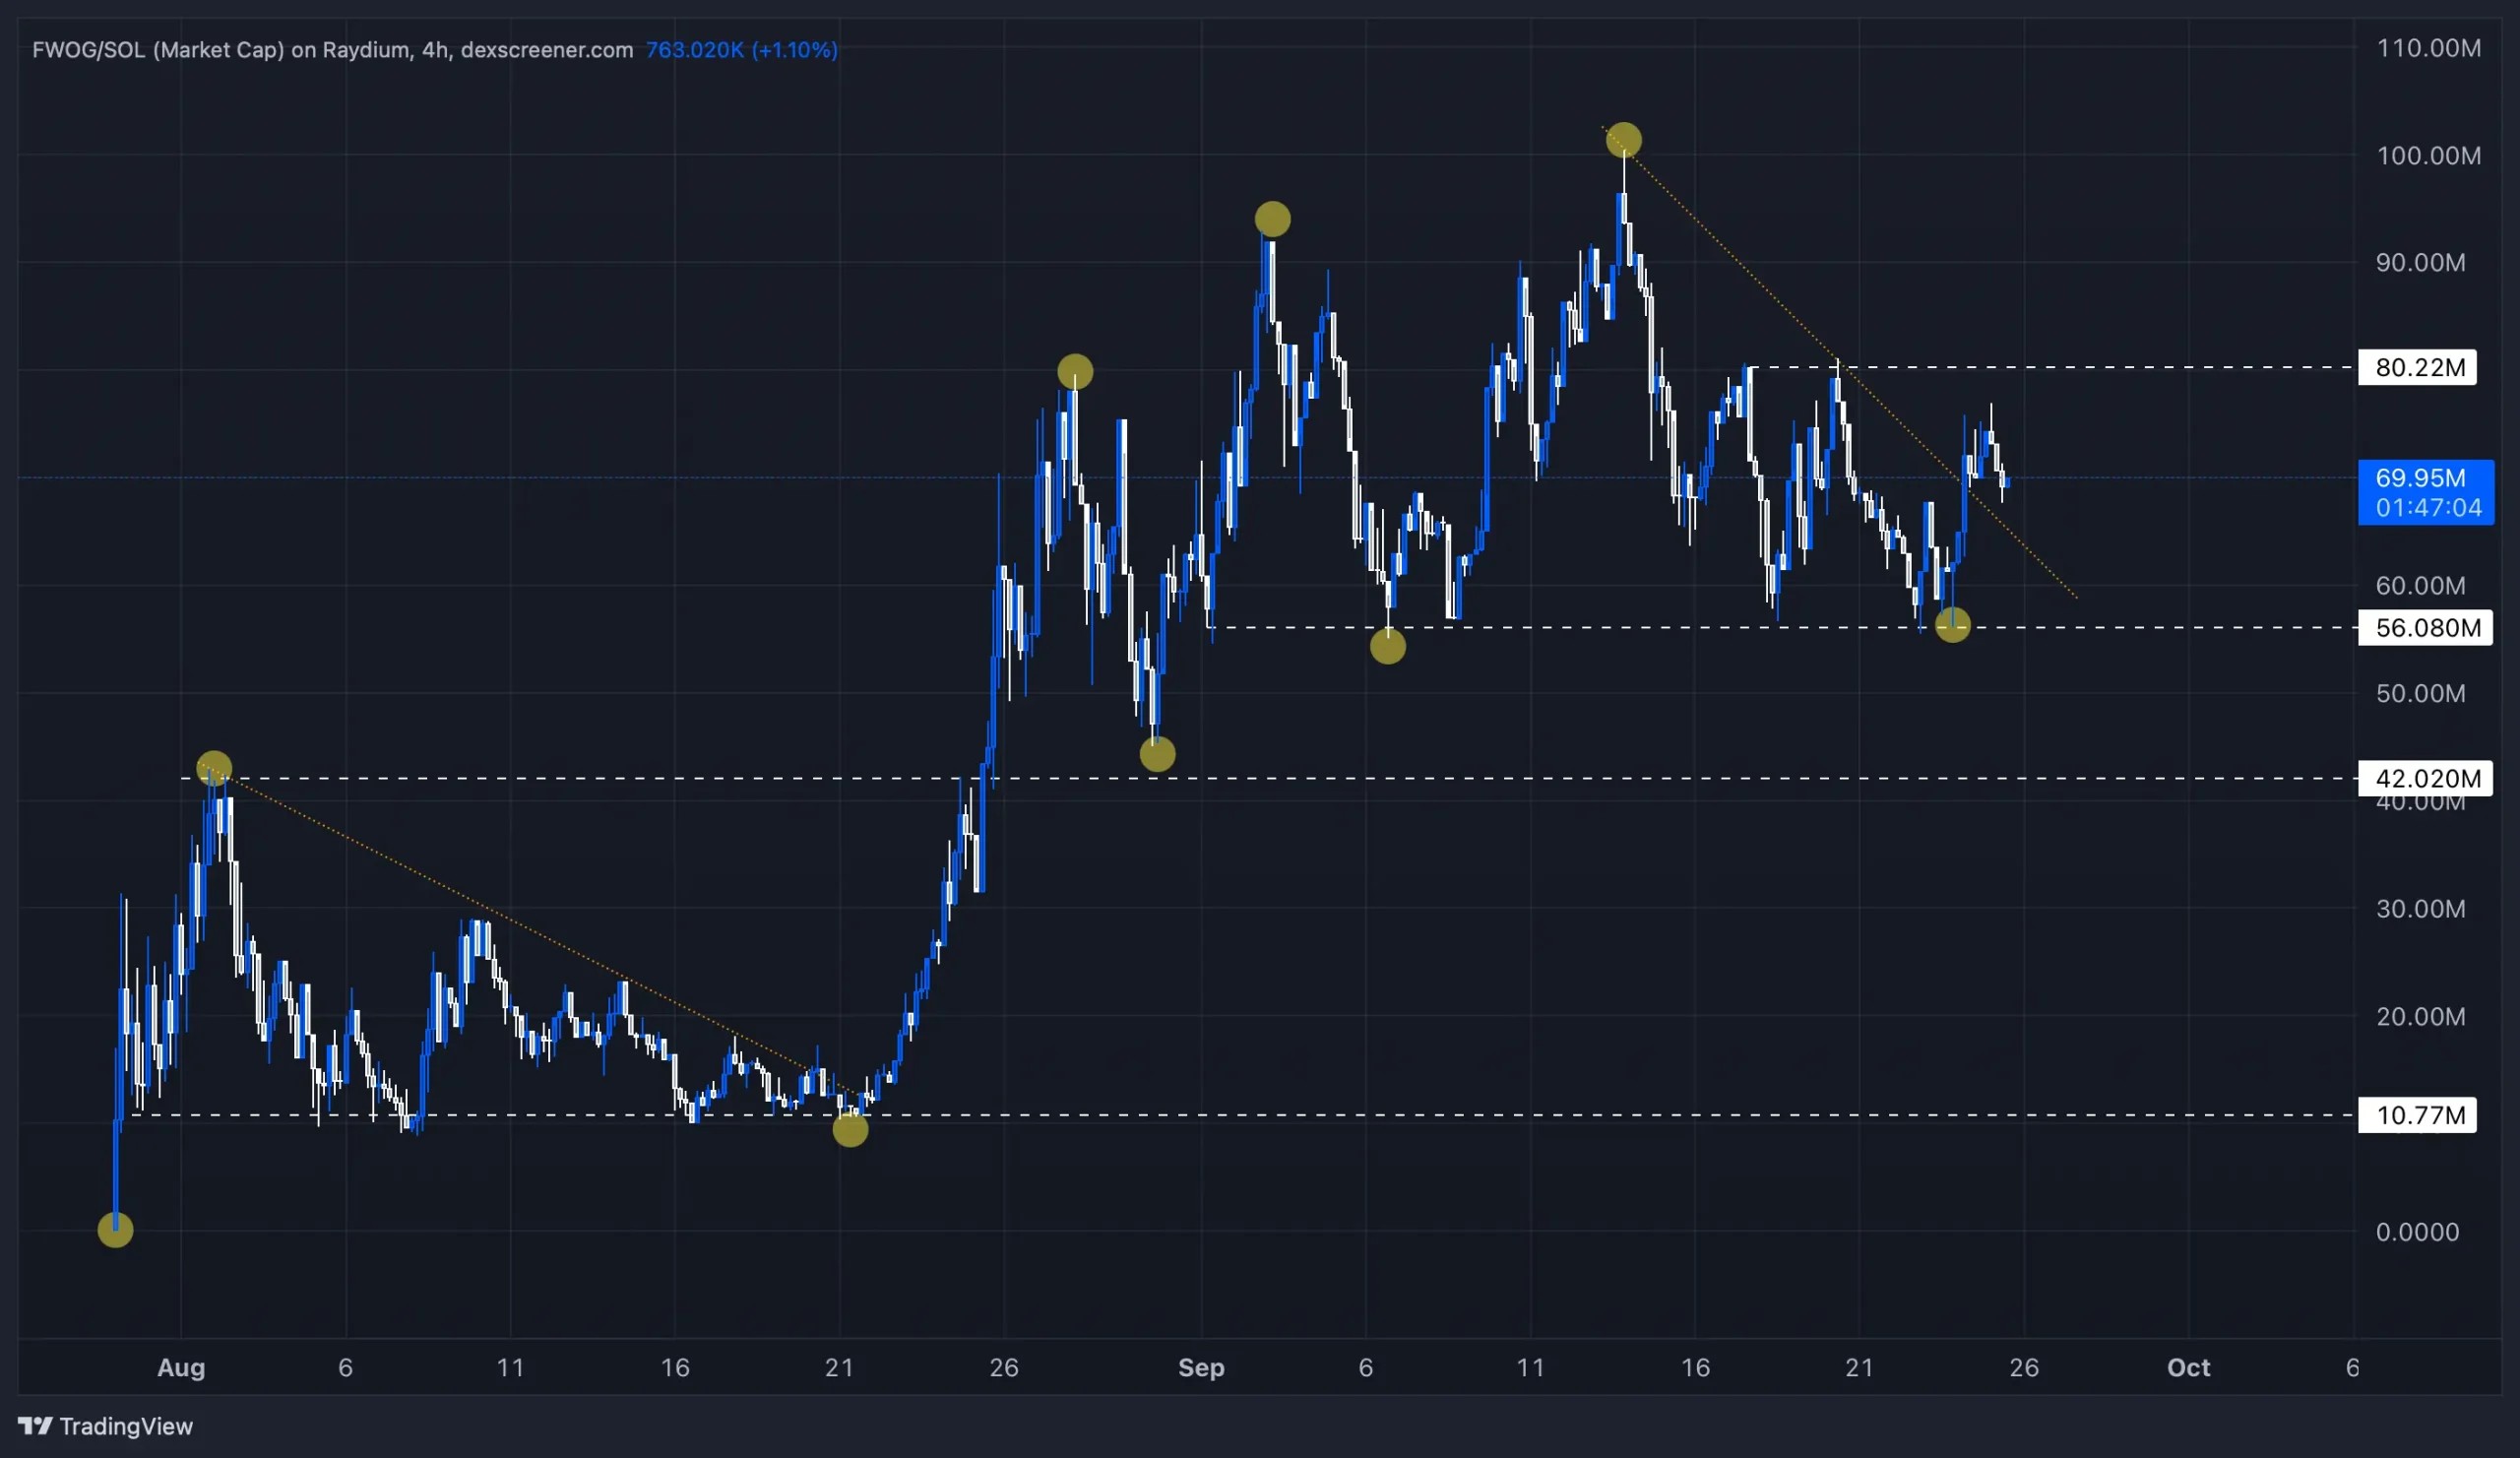
Fwog ($FWOG) has exhibited a clear bullish price action (PA) structure since its launch, forming consistent Higher Highs (HH) and Higher Lows (HL), as seen in the daily timeframe. This is a positive sign of accumulation and growing investor interest in the token. The highs and lows in this bullish structure are marked by yellow dots, which highlight the significant swing points in Fwog's price movement.Historical price action
After its ATH post-launch rally, Fwog entered a 23-day consolidation phase, where it maintained a strong base around the $10.7 million market cap level. This accumulation zone formed a reliable support that allowed Fwog to resist further downside. During this period, the price was squeezed in a descending structure, making Lower Highs (orange dotted line), which indicated some short-term weakness. However, this consolidation proved healthy, as it prepared the price for a breakout. When Fwog eventually broke out, it surged by an impressive 600%, reaching a market cap of $80 million.Current market structure
Following this explosive move, Fwog retraced from its ATH of $100 million to establish a new support base of around $56 million, which has since been a strong and well-tested zone. The coin has entered a sideways trading range between $56 million and $80 million, consolidating within these boundaries while attempting to break higher.Fwog has recently broken out of a downtrend trendline, but the price is still consolidating below the $80 million resistance level. This range will likely dictate the next major move, with a breakout on either side being crucial for price direction.
Key levels to watch
- Upside resistance: The $80 million market cap level is the immediate resistance. A breakout above this level would likely lead to a test of the $100 million ATH. Beyond the ATH, if momentum continues, Fwog could enter price discovery, opening the possibility for new highs.
- Downside support: The $56 million market cap remains a strong support level and has held up consistently after several retracements. If this level is breached, the next major support lies at $42 million, which would serve as a significant accumulation zone for long-term investors.
Potential accumulation zones
- $56 million: This has been a historically strong base where buyers stepped in during the previous retracements. It presents a solid opportunity for DCA (Dollar-Cost Averaging) entries.
- $42 million: If the price moves below $56 million, this is another potential accumulation zone for buyers to add positions.
Current market outlook
At the moment, Fwog is in a consolidation phase within the range of $56 million to $80 million, making this an important range for traders to monitor. Fwog has recently broken out of a downtrend, and while it's trading sideways, a break above the $80 million resistance could see a sharp move towards the ATH of $100 million.On the downside, $56 million continues to act as strong support. A break below that level could trigger further downside pressure towards the $42 million support zone. As the broader market heats up, Fwog is well-positioned for its next move, whether it's a breakout or a retest of its demand zone.
Cryptonary's take
Fwog has shown strength in both its consolidation phases and its breakout rallies, positioning itself as a strong memecoin play. The market structure remains bullish, but the next breakout will determine if Fwog continues its momentum towards its ATH or retests lower support zones.However, it's important to note that Fwog is a memecoin and highly volatile. While it has shown positive price action, the risks associated with investing in memecoins are significant. As always, Cryptonary has no financial interest in Fwog and has not invested in this asset. This analysis is provided for educational purposes only, and we urge investors to perform their own due diligence before considering any involvement in high-risk tokens like Fwog.
Recommended from Cryptonary


