Save 23% ($351) & Get a Free 1-1 Call with our Team ⏰ : 0d 2h 59m 43s
Market Direction

Across the board, we see an intriguing blend of bullish setups and consolidation patterns starting to emerge.
From a mechanics perspective, the funding rates and open interest levels suggest a healthy balance between long and short positions, supporting potential upside moves.
Let's see what the next few days bring.
TLDR
- For BTC, the structure remains bullish within a bull flag pattern, with the crucial support at $63,300 holding the key to a potential breakout towards all-time highs.
- ETH, on the other hand, is grappling with a relatively complicated chart, but the reset in RSI across timeframes provides a healthier backdrop for prices to climb higher,
- Moving on to SOL, the altcoin has bounced back from oversold territory, fueled by bullish divergences, and could gradually grind higher if it cements itself above the $151 resistance.
- In the meme coin arena, WIF remains the leading meme coin of this cycle, but it faces a crucial test at the $3.41 resistance.
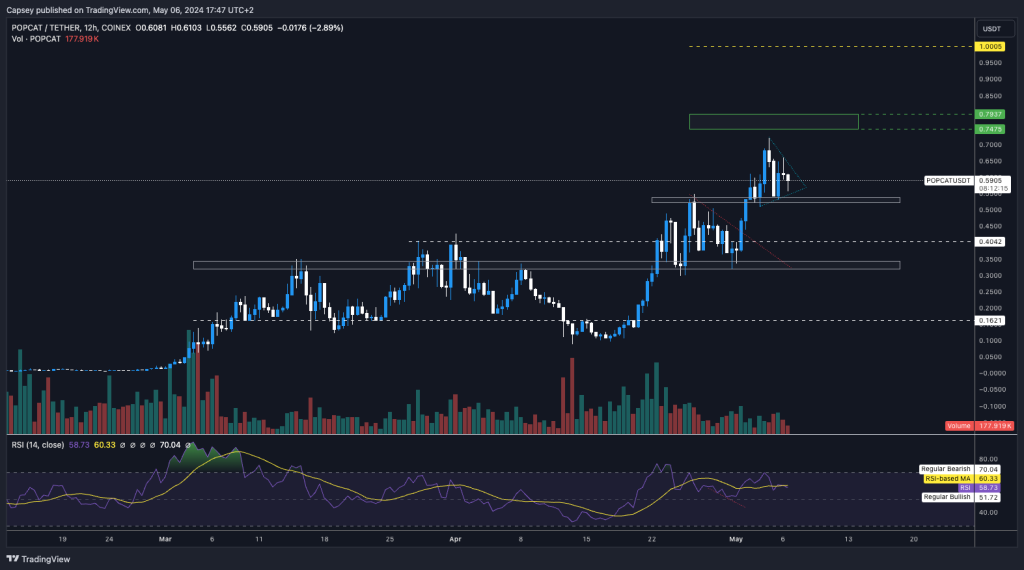
- POPCAT's clean chart and breakout from the pennant pattern could set the stage for multiples from its current price.
Disclaimer: This is not financial or investment advice. You are responsible for any capital-related decisions you make, and only you are accountable for the results. "One Glance" by Cryptonary sometimes uses the RR trading tool to help you quickly understand our analysis. These are not signals, and they are not financial advice.
BTC
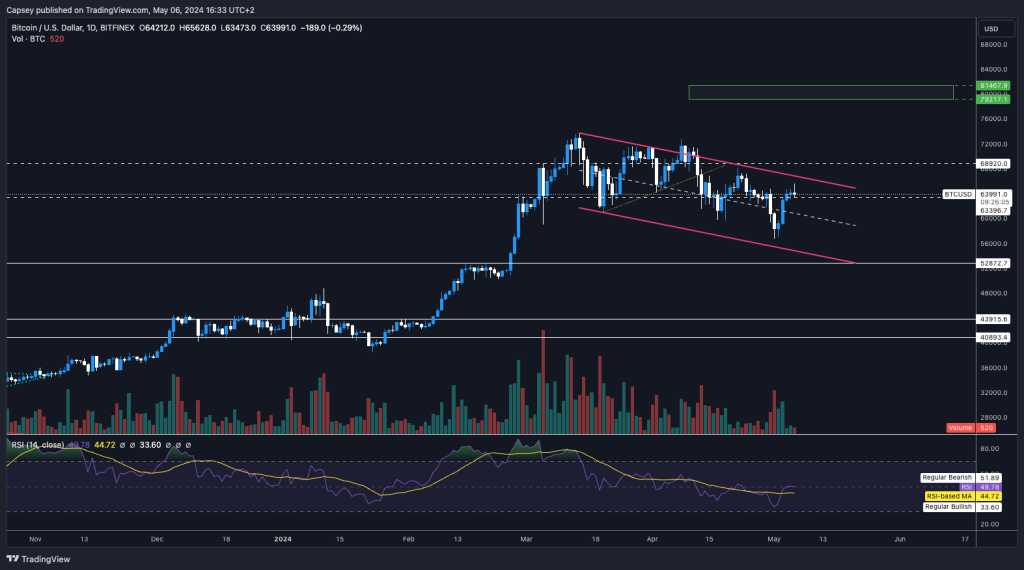
- From a mechanics perspective, BTC still looks clean here.
- The funding rate is between 0.00% and 0.01%, indicating even positioning between longs and shorts. That is what we want to see – even positioning is healthier.
- The Open Interest has increased slightly to $29b but remains well below the $36b highs we saw a few months ago.
- Overall, the market mechanics look healthy here, which supports prices potentially going higher.
Technical analysis
- The most recent bounce from the local lows of $57k has seen price move back into the top half of the bull flag, with price now above the 50% line of the flag and back above the horizontal resistance (now maybe new support) of $63,300.
- In the short term, its crucial price must hold above $63,300. If it can, this can fuel a bullish move higher that could potentially break out to the upside of the bull flag.
- The resistance levels for price to break out of are the top border of the bull flag and then the horizontal resistance of $68,900. Beyond this? The all-time high.
- The RSI is in the middle territory on the Daily chart, having bounced from close to oversold levels. This neutral area supports higher prices.
BTC weekly chart
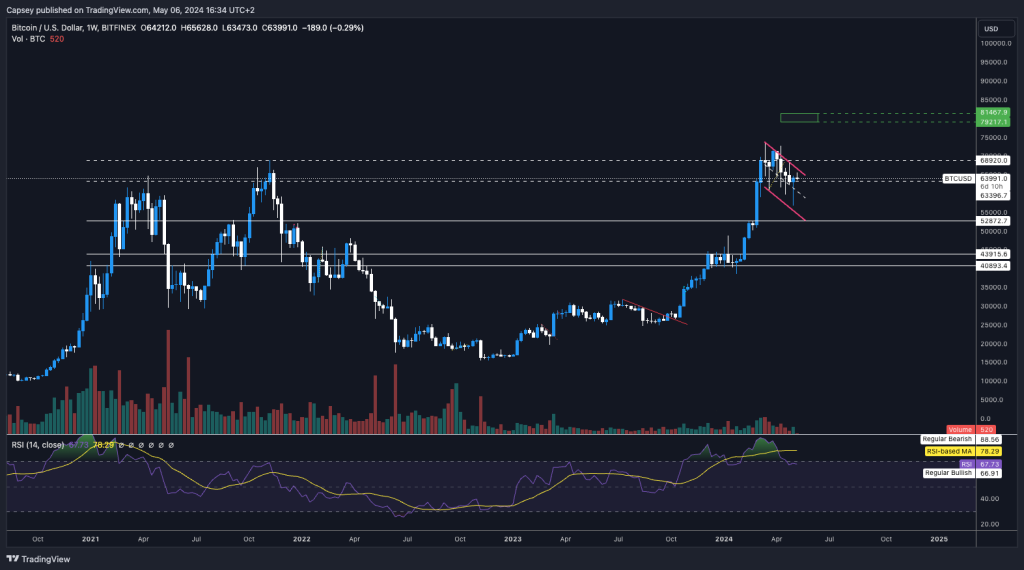
Cryptonary's take
Bitcoin is in a really nice spot here. It's important that price holds above $63,300 and then $60,000 if $63,300 is broken. But for now, the structure remains bullish, and with 'goldilocks' data from last week, this should support risk assets grinding higher in the coming weeks. I have also tagged the BTC chart in the weekly timeframe above. From a zoomed-out view on the Weekly, BTC looks to be holding a bullish structure in this bull flag pattern that should have a bias to break to the upside.ETH
- ETH hasn't seen much increase in its overall level of Open Interest, which remains just shy of $10b, well below the $13b highs we saw in March and April.
- Like BTC, the Funding Rate remains between 0.00% and 0.01%. An even positioning between Longs and Shorts = healthy.
- Again, it is a healthy setup from a mechanics perspective.
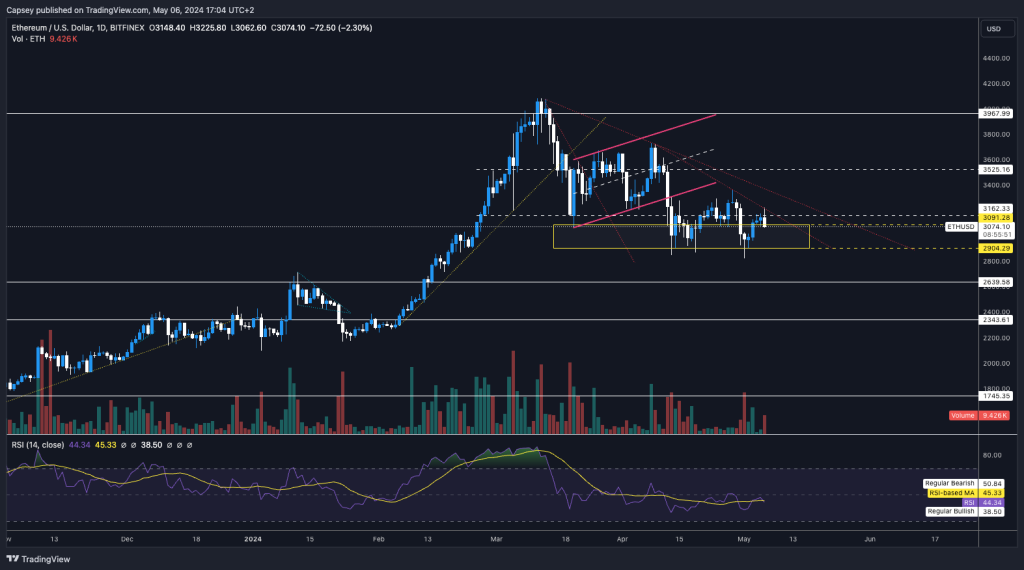
Technical analysis
- This is a relatively complicated chart. First, we have the breakdown of the bear flag, followed by several fills and bounces from the Yellow Buy Box.
- Price has now moved into the local downtrend lines (red lines), and price has initially rejected today at the local horizontal resistance of $3,160.
- Having worked several times, the Yellow Buy Box will become more redundant as it is tested.
- The major support will be $2,900.
- The breakout will come with price getting above the $3,160 local horizontal resistance and breaking out of both downtrend lines.
- The RSI's have reset on all timeframes, providing a healthier backdrop for prices to go higher.
Cryptonary's take
ETH looks good to breakout to the upside in the coming week or so. However, if the support at $2,900 is retested again, the chances of it breaking (to the downside) this time will be higher, and therefore, the potential downside could be to $2,600. However, we believe ETH will likely break out to the upside in the coming weeks.SOL
- SOL's Open Interest has increased slightly to $1.7b, but it still remains well below the peak of $2.86 b we saw in late March/early April.
- SOL's Funding Rate is at 0.01%. There is still a healthy positioning setup between Longs and Shorts, with a slight bias towards Longs.
- Overall, the above is a healthy leverage setup.
Technical analysis
- SOL has bounced, having put in two bullish divergences on the Daily timeframe, close to oversold territory. This is a prime setup to provide a bounce, as we called in the last SOL 👀・market-direction.
- We saw the major support being between $126 and $132, and even though price broke into the low $ 120's, we have seen a recovery from there, fuelled by the bull divs.
- SOL is now at a horizontal resistance of $151, with a larger resistance at $170.
- Going forward, SOL may be range-bound between $131 and $151 if it cannot break out above $151. If it can, this may increase the range-bound band from $131 to $170, but you'd want to see price stabilise above the mid-level, which would be $151.

Cryptonary's take
While we don't expect too many fireworks in the near term, SOL can gradually grind higher over the coming week, particularly if it cements itself above $152. If price doesn't, then we would still be comfortable if SOL stays north of $131. Below $131 is when we'd have to seriously re-assess our position.WIF
- What was originally a head `and shoulders chart pattern, which would usually have a bearish bias, bounced for a second time from the Yellow Buy Box.
- Price has now moved back into the horizontal resistance of $3.41 and is initially rejecting from that level.
- To see a bullish reversal for price, we'd need to see a clean break above and close above the horizontal resistance of $3.41.
- If the price were to break down as low as $3.07 again, there would be local horizontal support at $3.07 and more major support at $2.23.
- The RSI has been reset on the Daily and the 3D timeframe following the price pullback over the last month.
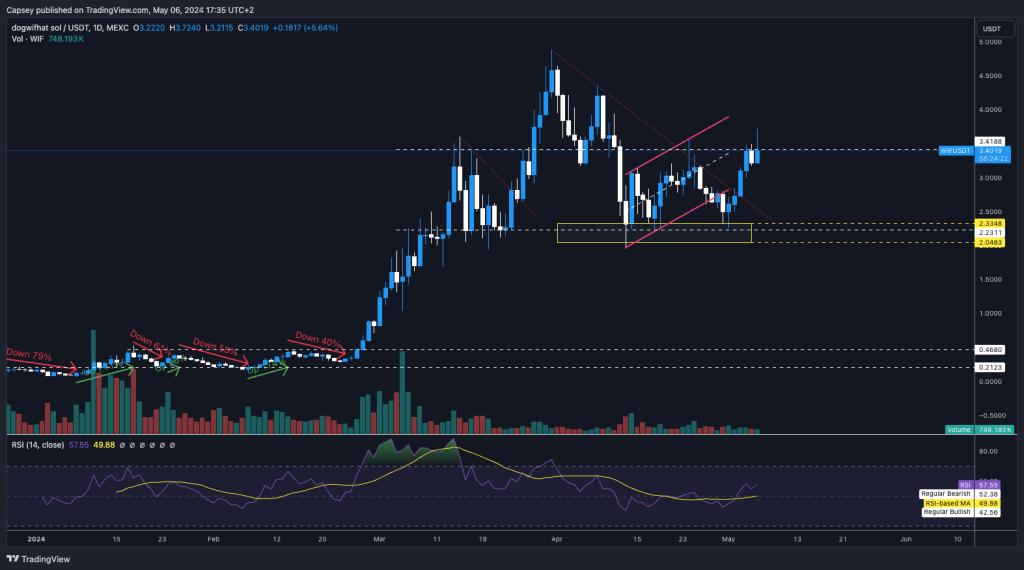
Cryptonary's take
Just 4-5 days ago, we were presented with a great opportunity to accumulate WIF, which we see as the leading meme coin of this cycle, at the Yellow Buy Box of $2.30. The price has since been up 50%. Currently, WIF is at a crucial point, finding resistance at the $3.41 level. To see a sustained upside, we need a breakout of this level. Thankfully, WIF has support at $3.07; this should provide a cushion to help the price make the breakout.POPCAT
- The POPCAT chart does look really clean here.
- We have seen a breakout of the red downtrend line, with price having found support in the grey box between $0.33 and $0.35.
- Price then broke out of the prior high of $0.52 before popping up to $0.70 and retesting the previous high of $0.52 as new support.
- Price is now forming a pennant pattern. These usually have a bullish bias, although we have seen some of these structures break down in other coins, so this is something to be wary of.
- The RSI remains relatively ok, between 58 and 64 on the 12-hour and Daily timeframes. This should allow for further upside.
Cryptonary's take
Whilst price may break down from the pennant pattern, we remain really constructive on POPCAT. We still see it as one of the meme plays that could be one of the major winners of this cycle. Ideally, we'd see POPCAT breakout to the upside of the pennant pattern, but if there is a breakdown, there are many horizontal supports.Let's see how this plays out, but ultimately we remain very constructive on POPCAT and believe it can still do multiples from the current price. Meaningful dips should be bought into.
Recommended from Cryptonary


PRO
Market Direction
13 min read
Mar 17, 2026
PRO
Market Direction
12 min read
Mar 13, 2026

PRO
Market Direction
13 min read
Mar 10, 2026
