Save 23% ($351) & Get a Free 1-1 Call with our Team ⏰ : 0d 2h 59m 44s

Disclaimer: This is not financial or investment advice. You are responsible for any capital-related decisions you make, and only you are accountable for the results.
Pepe ($PEPE):
Overview
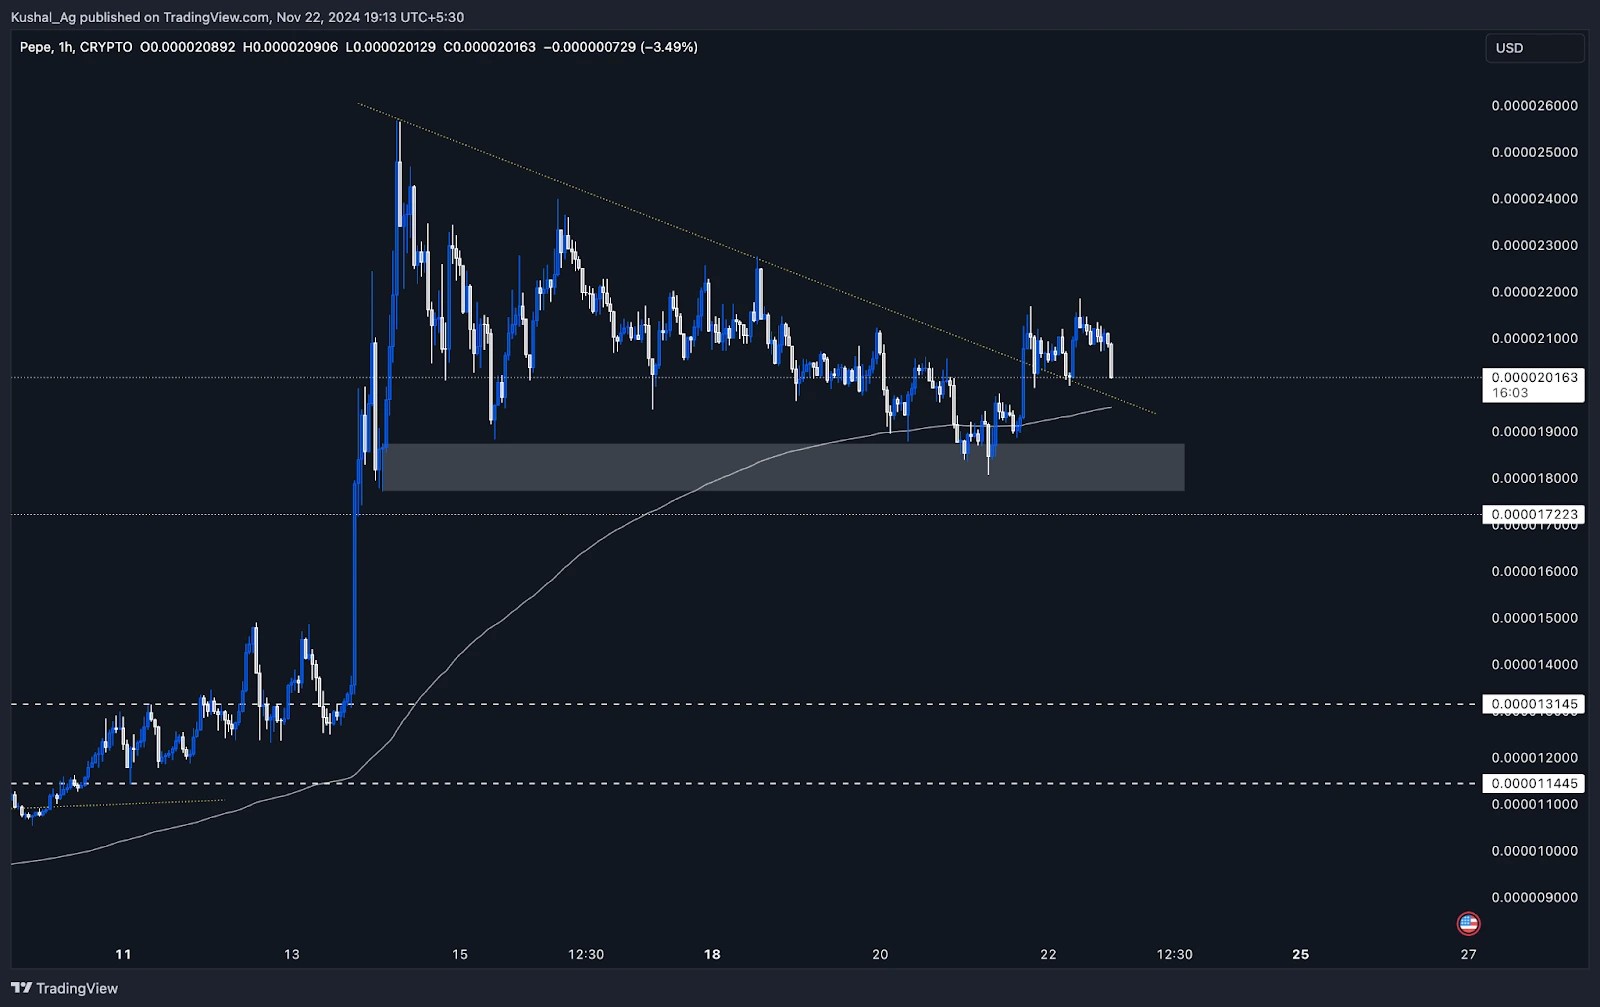
$PEPE has maintained strong momentum after its Coinbase listing and a significant rally. It has now entered a consolidation phase, trading sideways above its previous all-time high of $0.0000172, which was set in May 2024. Currently trading at $0.00002, $PEPE has been holding key support levels, showing potential for another move higher.One-hour time frame analysis
● Key levels:- Demand zone: The updated one-hour demand zone ranges from $0.0000187 to $0.0000177. $PEPE has been taking consistent support from this zone for over a week.
- Previous all-time high support: The $0.0000172 level, the previous all-time high, is just below the current demand zone and serves as a secondary support.
- 200 EMA: The one-hour 200 EMA is positioned at $0.0000194, acting as an additional dynamic support.
- $PEPE recently broke out of a short-term downtrend trendline (yellow) in the one-hour time frame, formed after its new all-time high of $0.0000256. This breakout indicates potential for a continuation of its bullish momentum.
- The price is currently holding above both the trendline and the 200 EMA, consolidating within a tight range.
- Bullish continuation: If $PEPE sustains above the one-hour demand zone and breaks above $0.0000215, it could challenge its all-time high of $0.0000256 again in the short term.
- Liquidity grab: If the price dips below the demand zone for a quick liquidity grab, the $0.0000172 support and the previous all-time high could act as a springboard for a recovery.
Cryptonary's take
$PEPE remains a standout performer in the current memecoin cycle, consolidating after a remarkable rally. Its ability to hold the one-hour demand zone and the 200 EMA adds credibility to the bullish structure. While the consolidation phase continues, maintaining support at $0.0000187 and sustaining above the previous all-time high at $0.0000172 is crucial for further upside momentum.On the flip side, a break below these levels might lead to a deeper pullback. However, the overall structure remains positive, with $PEPE showing resilience and potential for further gains in the coming sessions.
Chainlink ($LINK):
Overview
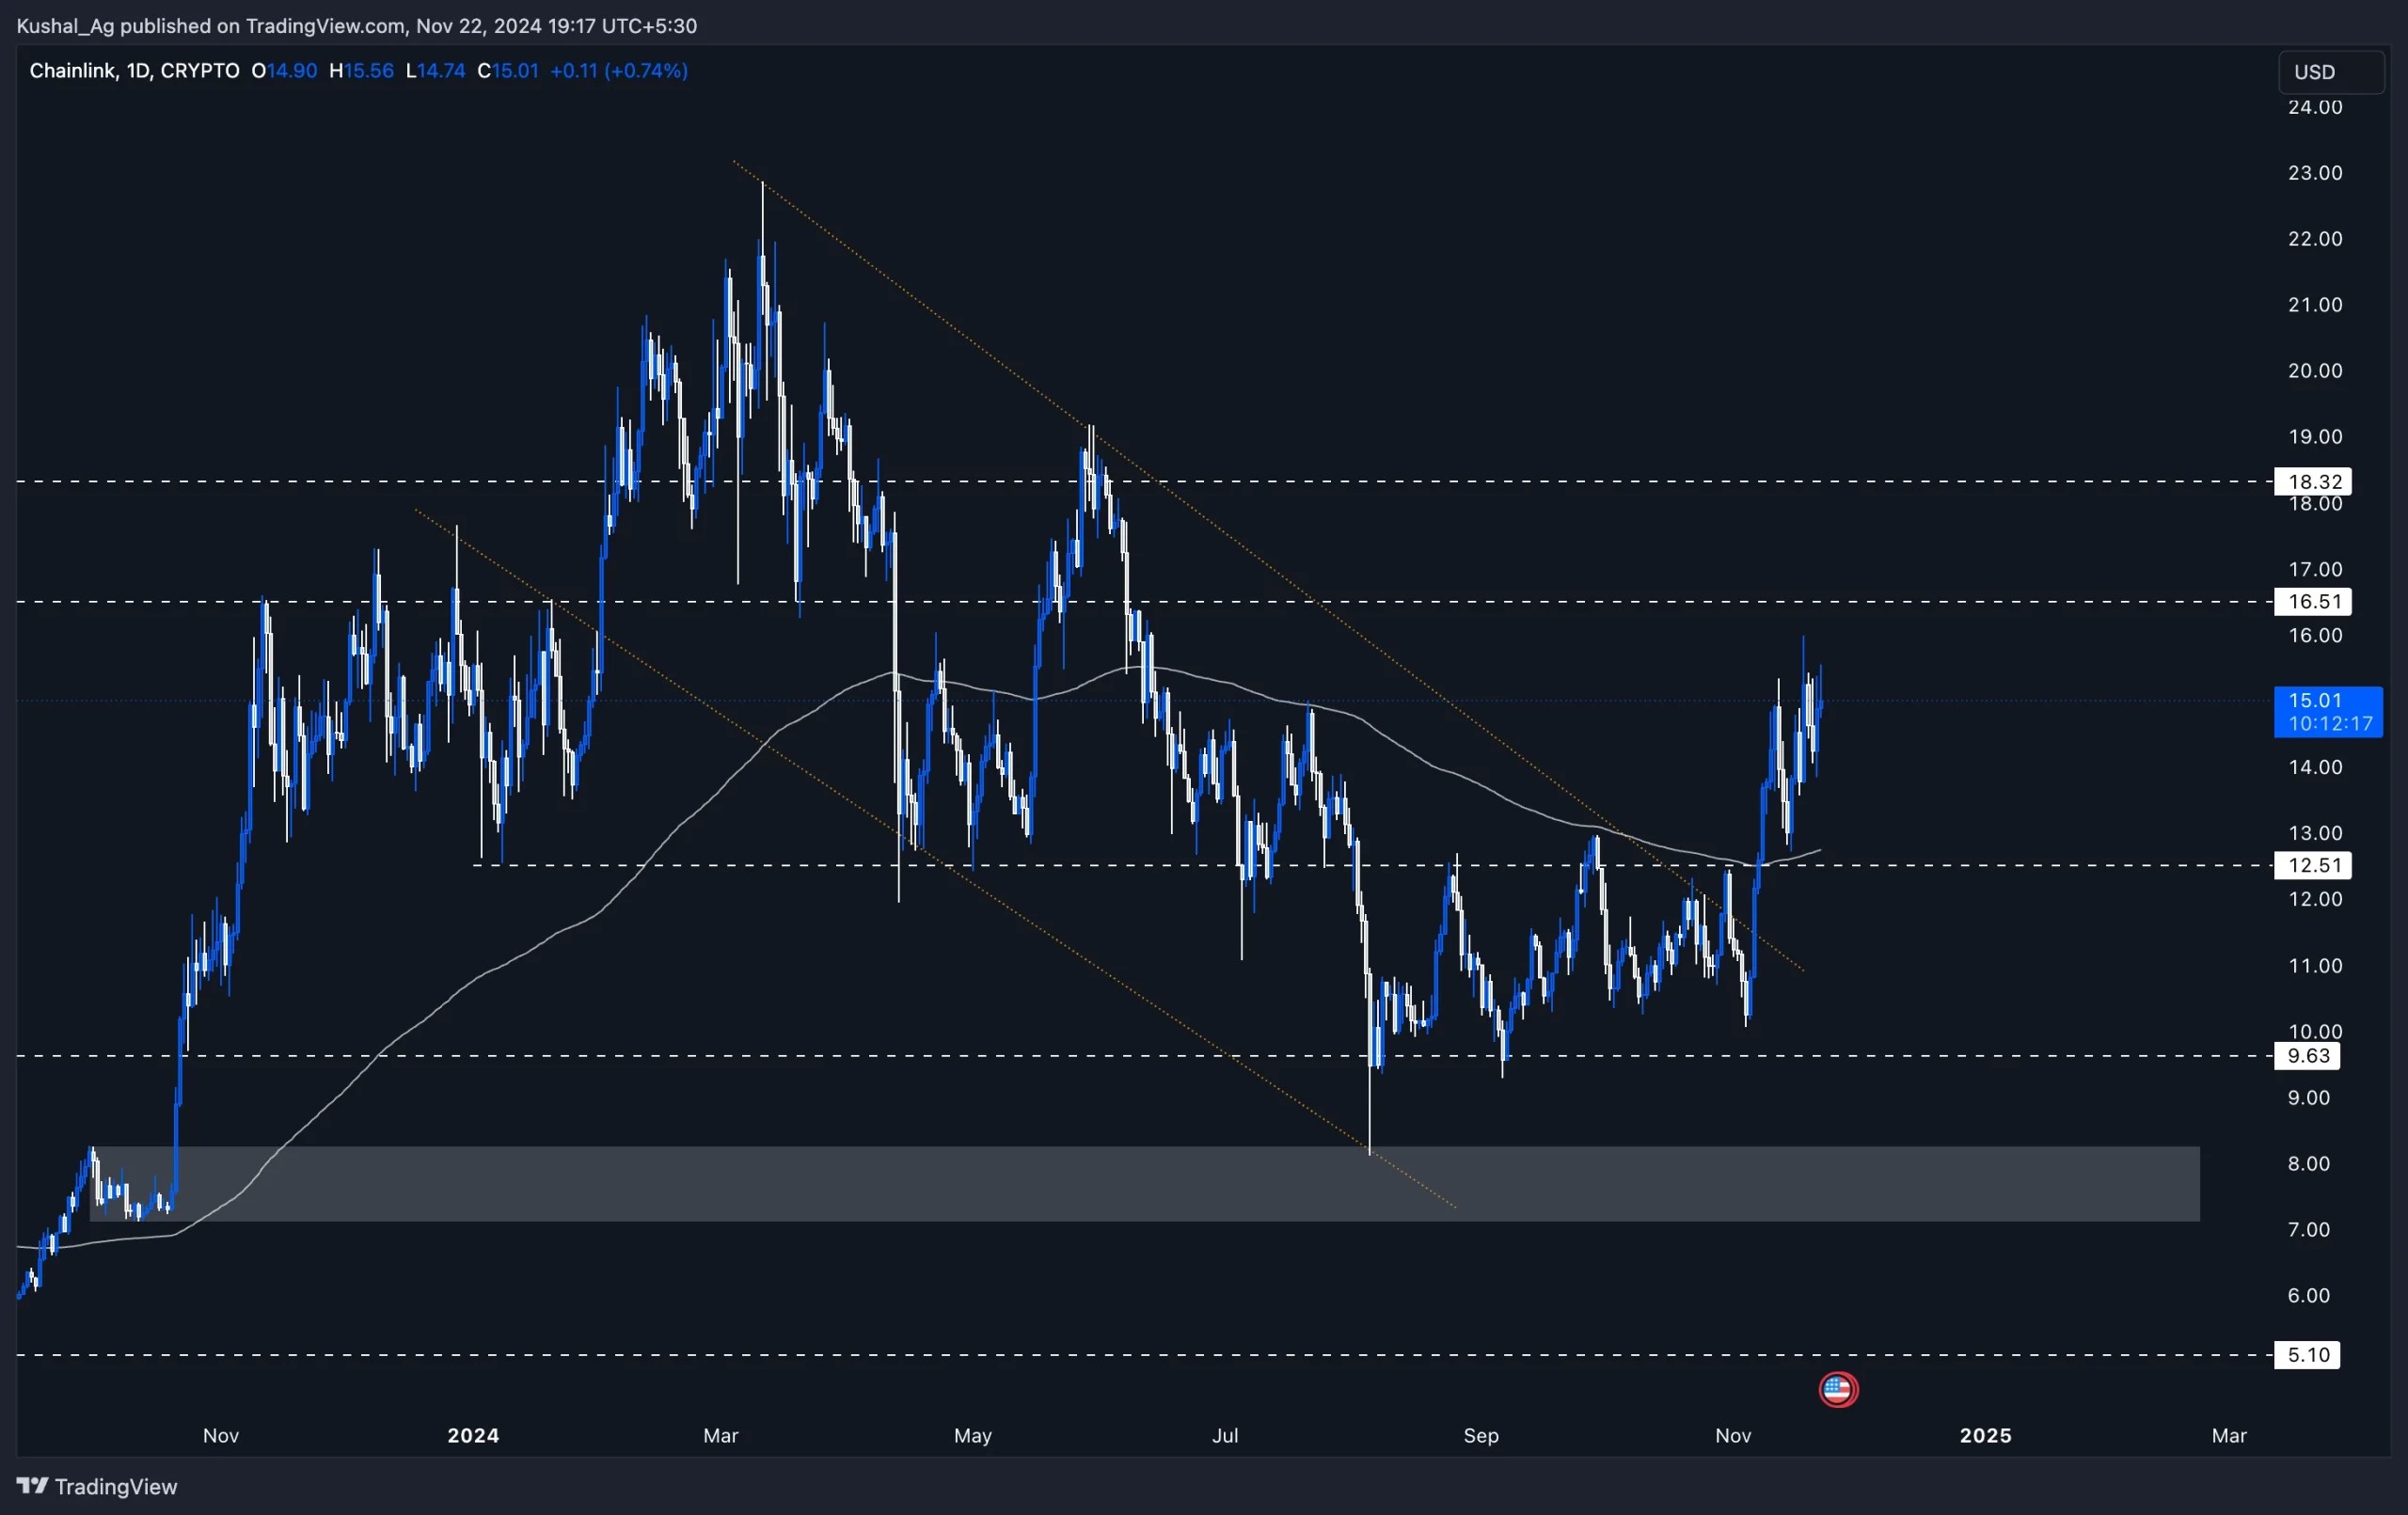
Chainlink ($LINK) continues to exhibit strong bullish momentum on the daily time frame. After a prolonged retracement within a bull flag pattern since hitting its higher high of $22.8 in March, $LINK has finally broken out of the flag and is showing significant strength. Currently trading at $15.1, it has also flipped the 200 EMA into support, solidifying its bullish structure.Daily time frame analysis
● Key breakouts:- $LINK has decisively broken out of the $12.5 - $9.63 range, which it had been consolidating for months.
- It has reclaimed the 200 EMA, now trading well above it. The 200 EMA is positioned at $12.78, further confirming the bullish shift.
- $12.51: This level, part of the previously broken range, now serves as a strong support.
- 200 EMA at $12.78: A crucial dynamic support that $LINK must hold to sustain its bullish momentum.
- $16.51: The next key resistance is on the upside, where we may see some profit-taking or hesitation.
- $18.32: A medium-term target if $LINK continues to hold its bullish structure and maintain upward momentum.
Cryptonary's take
Chainlink ($LINK) is showing clear signs of strength after breaking out of its bull flag and consolidative range. Flipping the 200 EMA into support is a major bullish indicator, and its current price action above key levels indicates that the asset is gearing up for further upside.With the wider market consolidating, $LINK's resilience and strong price action make it a standout performer. The next few weeks could see $LINK testing $16.51 and potentially higher levels. However, holding above $12.78 and sustaining its position above the breakout zone is crucial for maintaining this bullish trend.
$LINK looks poised for further gains as the market heats up. Keep an eye on those key levels!
RUNE:
Market context
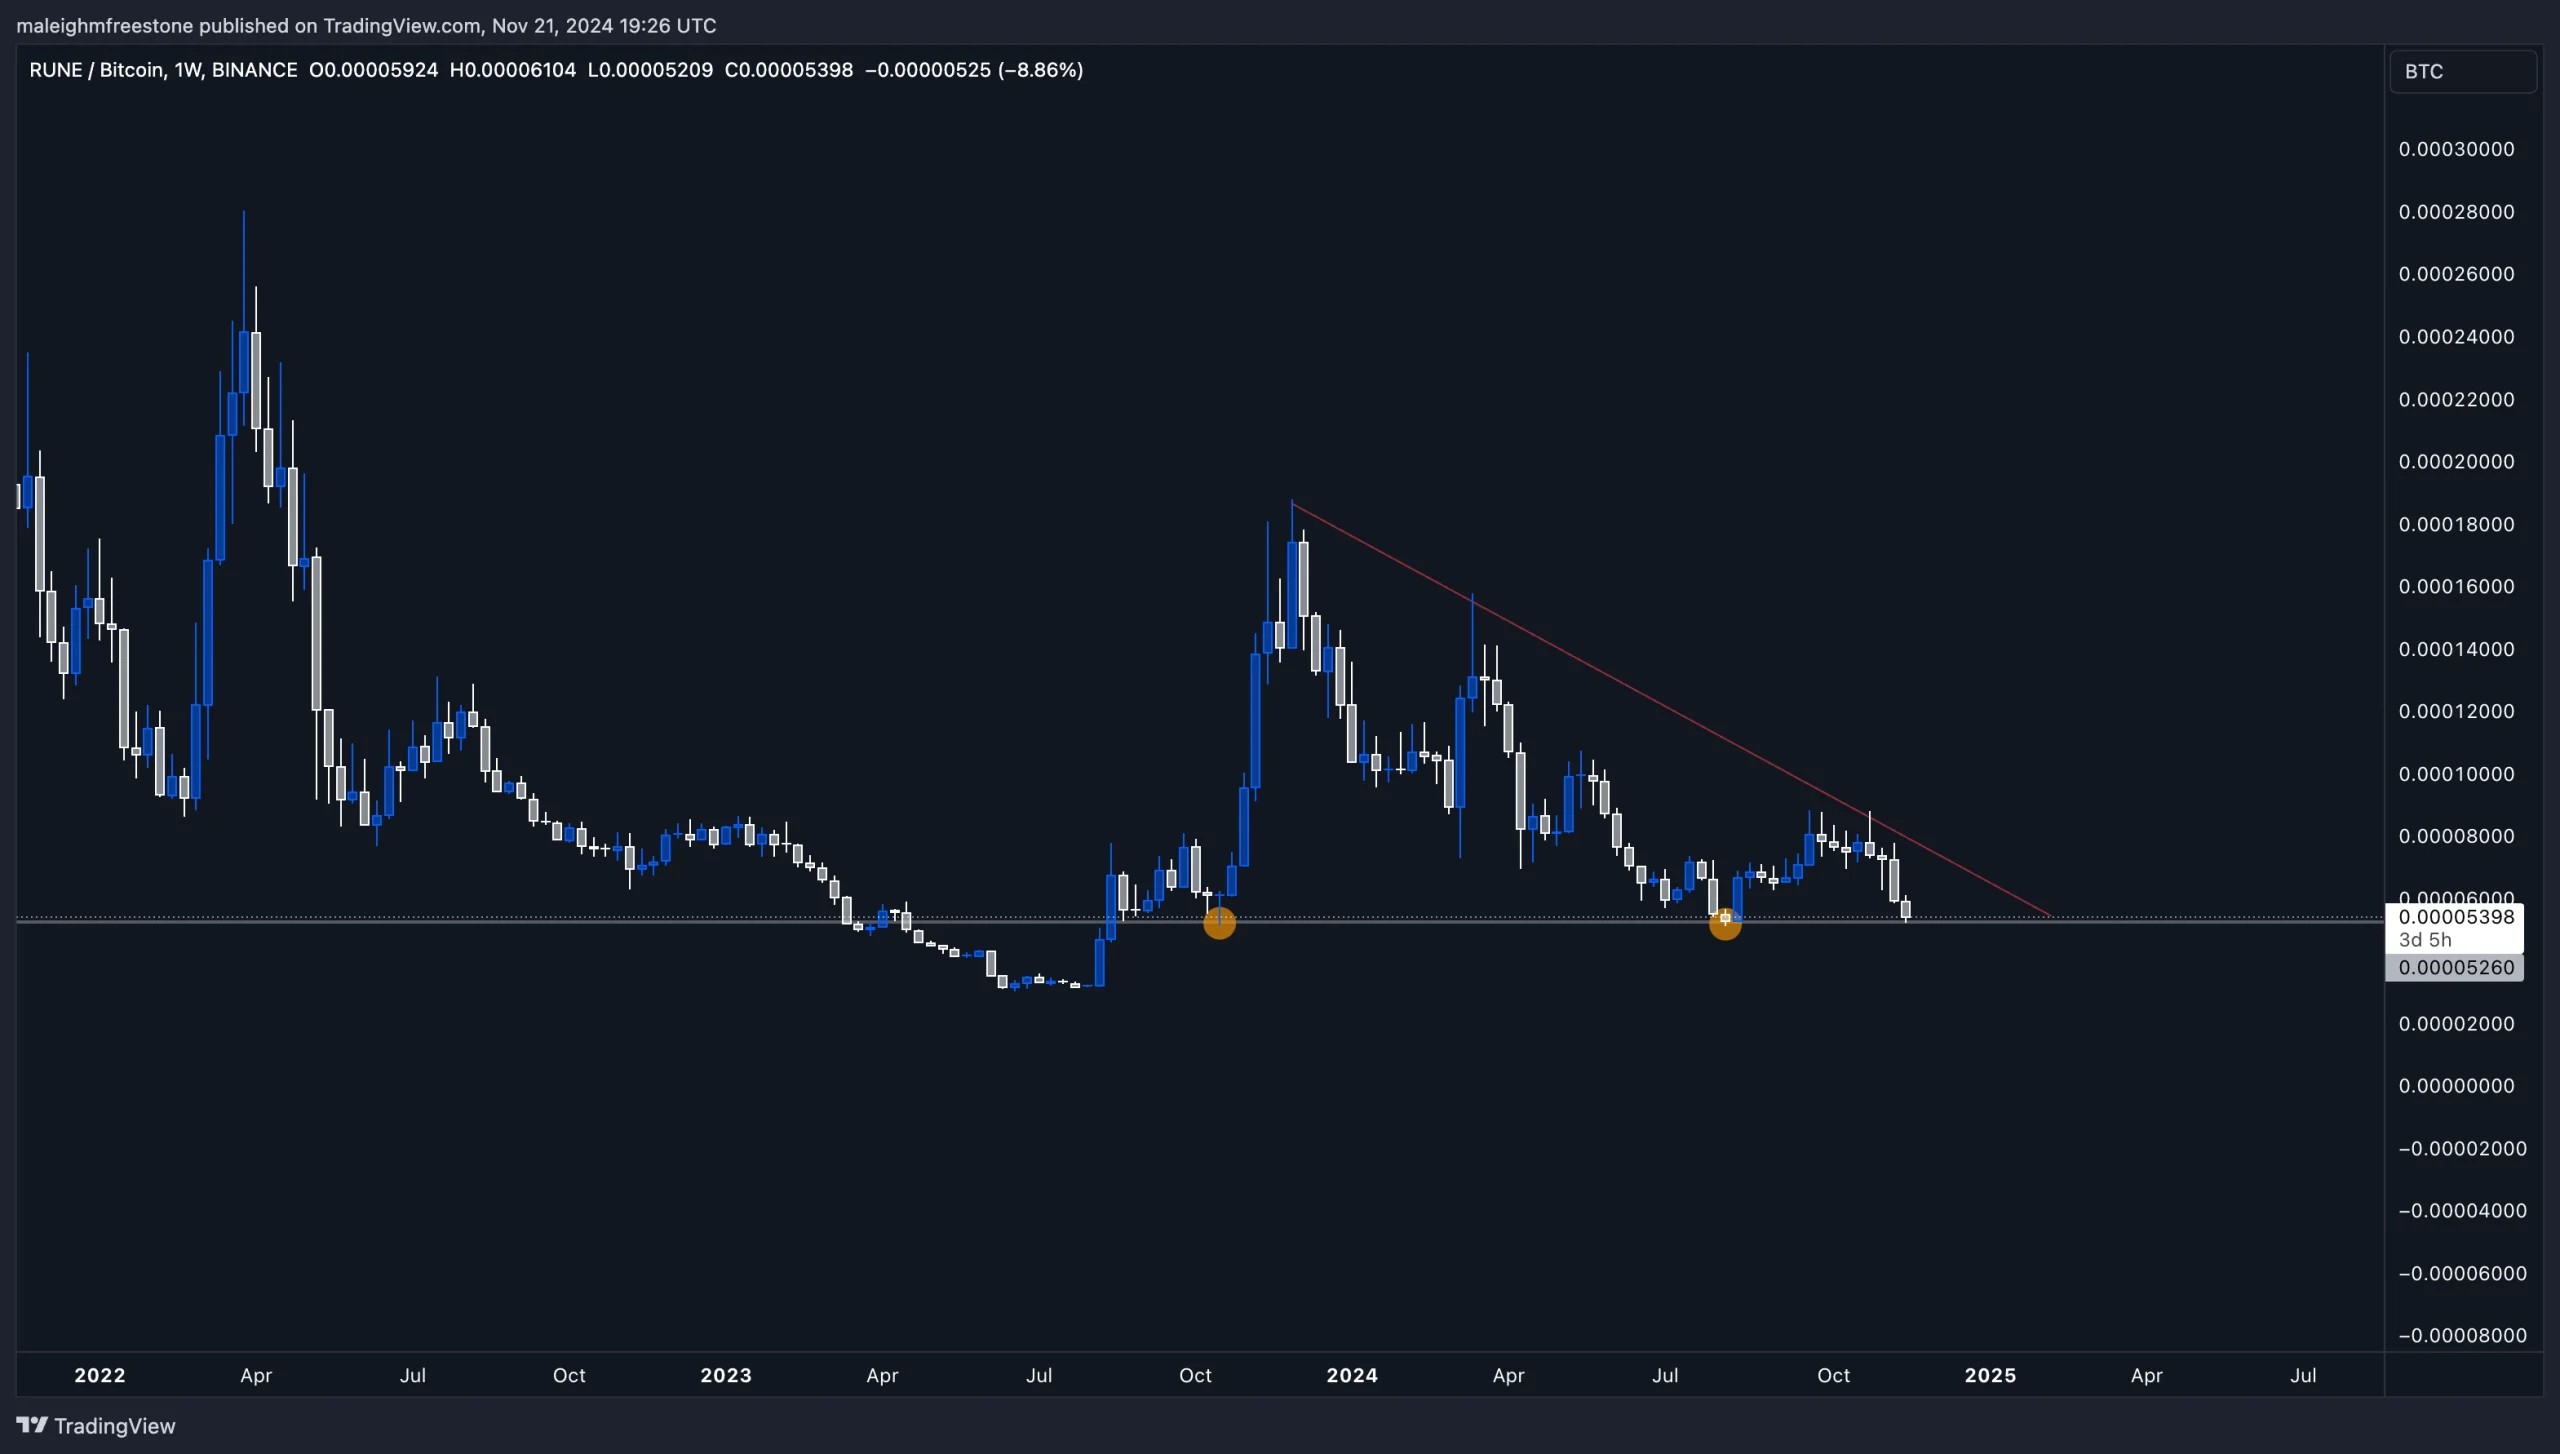
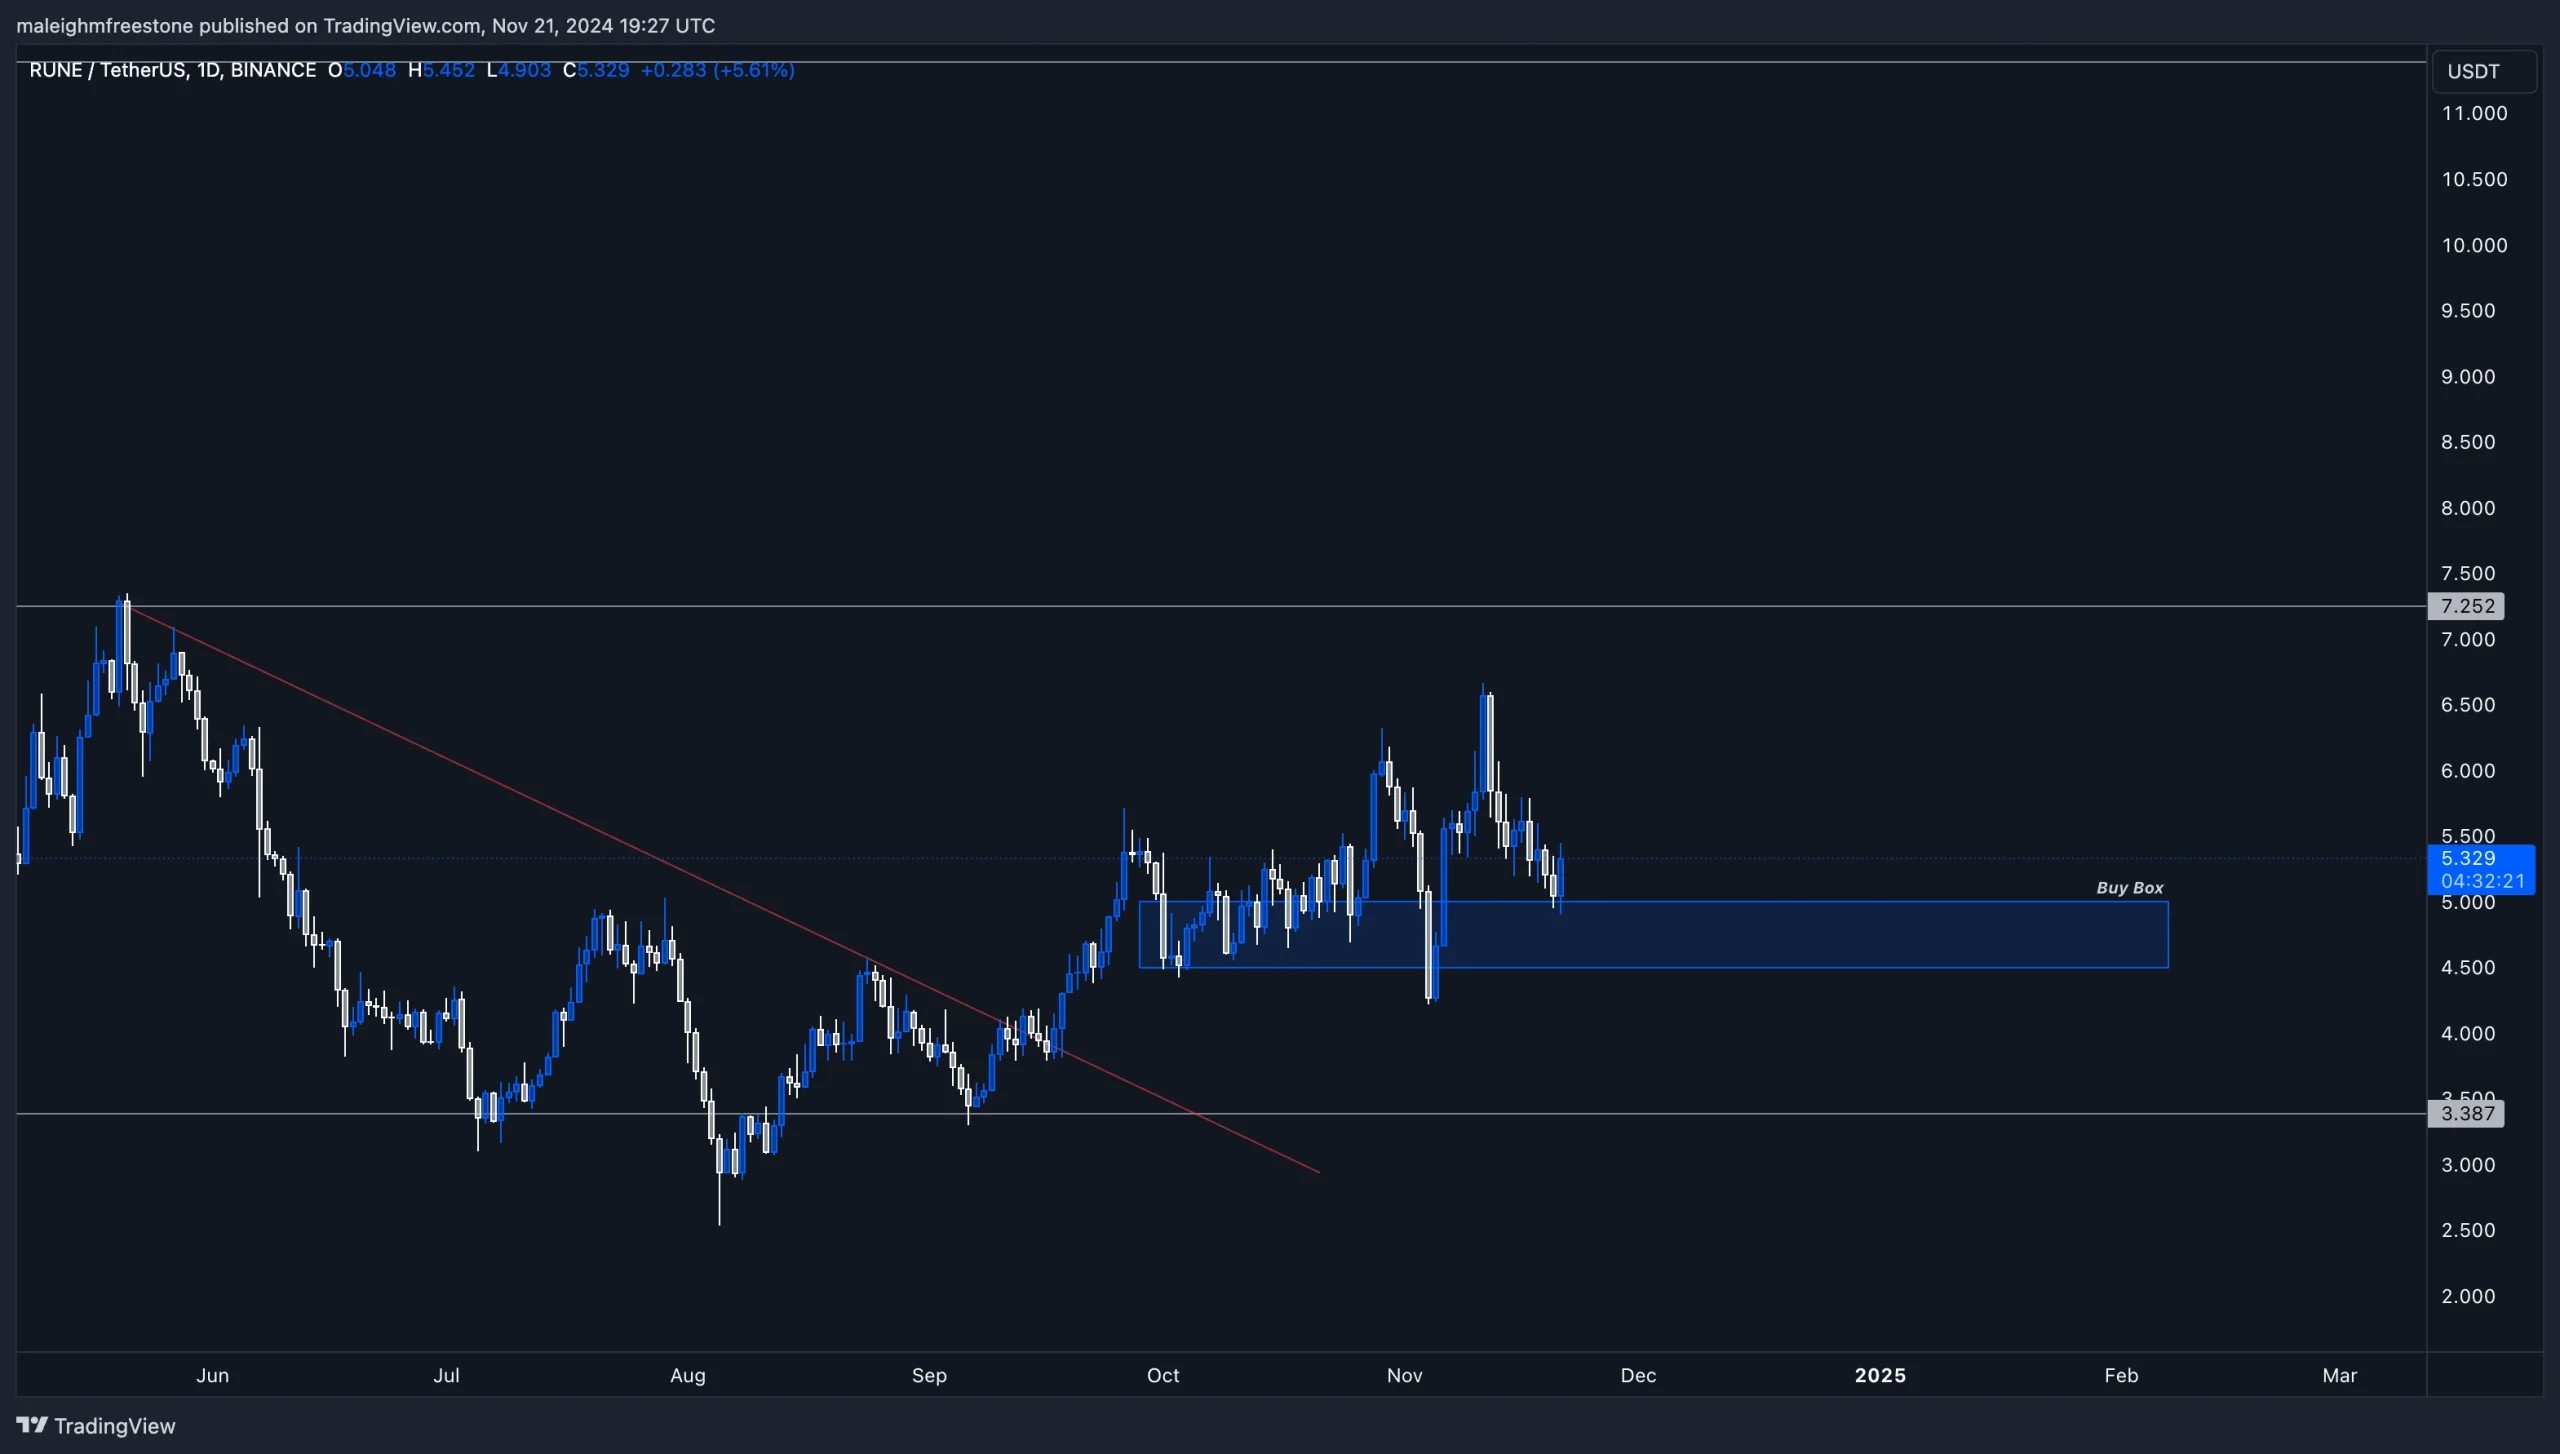
As anticipated, RUNE continues to deliver strong price action, aligning beautifully with our prior analysis. Looking at RUNE/BTC, we've tapped that key horizontal level perfectly, which we identified by the two orange dots. This has formed a wedge pattern against BTC, signalling the potential for a breakout if Bitcoin's rally stabilises.On the USD chart, RUNE has also bounced cleanly from our $5-$5.5 buy box, demonstrating the power of well-placed levels. The correlation between Bitcoin's strength and RUNE's price movement remains clear.
With BTC hitting all-time highs at the time of this analysis, the market's momentum continues to influence RUNE significantly. If Bitcoin sees a reset or consolidation, we could see capital rotating into RUNE, potentially triggering another run from the buy box to higher targets.
Playbook
Spot accumulation zone:- Maintain focus on the $5-$5.5 buy box. Any retracement back to this level provides another accumulation opportunity.
- Watch the wedge pattern forming on the RUNE/BTC pair. A breakout here could signal additional strength and upside.
Key levels
USD Chart:- $5.0-$5.5: Buy box and support zone.
- $7.0: Immediate breakout target.
- $10-$11: Medium-term upside targets.
- The horizontal level from the prior analysis is now a confirmed support zone.
- Wedge breakout to watch for further bullish momentum.
Cryptonary's take
With BTC climbing to new highs, the market is favouring BTC dominance. However, a potential reset or capital rotation could bring attention back to RUNE, especially given its technical structure on both USD and BTC charts. The buy box at $5-$5.5 continues to offer a great entry zone, and the wedge formation against BTC adds another layer of bullish potential.As the broader market heats up, RUNE remains a strong contender for further upside. Patience, careful positioning, and maintaining a focus on key levels are essential to capitalizing on this setup.
Recommended from Cryptonary


