Bulls and bears lock horns over LINK: Who will triumph?
For LINK, the technical indicators paint a picture of an overbought asset teetering on the brink of a flush-out. This isn't just any routine market fluctuation; it's the kind of drama that often has traders glued to their screens.

What’s next for LINK?
TLDR
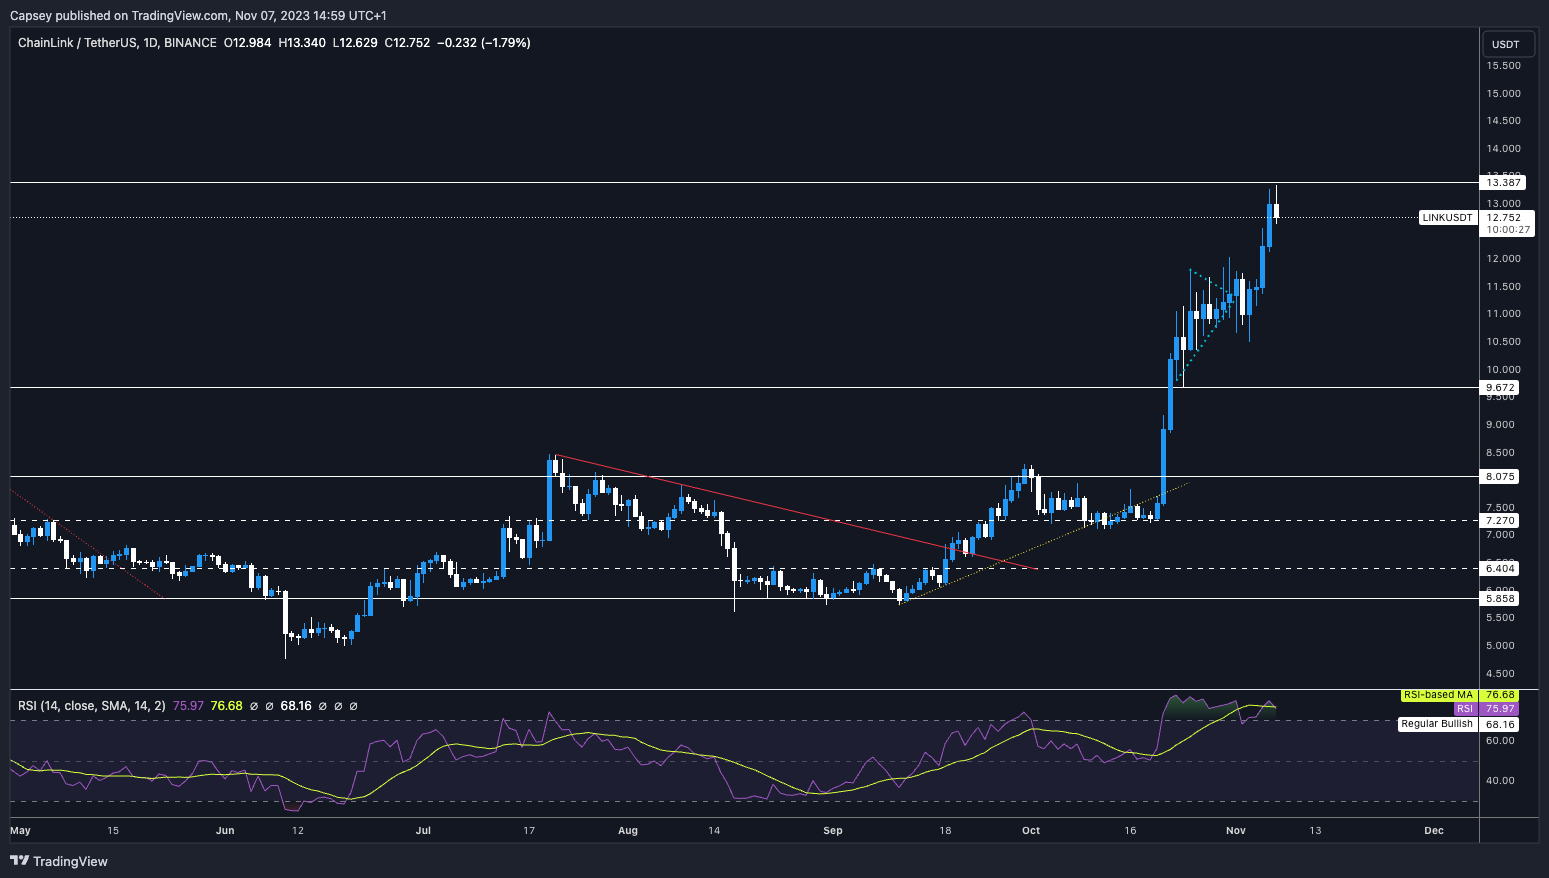
- LINK is currently at a pivotal point, having surged into a resistance range between $9.67 to $13.38.
- The immediate support is between $11.00 and $11.60, with critical horizontal support at $9.67.
- The RSI indicates an overbought scenario, suggesting the likelihood of a correction.
- We advise caution with LINK at this juncture; a significant pullback is likely if the current market conditions persist.
Disclaimer: Not financial or investment advice. You are responsible for any capital-related decisions you make, and only you are accountable for the results. “One Glance” by Cryptonary sometimes uses the RR trading tool to help you quickly understand our analysis. They are not signals, and they are not financial advice.
Technical analysis
From a technical analysis perspective, LINK now finds itself in the upper range of $9.67 to $13.38, having broken out of the 2-year range from the $5.00 area to the $9.60 area. LINK has now found resistance at the $13.38 horizontal resistance and has initially rejected from that level. The local support is between $11.00 to $11.60, with the most major horizontal support at $9.67.LINK 1D
Market mechanics
RSI remains phenomenally overbought on the daily and the 3D timeframe, which would suggest a more significant retest is needed at some point, likely meaning price will need to come down.When we look at the funding rates, we’re relatively positive, but the rate has come down in the last 24 hours from very positive levels. But, we can see in the chart below (far right-hand side) how much it fluctuates from being very positive to slightly positive.
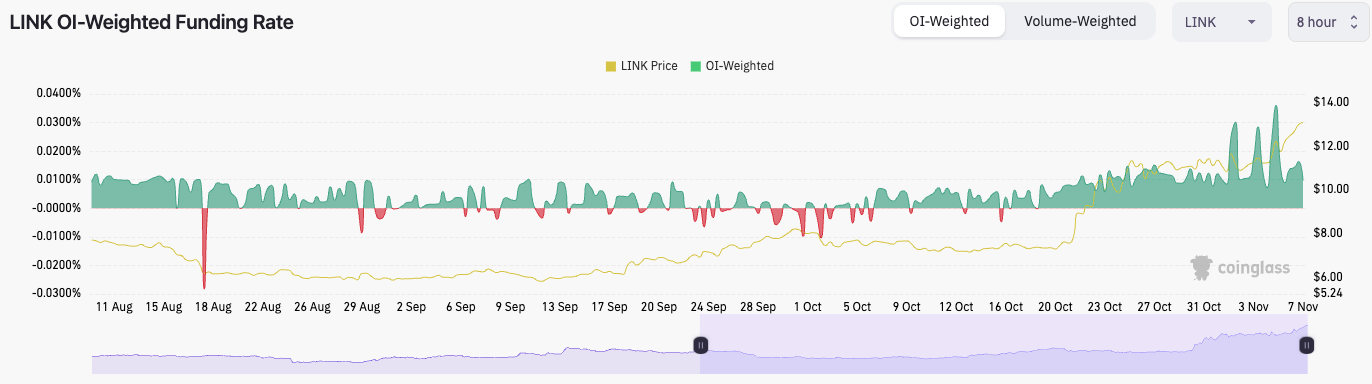
What this essentially means is that longs are piling in and then being flushed out or reduced, but the above looks more like flushing out - meaning longs are getting flushed out on price pullbacks.
If we look at the open interest, it’s very high, back to highs not seen since January 2022. This suggests an overheated leverage market, and we should be cautious of price here.
Cryptonary’s take
When we see that price is at a major horizontal resistance and initially rejecting into this level in the low $13’s. At the same time, open interest is phenomenally high, and longs have a track record of piling in and then being flushed out.This looks very vulnerable to a flush-out. We’ve seen mini flush-outs occur, and now, a major flush-out looks to be on the cards. We would, therefore, be very wary of LINK here. A major move down is likely on the cards for LINK if the derivatives market stays how it is. We would re-assess once/if LINK pulls back to the mid $11’s.
Recommended from Cryptonary