Save 23% ($351) & Get a Free 1-1 Call with our Team ⏰ : 0d 2h 59m 43s

For one, many people suspect that Iran is backing Hamas against Israel; if details emerge of Iran’s complicity in the actual attacks, it could further escalate the conflict.
Macro headwinds continue to mount for risk assets like crypto as bonds and equities look to the Fed for direction. Long story short, predicting Bitcoin's next move isn't straightforward.
This leads to our key question: Can BTC break past $28,300 in the near term?
Today, we start with a short video analyzing what all these macro trends mean for Bitcoin and then go into the charts of ETH, SOL, DOT, RUNE, and ARB to spot potential trades emerging.
Alright. Let's dive into the charts and see where the markets may be headed next.
TLDR
- ETH had a big move down yesterday, but it is bouncing from more major support. What next for ETH?
- SOL bounced at support; what does the short and long setups look like?
- DOT is extremely ugly, but could there be signs of a bullish long setup.
- Is it time to take profits on RUNE?
Disclaimer: Not financial or investment advice. You are responsible for any capital-related decisions you make, and only you are accountable for the results. “One Glance” by Cryptonary sometimes uses the R:R trading tool to help you quickly understand our analysis. They are not signals, and they are not financial advice. Any capital-related decision you make is your responsibility and yours only.
ETH | Ethereum
ETH had a big move down yesterday, but it is bouncing from more major support. What next for ETH?Technical analysis
ETH really struggled to hold the range yesterday, and we saw a big break below $1,625, breaking below the local uptrend. The positive is that we bounced nicely off the $1,552 horizontal support but remained below the local uptrend. We need to see ETH recover and reclaim the $1,625 level. So far, this doesn’t look too appealing to us.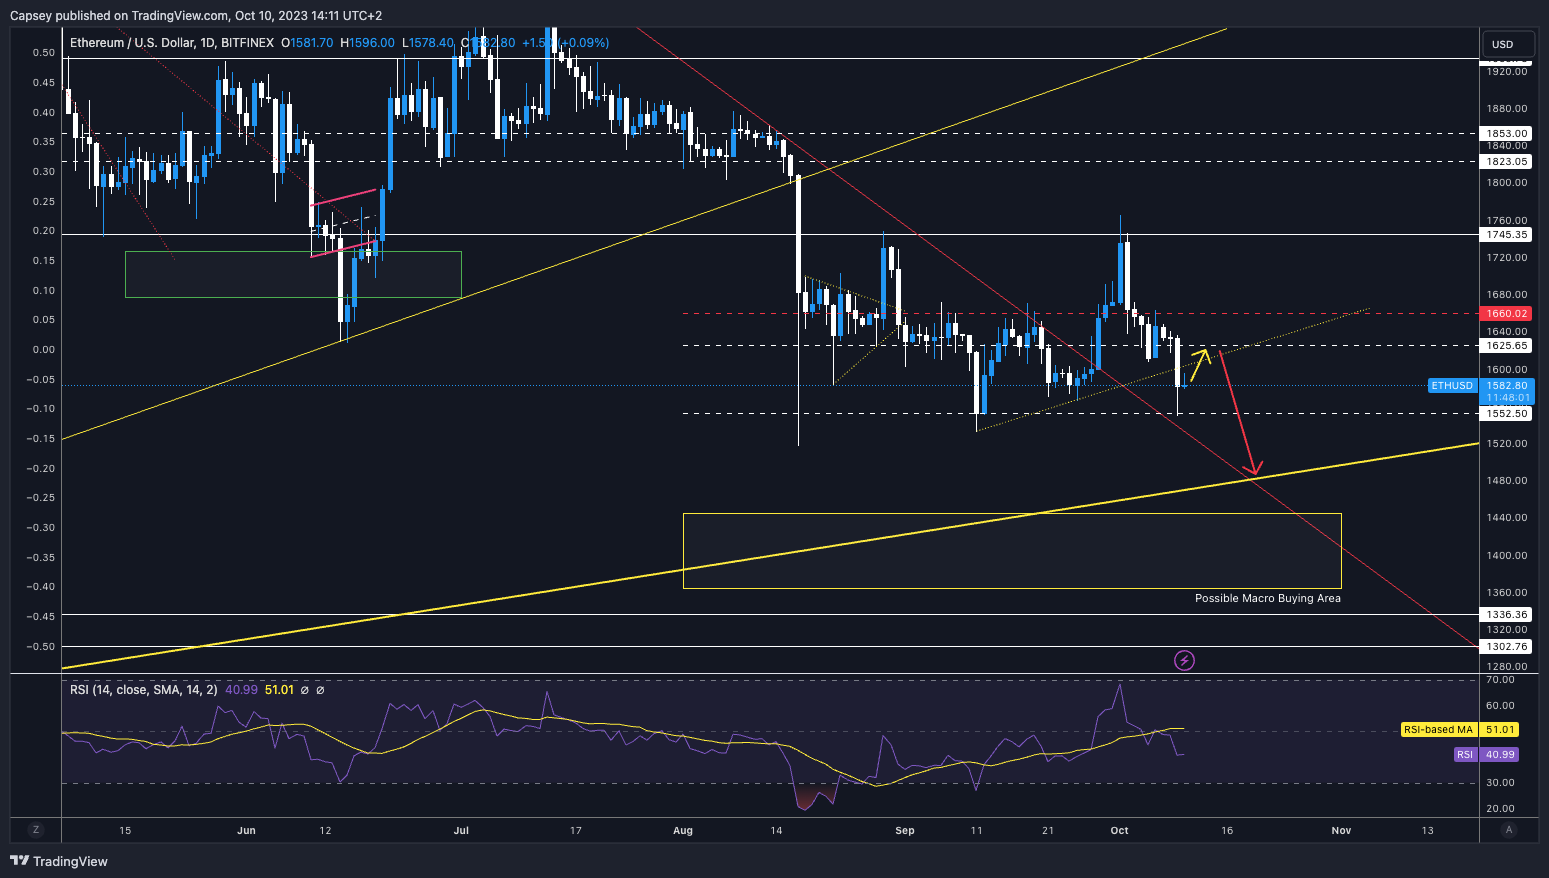
RSI and funding rates
The RSI is at 41 on the daily timeframe, so there is further room to go lower still. The funding rate is more positive, so ETH is being re-longed again. But there’s no real clarity direction-wise from this information for now.Conclusion on trading ETH
We think ETH looks weak here; the loss of the $1,625 level suggests this. If we then compare ETH to BTC, we can see that recently ETH has bled against BTC – showing a draining of liquidity in Alts away from BTC. In the very short term (next few days), we could have a bounce back to the $1,625 level. But from there, we believe that ETH goes lower and tests into the late $1,400’s.Action
We are still steering clear of this. However, if we do break down, we will be looking to begin some DCA’ing of ETH into the $1,400 level if we do go that low. It won’t be large amounts of USDT being used, but it would be wise to begin some light DCA’ing.SOL | Solana
Like ETH, SOL found support at its next horizontal level at $21.86, having come down due to the rest of the market coming down.Technical analysis
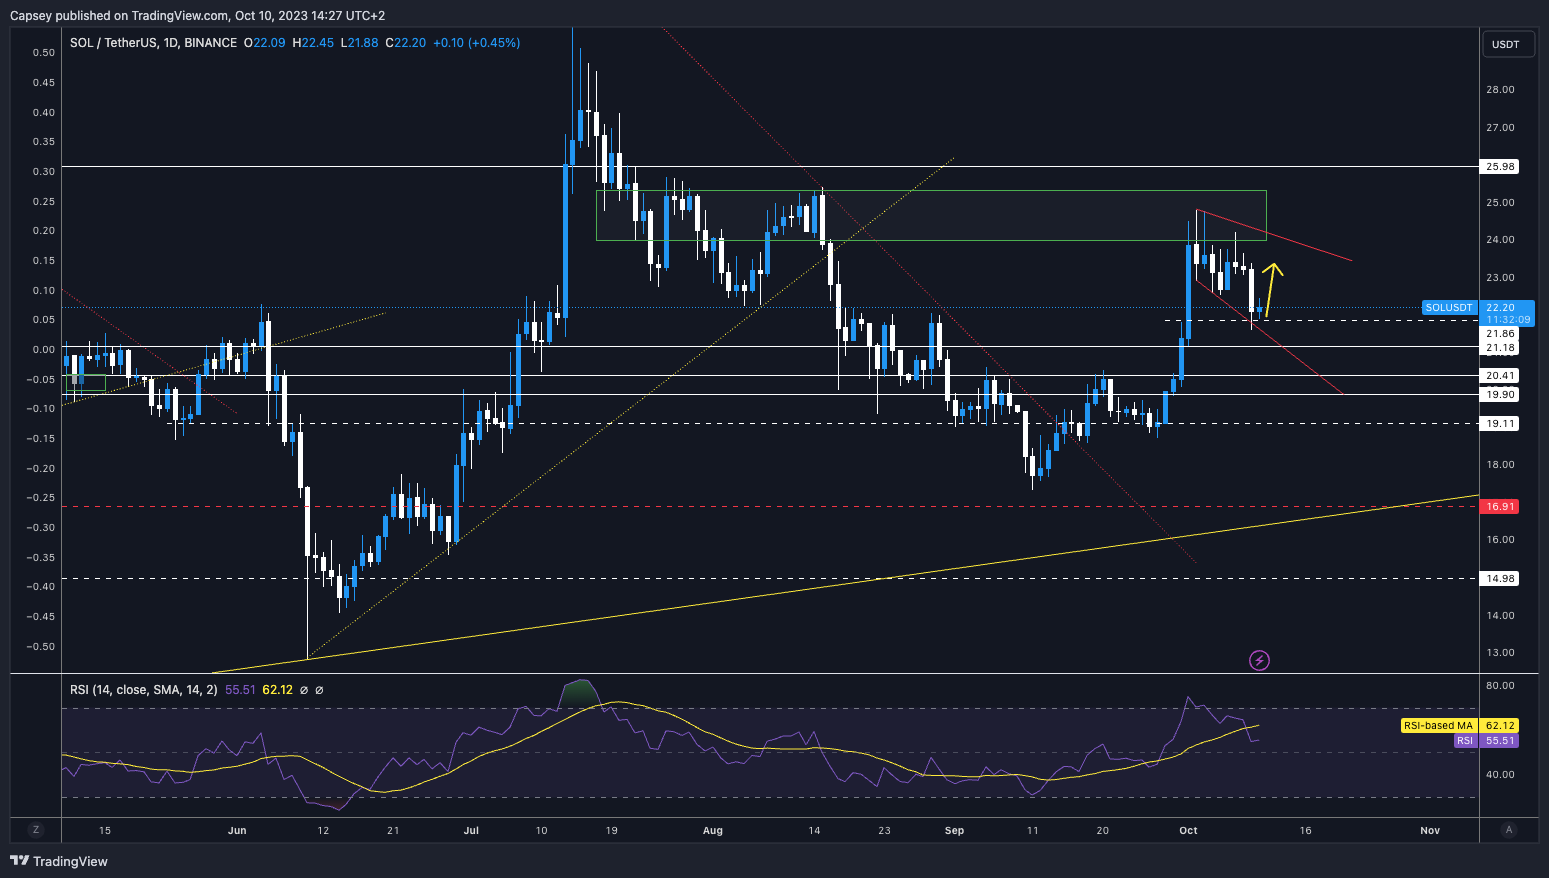
It’s relatively simple here, and there’s no need to over-complicate this. We remain in the broadening wedge pattern because ETH brought the rest of the market lower with it yesterday. But SOL has found some support at $21.86, and it’s now crucial we remain above this level. If the $21.86 level is lost, SOL will likely fall back into the range of $20.41 to $21.18.
RSI and funding rates
The RSI has reset here; there’s nothing regarding divergences, and it is back to neutral territory at 55. The interesting thing will be if the price does come down to the $20.40 to $21.18 level, then this will likely form a hidden bullish divergence on the RSI. That could be a swing long play. The funding rate is really quite negative, so this would support the price going higher as there may be too many shorts here that may be vulnerable to being liquidated.Conclusion on trading SOL
We think SOL can push higher here as long as BTC and ETH can hold up, particularly if the S&P can push higher onto the $437 - $440 level. A move higher in SOL would likely reset the funding rate to more neutral territory again, and then if the price gets to, say $23.20 to $24.00 range, that might then be the time to look for shorts.Action
For now, we’re interested in SOL for a trading opportunity. If SOL can get back to $24.00, this would be the area for shorts, assuming funding rates have reset. The more degens among you may even wish to take a long position from the current price of $22.19 up to, say, $23.00.
DOT | Polkadot
It’s still super ugly, but it’s starting to get to the area and show the right signs for a potential trade. Let’s get into it.Technical analysis
We identified yesterday that the $3.90 horizontal support was key for the price to hold above. Unfortunately, the price closed below this level, and today’s price action shows the DOT down 1.55%. In contrast, the rest of the market is trying to find a local floor or even trying to bounce slightly. So yeah, DOT looks weak here. The area of interest for buying/longing is between $3.50 to $3.70. Let’s find out why.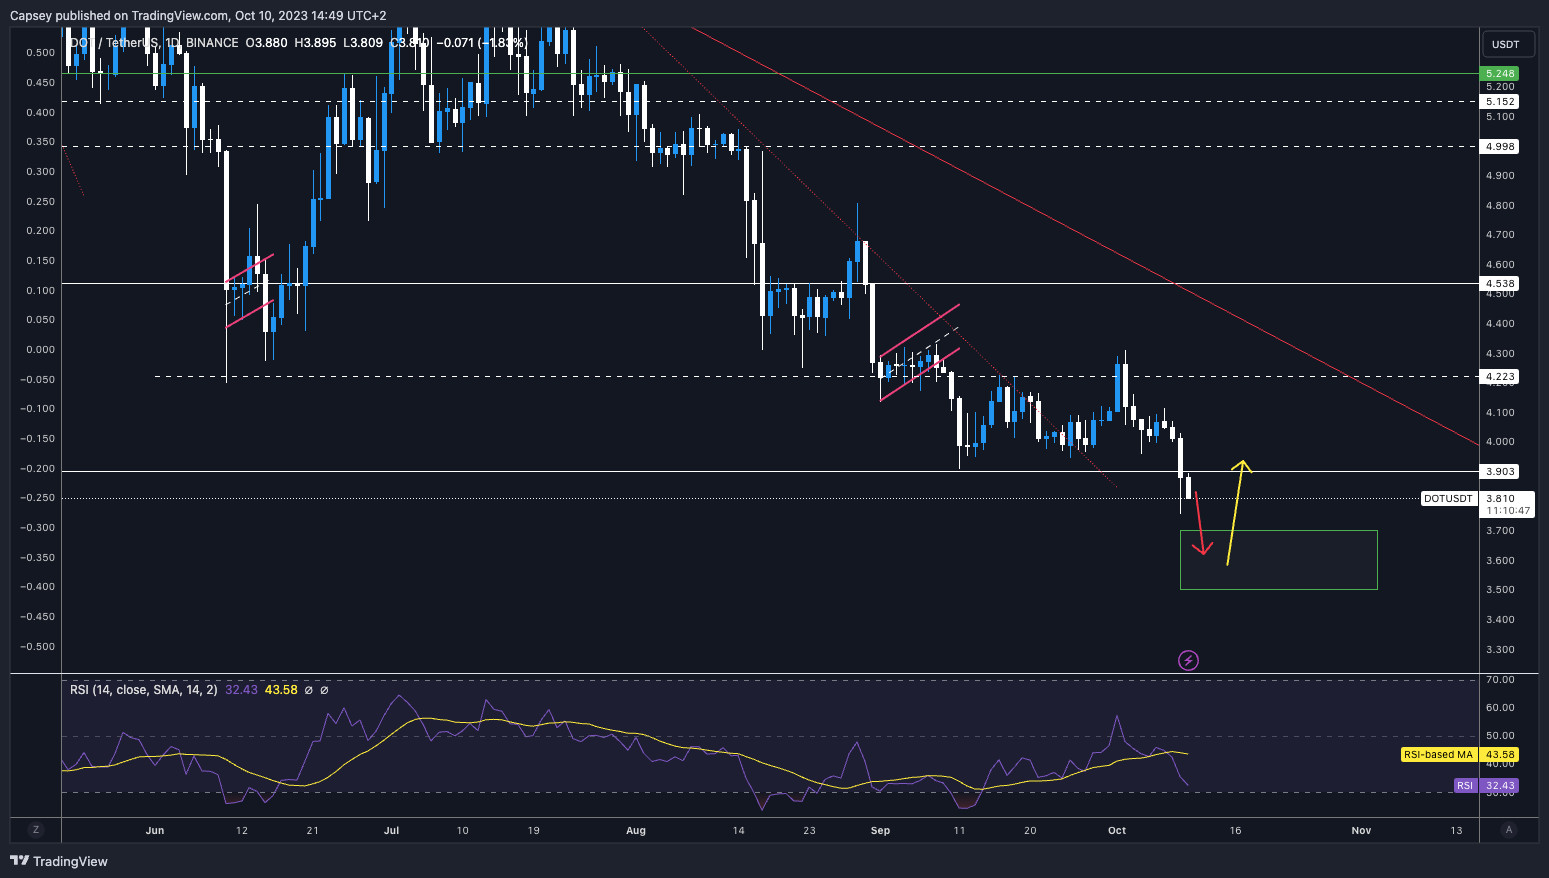
RSI and funding rates
The RSI is key. If the price can go lower and push the RSI into oversold territory while giving us a higher low compared to the September 11th low, then this would be a bullish divergence in oversold territory.That can be a good short-term buying opportunity to get a bounce, at least. Funding rates are relatively negative, so a few shorts are piling into this. Usually, an overly short market doesn’t continue driving lower.
Conclusion on trading DOT
We’re watching DOT relatively closely here. We’d like to see a further move lower to the green box area. Once there, we’ll be watching to see if the RSI can extend into oversold territory and create that bullish divergence. If we get this, that could present a good buying/longing opportunity, at least targeting a short-term bounce.Action
Waiting for now. We have the trade thesis setup; let’s keep watching and see if we’re presented with the opportunity.RUNE| THORChain
Finally, some buying came in.Technical analysis
RUNE is at a crucial point here, having sold off dramatically; it found support at the horizontal level of $1.61. We’re now looking for a relief bounce, but so far, the local horizontal resistance immediately above us at $1.68 has acted as a resistance level for the price. Really, we should get more in terms of a relief bounce, particularly if BTC and ETH hold up, and therefore, we could be open to a move to $1.68 before getting further downside.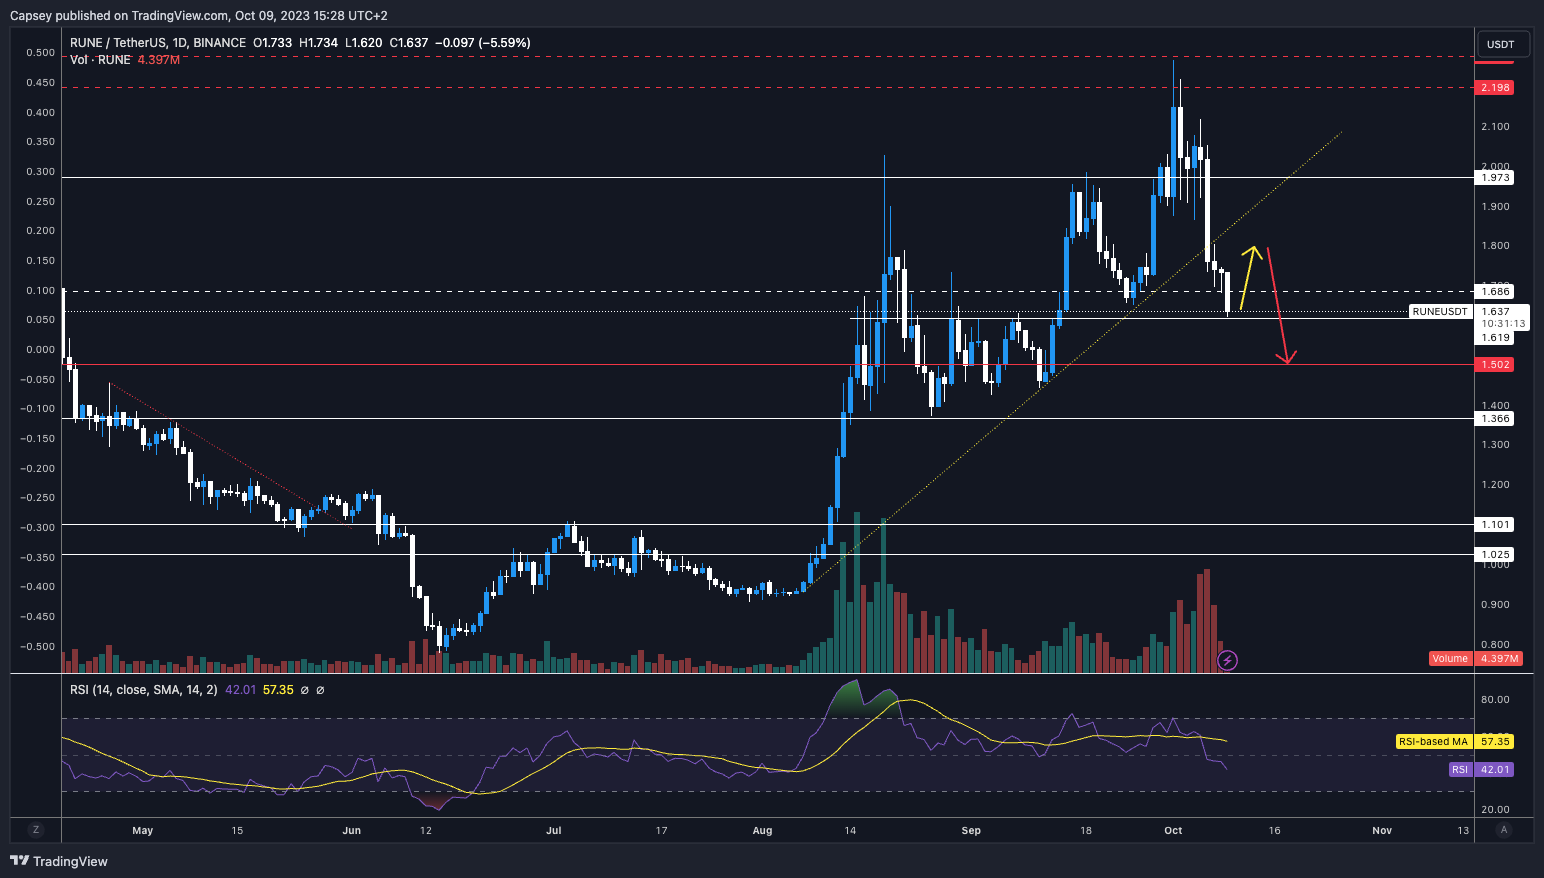
RSI and funding rates
The RSI has reset to a more neutral territory at 44. The funding rate has now turned positive, showing that positioning has likely been reset slightly here. Nothing here to really indicate future movement, but we still need to be aware of it.Conclusion on trading RUNE
The feeling is that RUNE is due a relief bounce here, but we wouldn’t be looking to long from here. Instead, we would look to offload some of our size into any rallies into the $1.80 area if the price can get there.Action
If we held a big spot bag of this and didn’t sell some of our size into the $2.00 area, we would aim to target the $1.75 to $1.80 area to trim a considerable portion of our RUNE holdings. No change from this. Would look to accumulate bigger bags at much lower levels, south of $1.36.
ARB | Arbitrum
Another that has lost some key levels or just couldn’t build some support on the key levels and go higher from there.Technical analysis
Initially, ARB looked great when it broke out of its main downtrend line. However, the rejection into the $1.00 level is telling. You would then want to see the downtrend line hold as support, especially as there was confluence with the $0.92 horizontal support. Unfortunately, the price broke below. You then look and want to see the price hold above the $0.86 level as if lost; this would look ugly. Again, unfortunately, all of this has happened, and ARB’s price is now trying to find new support in the liquidity area of $0.80 to $0.85.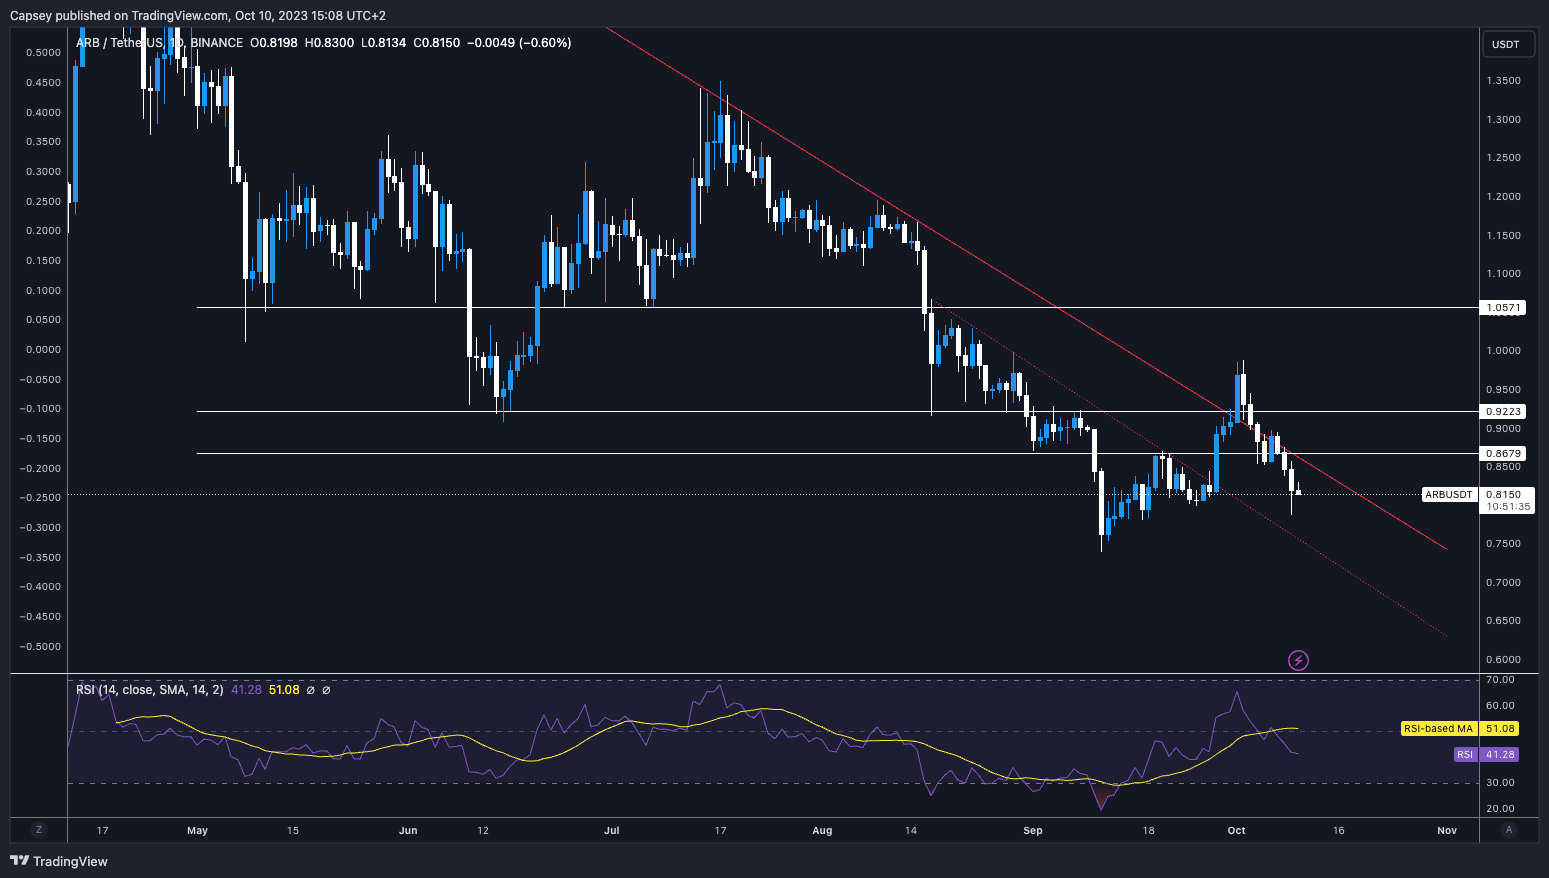
RSI and funding rates
The RSI is at 41, so nowhere near being over-sold, meaning that this still has more downside potential. We looked as if ARB could have formed a hidden bullish divergence, but that has not yet materialised as of yet, and our feeling is that it won’t materialise.Conclusion on trading ARB
Overall, ARB hasn’t been able to hold above key levels, and even though the general market may help ARB to get some relief, we think this looks weak and is likely to go considerably lower in the coming months.Action
If a relief rally can happen, then it may be wise to reduce some exposure to ARB. Our feeling is that in the coming months, ARB could reach as low as $0.50 to $0.60 area.Cryptonary’s take
And that wraps up our analysis on BTC, ETH, SOL, DOT, RUNE, and ARB for today.The markets are looking shaky overall amid the macro uncertainty.
Remember that ETH and ARB are looking weaker, so we'll be cautious with any new positions there. If the indicators align, there may be some potential long setups emerging on SOL, DOT, and RUNE at key support levels – but we aren’t holding our breath for these trades.
As always, have a plan for every trade and stick to your risk management. Don't overexpose yourself in choppy markets like these. Patience and discipline will win out in the long run.
Cryptonary OUT!
Recommended from Cryptonary


