Save 23% ($351) & Get a Free 1-1 Call with our Team ⏰ : 0d 2h 59m 43s
Cardano Tracking Report
We start with Cardano's weekly chart, establishing our top-end ($0.1037) and baseline ($0.02723) levels. These will be our longer-term reference points. Cardano's fundamentals had been strong in recent months. With the Mainnet update to v1.5 quickly followed by the announcement of Ledger Nano S support both in March, the price continued to rally to above $0.10 at the beginning of April.
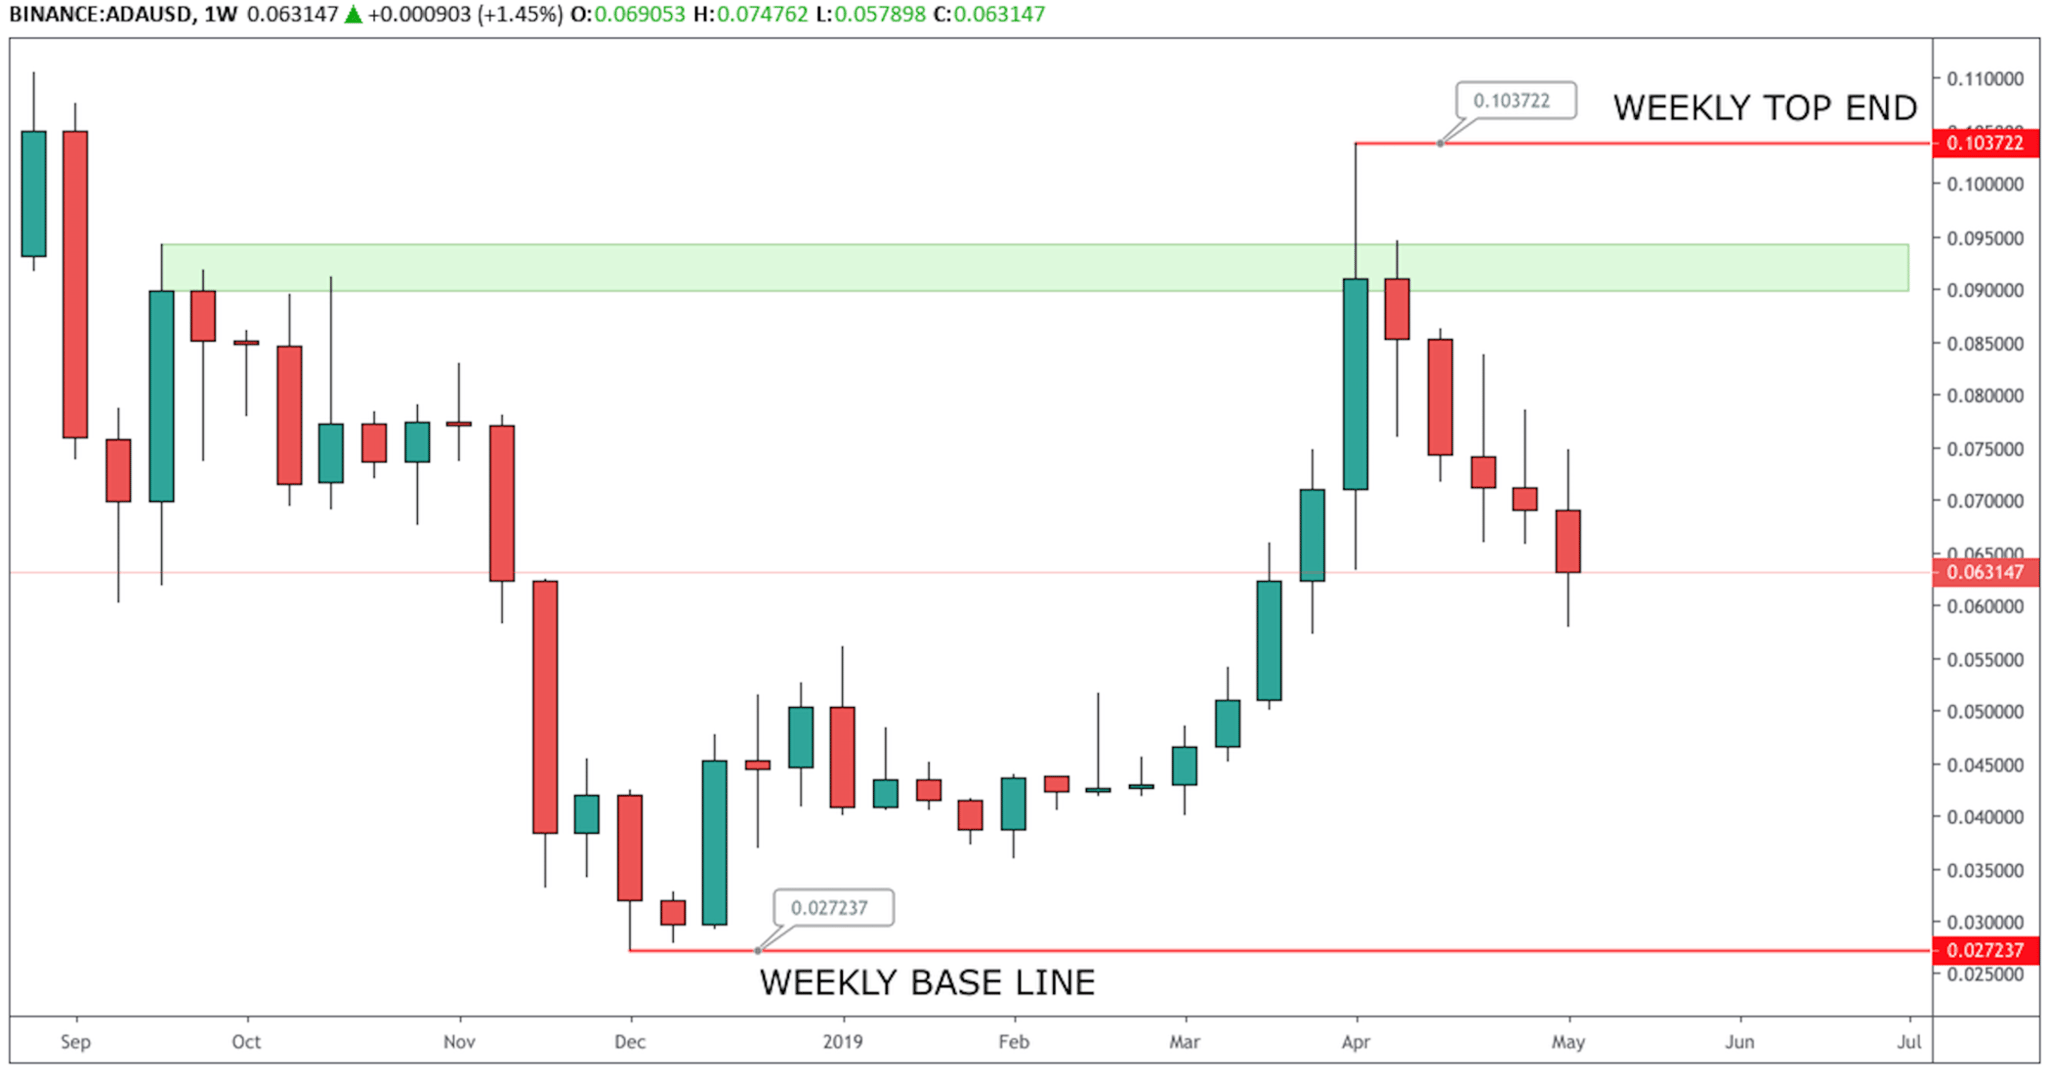
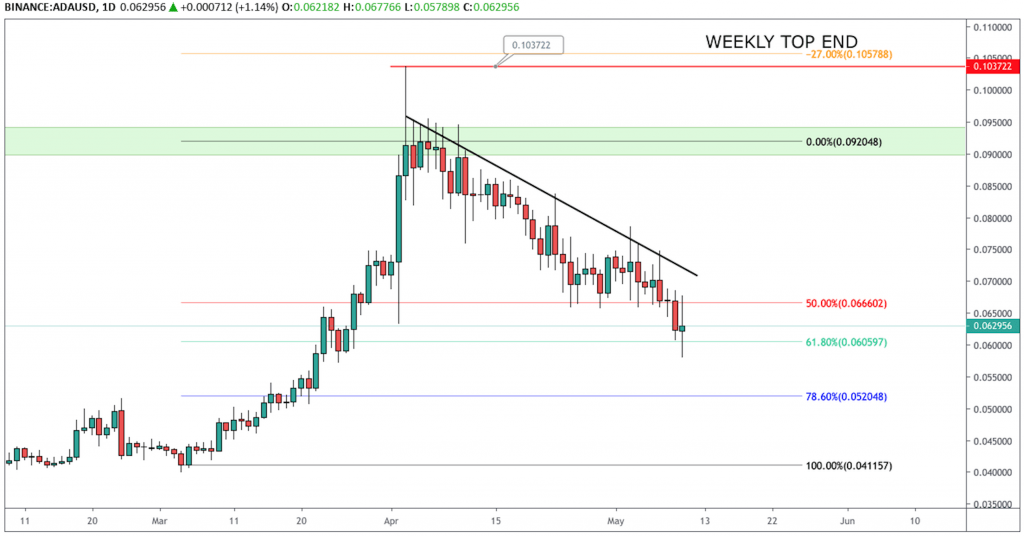
The highlighted green zone ($0.0898-$0.0942) is a clear level of resistance and where there is a high probability that sell orders will be placed. The daily chart illustrates this region has had multiple attempts to break out of, with no success. This led to a healthy pullback in price, since that April 3rd high. The descending trendline has held firm during this period, and we have now approached a significant 61.8 Fibonacci retracement level - at $0.0605. This would be the first real point where a reversal could occur. Price action also stalled around this area around 22nd-23rd March.
Whilst we cannot be sure that a reversal will occur around this region, the pullback from $0.1037 to $0.0605, gives us a good opportunity to profit should it do so. The -27% extension targets also align just above the previous top-end level. We will revisit this next week to see the reaction to the 61.80 level being met.
Recommended from Cryptonary


