Save 23% ($351) & Get a Free 1-1 Call with our Team ⏰ : 0d 2h 59m 43s
Technical Analysis
Catching the next Wave: Pendle's bullish structure signals
Pendle has displayed a bullish structure, with notable rallies pushing the token to a new all-time high in mid-2024. Despite several retracements, the asset has shown resilience, bouncing from key support zones. With Bitcoin's bullish momentum helping to drive altcoins higher, Pendle appears primed for a breakout.

Overview
As Bitcoin gears up for its next potential move amidst favorable macro conditions, assets like Pendle are positioning themselves for strong runs. $PENDLE is a DeFi token known for its yield-trading mechanisms, providing an innovative approach to the DeFi ecosystem. Over the past year, Pendle has established solid market momentum, marked by several bullish rallies followed by periods of consolidation, creating prime accumulation zones for long-term investors.Disclaimer: This is not financial or investment advice. You are responsible for any capital-related decisions you make, and only you are accountable for the results.
General market structure
Pendle's price action has been defined by its large rallies and pullbacks, leading to accumulation zones that provide opportunities for strategic buying. After reaching an ATH of $7.5 in 2024, Pendle retraced in a series of bearish swings, testing key support levels. However, its overall market structure has remained bullish, with Pendle continuously holding its higher-low structures after these corrections.Pendle has recently broken out of its downtrend trendline (marked by the orange dotted line) and flipped the 200 EMA on the daily timeframe. This is a significant indicator of bullish momentum returning to the asset. The 200 EMA, currently at $3.67, is now acting as support alongside the demand zone between $3.10-$3.61, which adds to Pendle's bullish outlook.
Current market outlook
With Bitcoin hovering above key resistance levels and the wider market beginning to heat up, Pendle is setting up for its next bullish move. Price action shows that Pendle is breaking out of its downtrend trendline and is now trading above the 200 EMA -- a critical level for bullish momentum.- Support levels: Pendle is holding support above the demand zone at $3.10-$3.61, bolstered by the 200 EMA now acting as confluence support. This area is critical, as losing this support could bring the price back into a consolidation phase.
- Resistance levels: On the upside, Pendle faces resistance at $4.64 and $5.78. These levels are likely to act as key hurdles for the price to overcome in the short to medium term. If Pendle can push past these resistance levels, we could see a move toward the ATH of $7.5.
Potential DCA zones
For those looking to accumulate, the $3.10-$3.61 zone remains an ideal DCA (Dollar-Cost Averaging) range. This zone has proven to be a strong area of support, as Pendle has bounced from these levels multiple times. If the price dips below the 200 EMA, the $2.60-$3.00 range could be the next strategic zone to accumulate for long-term holds.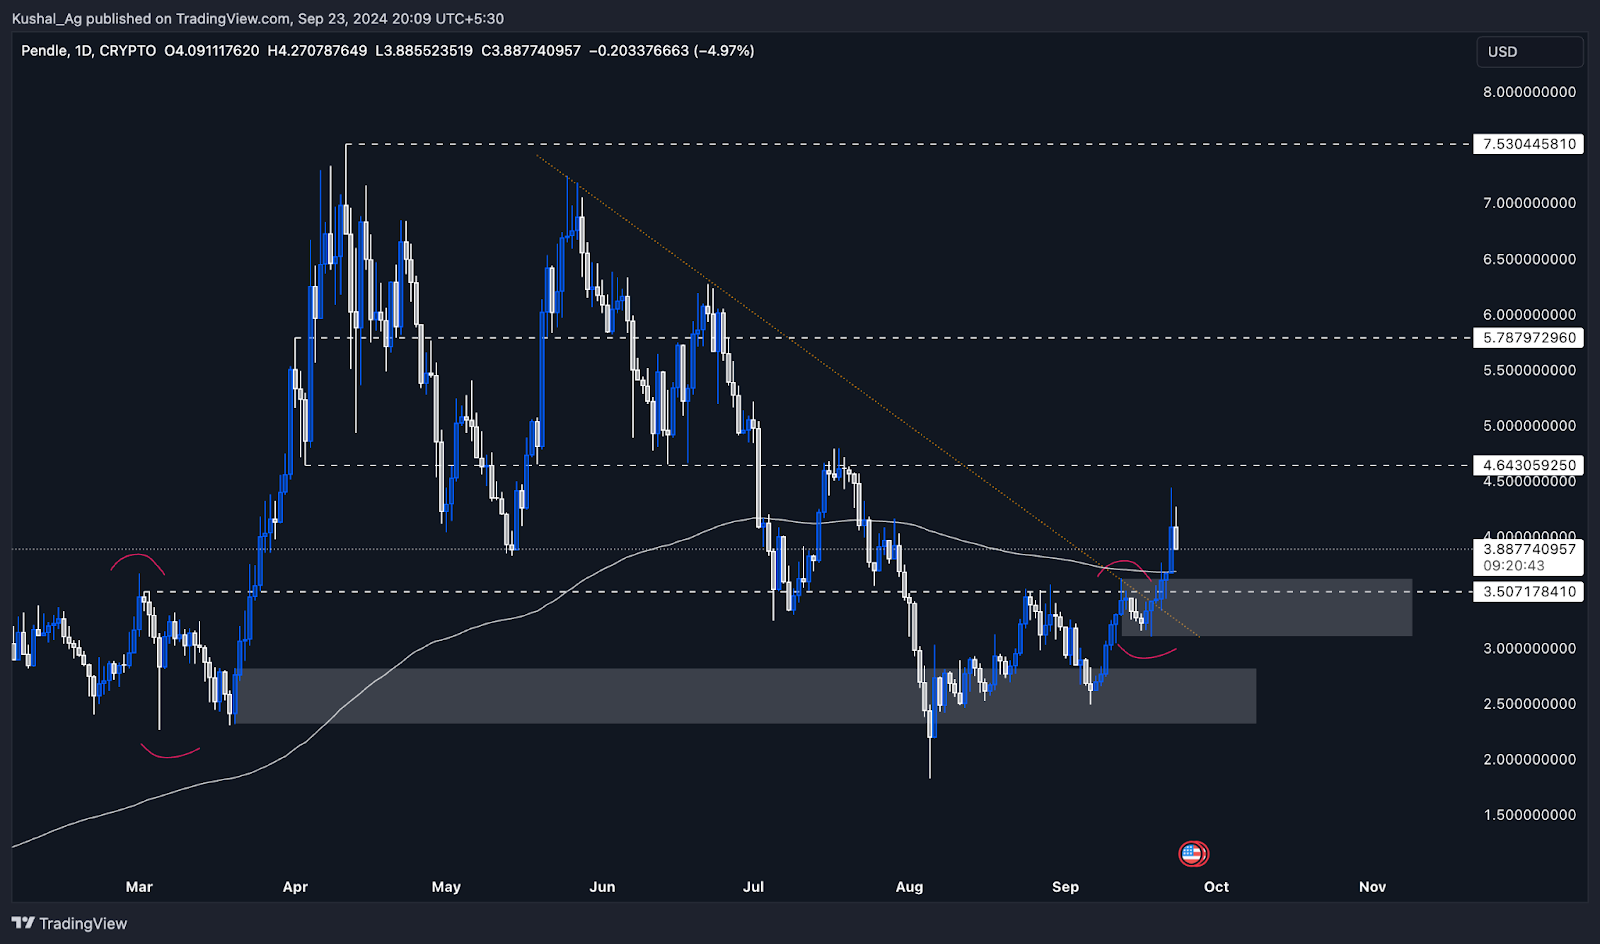
Cryptonary's take
Pendle is displaying strong technical indicators and is aligning with the broader bullish sentiment of the crypto market, particularly as Bitcoin leads the charge. The asset's current market structure, a breakout above the 200 EMA, and proximity to key support zones all point toward a favourable setup for the coming weeks. The next critical step for Pendle is to break through the resistance at $4.64 and $5.78, which could unlock a potential move toward its ATH of $7.5.Recommended from Cryptonary


PRO
Market Updates
9 min read
Mar 20, 2026

Market Pulse
2 min read
Mar 19, 2026
Market Pulse
4 min read
Mar 19, 2026
