Save 23% ($351) & Get a Free 1-1 Call with our Team ⏰ : 0d 2h 59m 43s
Technical Analysis
Chainlink (LINK) technical analysis: $12.7 resistance or $9.63 support next?
Chainlink is positioned near $12.7 resistance, forming a bullish wedge while holding support at the 200 EMA. This setup suggests a potential breakout, but with $9.63 support, LINK may retrace before continuing its upward trend. Discover LINK’s technical insights.

Disclaimer: This is not financial or investment advice. You are responsible for any capital-related decisions you make, and only you are accountable for the results.
Overview
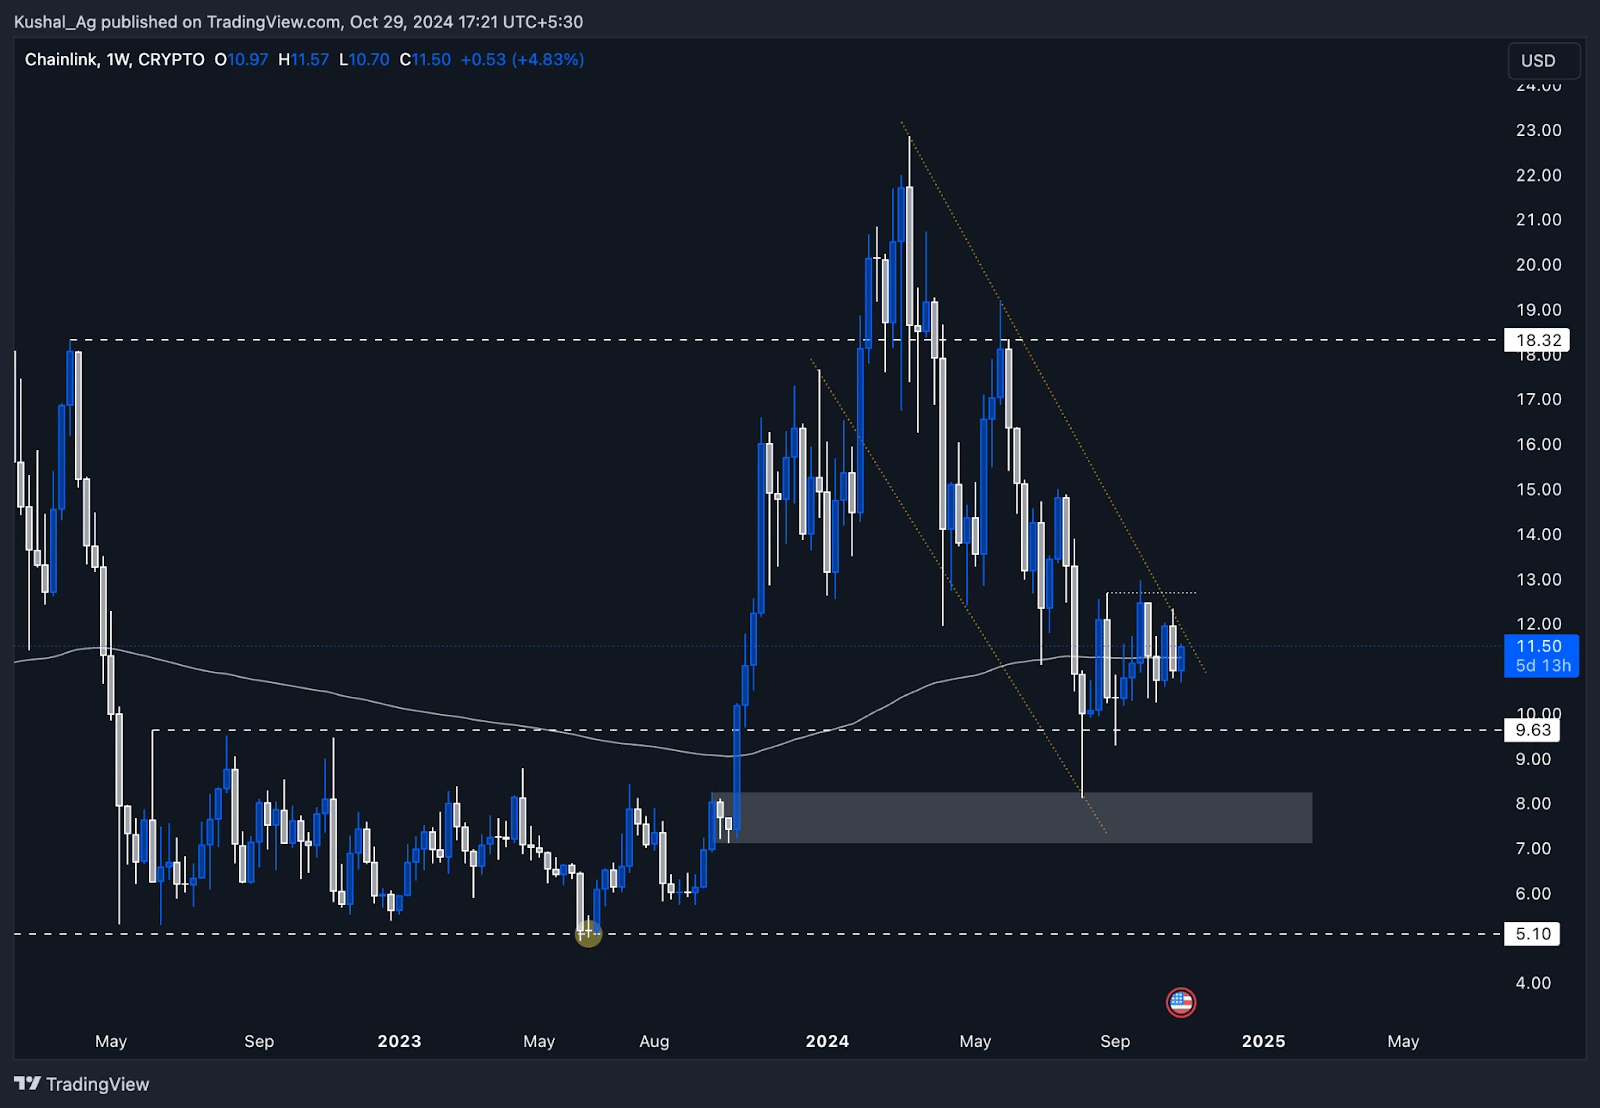
ChainLink ($LINK) has been consolidating in a gradually upward-squeezing structure, maintaining equal highs while consistently making higher lows. This pattern forms a bullish ascending wedge, signalling a potential continuation of momentum.LINK's price is also trading just below the upper boundary of a bullish flag channel, as identified in previous analyses, and is testing the 200 EMA on the weekly chart. The 200 EMA often acts as a key support in larger time frames, indicating a probable local bottom or a higher low if LINK sustains above this level.
Weekly analysis
On the weekly time frame, ChainLink's price action indicates two potential scenarios:- Bullish breakout: If LINK breaks above the $12.7 resistance level (upper boundary of the bullish flag channel) and closes above it, this could initiate a breakout. A closing above this level would indicate bullish momentum, potentially pushing LINK higher in the short to medium-term.
- Liquidity grab and support: Given the ascending wedge structure, a downside liquidity grab may occur, targeting stop-loss levels below the recent higher lows. In this case, $9.63 would serve as a strong support, where LINK may retrace before continuing its upward trajectory.
Cryptonary's take
ChainLink presents a compelling structure on the weekly chart. Positioned just below the upper channel boundary of a bullish flag and finding support at the 200 EMA, it's primed for potential continuation. The coming weeks will be essential in determining whether LINK breaks through the $12.7 resistance or experiences a liquidity dip before resuming its uptrend.Recommended from Cryptonary


PRO
Market Updates
11 min read
Mar 27, 2026

PRO
Market Direction
11 min read
Mar 24, 2026

PRO
Market Updates
8 min read
Mar 23, 2026
