Save 23% ($351) & Get a Free 1-1 Call with our Team ⏰ : 0d 2h 59m 44s
Charts Look Bullish: Key Levels for BTC, ETH, and More
The crypto market continues to show resilience, with bullish trends dominating despite looming tariff-related uncertainties. Key assets like BTC, ETH, and SOL are poised for potential breakouts, while HYPE and AURA present unique opportunities. Here's a detailed look at the current market

Disclaimer: This is not financial or investment advice. You are responsible for any capital-related decisions you make, and only you are accountable for the results.
TLDR:
- Market remains bullish overall, despite potential tariff-related volatility.,
- BTC consolidating below $112k; targeting $120k on breakout.,
- ETH stable above $2,420; aiming for $2,870 in coming weeks.,
- SOL retesting $144 support; positioned for move toward $185.,
- HYPE facing resistance; likely pullback to $36-$33 zone.,
- AURA forming bullish Cup-and-Handle; targeting $0.24 short-term.
BTC:
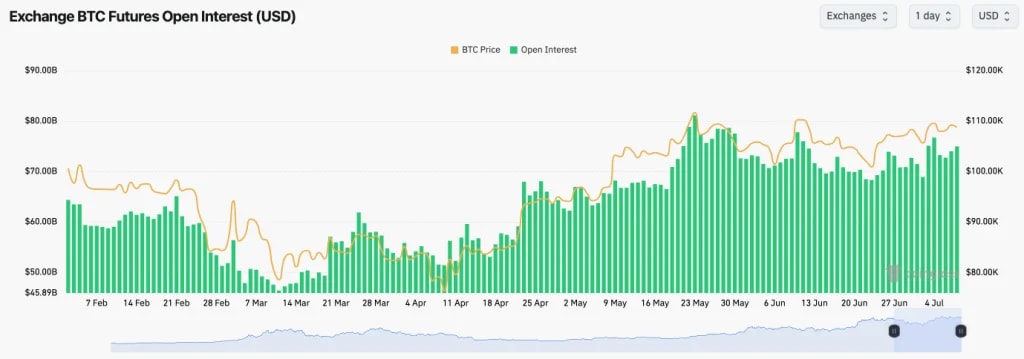
- BTC's Open Interest has remained relatively flat over the long weekend, whilst the Funding Rate has fluctuated between slightly positive and negative. This suggests indecision amongst traders.
TA:
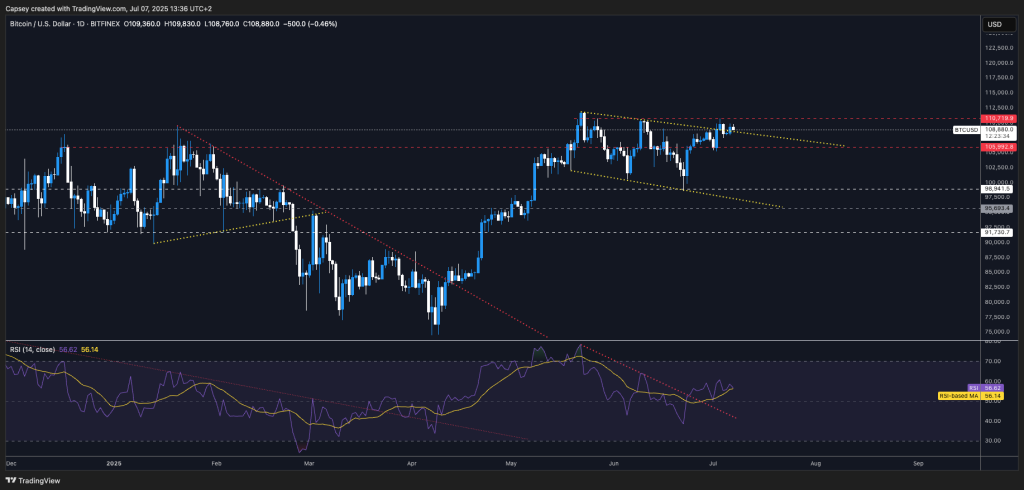
- Over the weekend, BTC pulled back and tested a local horizontal support level at $107,500, with price bouncing from that level.,
- Price remains below the major horizontal resistance of $110,700, with the next level at $112,000. Should price break above this resistance zone, then we'd expect it to swiftly push on to $120k.,
- To the downside, the major horizontal support is at $106,000, although the zone of support extends down to $102,500.,
- BTC is now finding support on top of the top border of the broadening wedge. This looks like a consolidation before a larger scale breakout above $112,000.,
- The RSI is in middle territory and it's using its moving average as support. This has room to move higher, supporting a potential price breakout to $120,000.,
Price may consolidate in the short-term as tariff headlines play out. However, our expectation is that price breaks out of the $112k resistance in the coming 1-2 weeks and pushes onto $120k.
ETH:
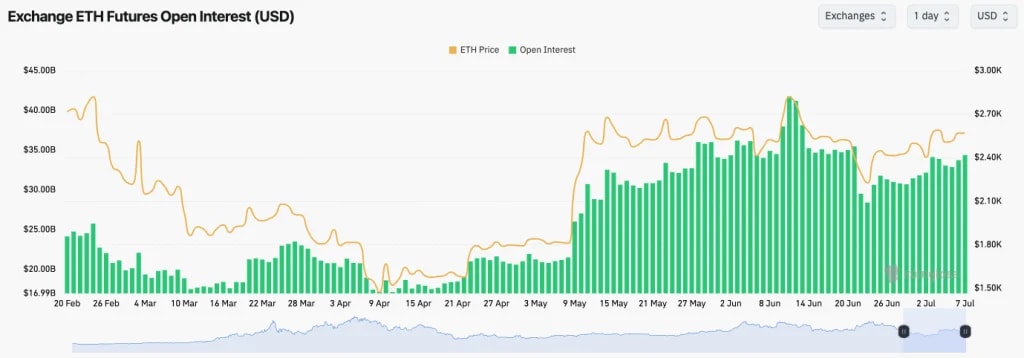
- ETH's Open Interest has also remained relatively flat, although its Funding Rate is at 0.01%, suggesting that there is a bias amongst traders to be Long rather than Short.,
TA:
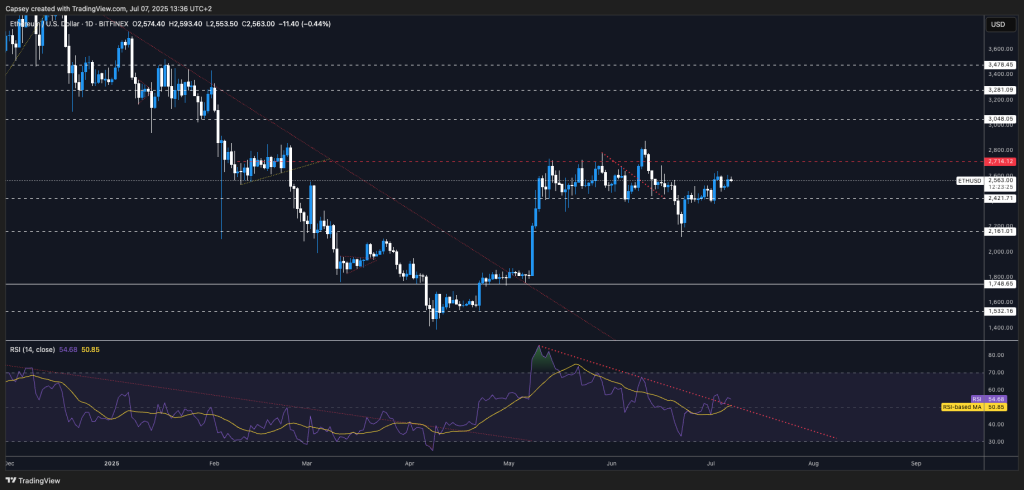
- After price bounced from the major horizontal support of $2,420, price has now settled in the middle of the range (between $2,420 and $2,720).,
- The resistances above remain $2,720 and $2,870, although $2,720 is the more key level for price to reclaim above.,
- The mid-level of the range is approximately at $2,550. Price is now currently battling at that level.,
- Should price breakout of $2,720, price will likely swiftly retest $2,870, and may even push on to $3,050. This is a mid-term target for us, for ETH.,
- The RSI is looking good here. It's breaking out of its downtrend line, whilst it's in middle territory (therefore there's room to go higher), and it's above its moving average, and using that as support.,
ETH is ultimately bullish above $2,420, however, if there are dips back to $2,160 to $2,420, we'll look to accumulate on dips for long-term positioning. It is not our base case that we'll see ETH dip back into this range though, as our view is that ETH will reclaim $2,720 to $2,870 in the next fortnight.
SOL:
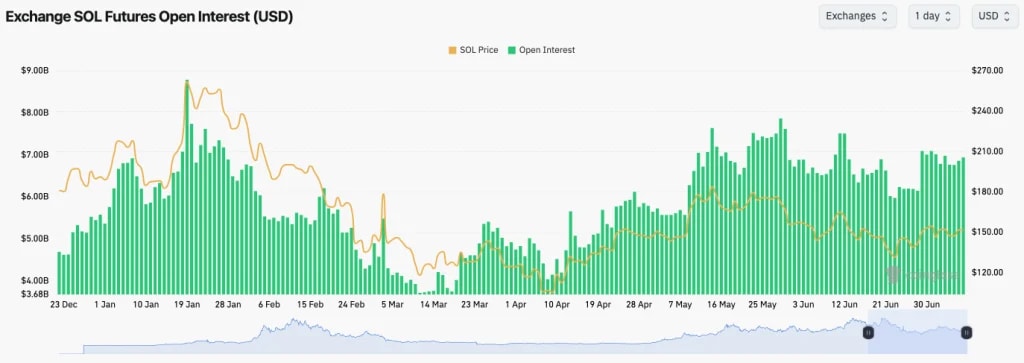
- Like BTC and ETH, SOL's Open Interest has mostly been flat over the last week.,
- SOL's Funding Rate has mostly been positive suggesting that there is a slight bias amongst traders to be Long rather than Short. However, SOL's Funding Rate is susceptible to greater fluctuations.,
TA:
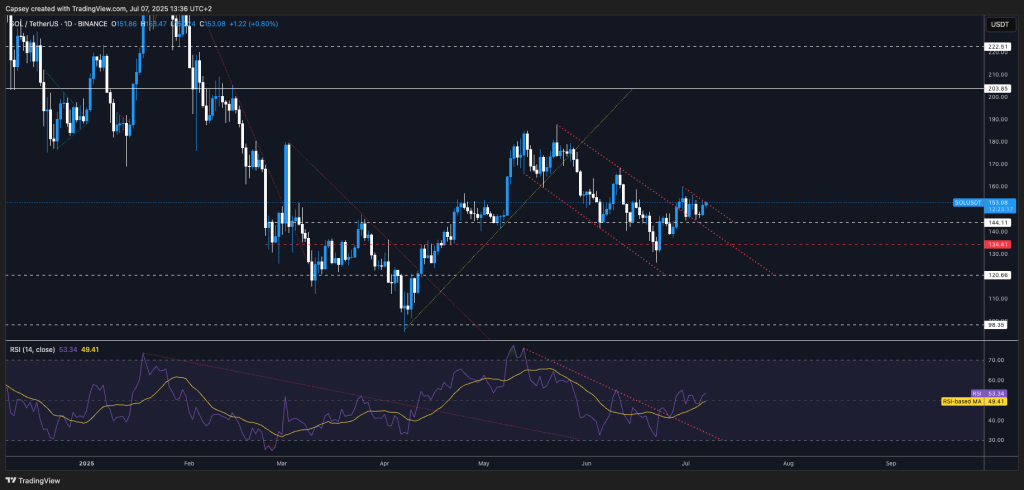
- Price bounced and swiftly recovered the major horizontal level of $144.,
- Price has since broken out of the main downtrend channel, and pulled back to retest the $144 level as new support.,
- SOL is now squeezing into its local downtrend line with a breakout to the upside looking likely.,
- The local horizontal resistance to the upside is $155, with $185 being the major horizontal resistance beyond that.,
- To the downside, $144 is the key horizontal support, with $125 to $135 also being a strong zone of support.,
- The RSI has broken out of the downtrend whilst it's using its moving average as support. It is also in middle territory, so there is room for upside here.,
HYPE:
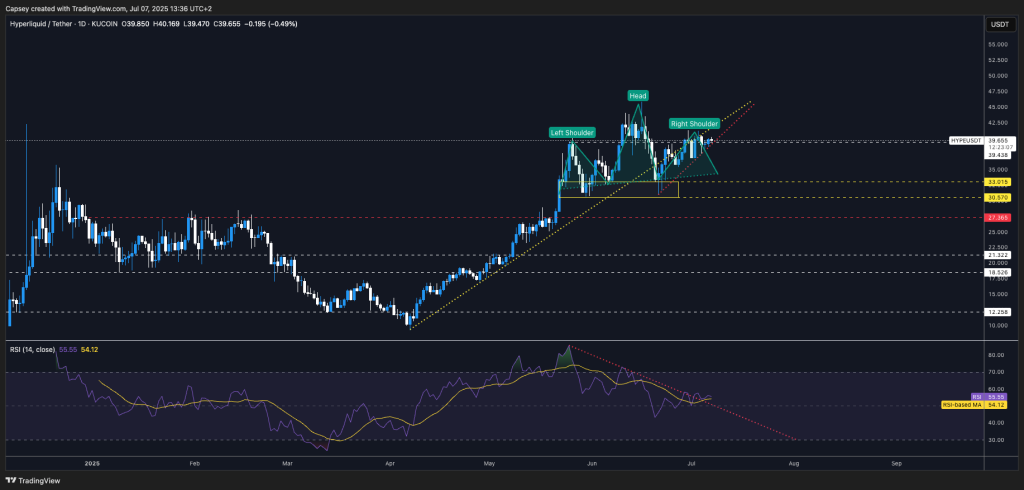
- HYPE continues to battle and the converging resistance area of the underside of the uptrend line, and the major horizontal level of $39.40.,
- Beyond this level, there is a strong resistance zone between $42.30 to $44.00.,
- Price is also forming a 'Head-and-Shoulders' pattern, currently putting in the right shoulder. These patterns tend to have a bearish bias.,
- Price is now also delicately balanced on top of a short-term uptrend line. Should price break below this line, then the potential pullback target is $36.60.,
- To the downside, $36.60 is a local support, with $30.50 to $33.00 being a strong zone of support, and a level which we'd look to add HYPE for the long-term, should price revisit this level.,
- The RSI is breaking out of its downtrend whilst it's in middle territory. However, it is battling at its moving average to maintain it as support.,
A breakout above $44.00 would invalidate this short-term bearish thesis. Should price revisit the $30.50 to $33.00 zone, we'd look to buy HYPE with a view to holding the position for the next 12 months.
AURA:
- Note: we continue to analyse AURA from the 4hr chart timeframe rather than the Daily timeframe for now.,
- AURA broke out of its main downtrend line, and price has now begun establishing itself in a new range between $0.130 and $0.157.,
- To the upside, the local resistance levels are at $0.157 and $0.177, with $0.20 (a psychological level) and $0.245 being the more major horizontal resistances.,
- To the downside, the major horizontal supports are at $0.130 and $0.117. We expect the $0.104 to $0.117 area to be a very strong support zone, should price revisit these levels, although it isn't our base case that it does revisit these levels.,
- On the local timeframes, price has broken out of a local downtrend line, with price now pulling back to the local downtrend line and using it as new support.,
- The RSI on the Daily timeframe is in middle territory, so there is room for price to move in either direction. This indicator isn't overextended in either direction.,
Although, we don't rule out a retest of the $0.085 to $0.116 and the base to form out more, however, this isn't our base case. Our expectation is for the next short-term move to be a retest of $0.20 to $0.24. Over the longer-term, our base case is for AURA to become a multi-billion $ meme, and at just a $130m MCap, AURA is currently a good risk/reward play.

Closing Thoughts:
This week we might experience some volatility off the back of tariff headlines. However, if we're given meaningful pullbacks, we'll use that as a buying opportunity.Overall, the market is still setup bullishly, and therefore we continue to be proactive and looking to add to our positions throughout the summer period.
Most Majors look bullish here, and our meme pick ($AURA) has also weathered a redistribution period fantastically well, with the structure now forming a 'Cup-and-Handle' pattern, which would have a breakout target of $0.35 - $0.40.
We are looking forward to the next 12 months and what this market will bring us.
Let's Go!!!
Recommended from Cryptonary


